 Found 79 with Last Name = 'mohammed khan' and Initial = 'k'
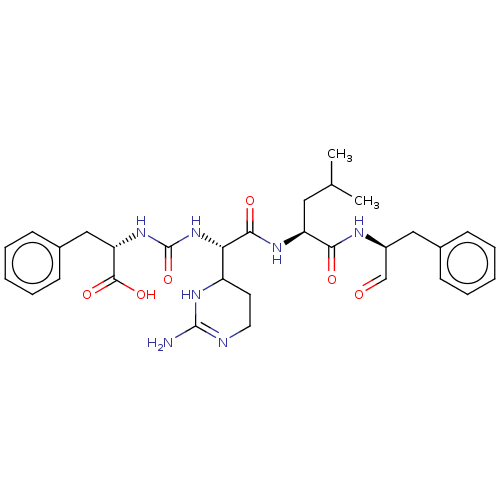
Affinity DataKi: 2.60E+3nMAssay Description:The change in optical density per minute (OD/min) was obtained by incorporating various concentrations of compounds over a range of substrate (SPpNA)...More data for this Ligand-Target Pair
Affinity DataKi: 4.70E+3nMAssay Description:The change in optical density per minute (OD/min) was obtained by incorporating various concentrations of compounds over a range of substrate (SPpNA)...More data for this Ligand-Target Pair

Affinity DataKi: 8.70E+3nMAssay Description:The change in optical density per minute (OD/min) was obtained by incorporating various concentrations of compounds over a range of substrate (SPpNA)...More data for this Ligand-Target Pair
Affinity DataKi: 9.10E+3nMAssay Description:The change in optical density per minute (OD/min) was obtained by incorporating various concentrations of compounds over a range of substrate (SPpNA)...More data for this Ligand-Target Pair
Affinity DataKi: 9.10E+3nMAssay Description:The change in optical density per minute (OD/min) was obtained by incorporating various concentrations of compounds over a range of substrate (SPpNA)...More data for this Ligand-Target Pair
Affinity DataKi: 9.80E+3nMAssay Description:The change in optical density per minute (OD/min) was obtained by incorporating various concentrations of compounds over a range of substrate (SPpNA)...More data for this Ligand-Target Pair
Affinity DataKi: 1.25E+4nMAssay Description:The change in optical density per minute (OD/min) was obtained by incorporating various concentrations of compounds over a range of substrate (SPpNA)...More data for this Ligand-Target Pair

Affinity DataKi: 1.26E+4nMAssay Description:The change in optical density per minute (OD/min) was obtained by incorporating various concentrations of compounds over a range of substrate (SPpNA)...More data for this Ligand-Target Pair
Affinity DataKi: 1.61E+4nMAssay Description:The change in optical density per minute (OD/min) was obtained by incorporating various concentrations of compounds over a range of substrate (SPpNA)...More data for this Ligand-Target Pair

Affinity DataKi: 1.64E+4nMAssay Description:The change in optical density per minute (OD/min) was obtained by incorporating various concentrations of compounds over a range of substrate (SPpNA)...More data for this Ligand-Target Pair
Affinity DataKi: 1.78E+4nMAssay Description:The change in optical density per minute (OD/min) was obtained by incorporating various concentrations of compounds over a range of substrate (SPpNA)...More data for this Ligand-Target Pair
Affinity DataKi: 2.24E+4nMAssay Description:The change in optical density per minute (OD/min) was obtained by incorporating various concentrations of compounds over a range of substrate (SPpNA)...More data for this Ligand-Target Pair
Affinity DataKi: 2.26E+4nMAssay Description:The change in optical density per minute (OD/min) was obtained by incorporating various concentrations of compounds over a range of substrate (SPpNA)...More data for this Ligand-Target Pair

Affinity DataKi: 2.77E+4nMAssay Description:The change in optical density per minute (OD/min) was obtained by incorporating various concentrations of compounds over a range of substrate (SPpNA)...More data for this Ligand-Target Pair
Affinity DataKi: 3.01E+4nMAssay Description:The change in optical density per minute (OD/min) was obtained by incorporating various concentrations of compounds over a range of substrate (SPpNA)...More data for this Ligand-Target Pair

Affinity DataKi: 9.41E+4nMAssay Description:The change in optical density per minute (OD/min) was obtained by incorporating various concentrations of compounds over a range of substrate (SPpNA)...More data for this Ligand-Target Pair

Affinity DataKi: 1.62E+5nMAssay Description:The change in optical density per minute (OD/min) was obtained by incorporating various concentrations of compounds over a range of substrate (SPpNA)...More data for this Ligand-Target Pair
Affinity DataKi: 3.03E+5nMAssay Description:The change in optical density per minute (OD/min) was obtained by incorporating various concentrations of compounds over a range of substrate (SPpNA)...More data for this Ligand-Target Pair

Affinity DataKi: 3.41E+5nMAssay Description:The change in optical density per minute (OD/min) was obtained by incorporating various concentrations of compounds over a range of substrate (SPpNA)...More data for this Ligand-Target Pair
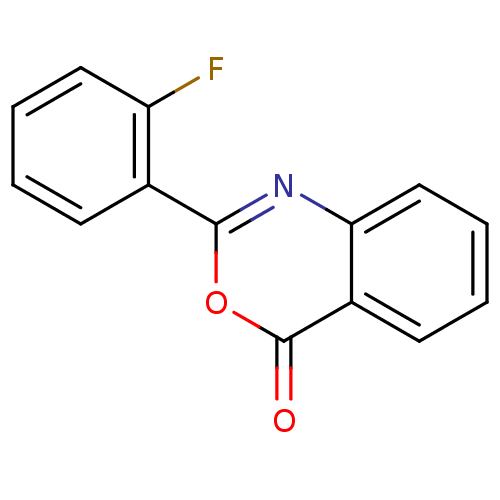
Affinity DataIC50: 5.80E+3nMpH: 7.6Assay Description:The α-chymotrypsin inhibition activity was evaluated in 50 mM Tris-HCl buffer pH 7.6 with 10 mM CaCl2. α-Chymotrypsin (bovine pancreas) at ...More data for this Ligand-Target Pair
Affinity DataIC50: 6.50E+3nMpH: 7.6Assay Description:The α-chymotrypsin inhibition activity was evaluated in 50 mM Tris-HCl buffer pH 7.6 with 10 mM CaCl2. α-Chymotrypsin (bovine pancreas) at ...More data for this Ligand-Target Pair
Affinity DataIC50: 9.90E+3nMpH: 7.6Assay Description:The α-chymotrypsin inhibition activity was evaluated in 50 mM Tris-HCl buffer pH 7.6 with 10 mM CaCl2. α-Chymotrypsin (bovine pancreas) at ...More data for this Ligand-Target Pair
Affinity DataIC50: 1.17E+4nMpH: 7.6Assay Description:The α-chymotrypsin inhibition activity was evaluated in 50 mM Tris-HCl buffer pH 7.6 with 10 mM CaCl2. α-Chymotrypsin (bovine pancreas) at ...More data for this Ligand-Target Pair
Affinity DataIC50: 1.21E+4nMpH: 7.6Assay Description:The α-chymotrypsin inhibition activity was evaluated in 50 mM Tris-HCl buffer pH 7.6 with 10 mM CaCl2. α-Chymotrypsin (bovine pancreas) at ...More data for this Ligand-Target Pair
Affinity DataIC50: 1.44E+4nMpH: 7.6Assay Description:The α-chymotrypsin inhibition activity was evaluated in 50 mM Tris-HCl buffer pH 7.6 with 10 mM CaCl2. α-Chymotrypsin (bovine pancreas) at ...More data for this Ligand-Target Pair
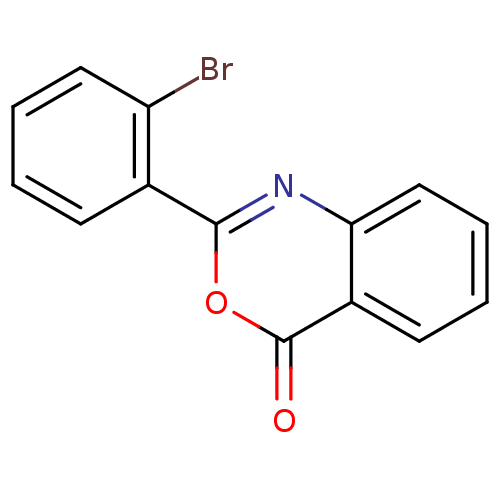
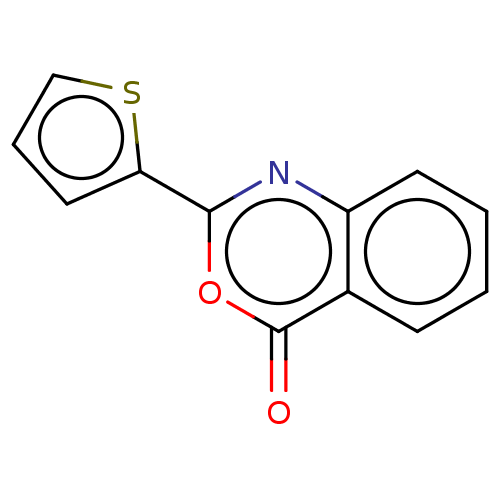
Affinity DataIC50: 1.51E+4nMAssay Description:Inhibition of jack bean ureaseMore data for this Ligand-Target Pair
Affinity DataIC50: 1.88E+4nMpH: 7.6Assay Description:The α-chymotrypsin inhibition activity was evaluated in 50 mM Tris-HCl buffer pH 7.6 with 10 mM CaCl2. α-Chymotrypsin (bovine pancreas) at ...More data for this Ligand-Target Pair
Affinity DataIC50: 2.01E+4nMpH: 7.6Assay Description:The α-chymotrypsin inhibition activity was evaluated in 50 mM Tris-HCl buffer pH 7.6 with 10 mM CaCl2. α-Chymotrypsin (bovine pancreas) at ...More data for this Ligand-Target Pair
Affinity DataIC50: 2.35E+4nMpH: 7.6Assay Description:The α-chymotrypsin inhibition activity was evaluated in 50 mM Tris-HCl buffer pH 7.6 with 10 mM CaCl2. α-Chymotrypsin (bovine pancreas) at ...More data for this Ligand-Target Pair
Affinity DataIC50: 2.38E+4nMpH: 7.6Assay Description:The α-chymotrypsin inhibition activity was evaluated in 50 mM Tris-HCl buffer pH 7.6 with 10 mM CaCl2. α-Chymotrypsin (bovine pancreas) at ...More data for this Ligand-Target Pair
Affinity DataIC50: 2.39E+4nMpH: 7.6Assay Description:The α-chymotrypsin inhibition activity was evaluated in 50 mM Tris-HCl buffer pH 7.6 with 10 mM CaCl2. α-Chymotrypsin (bovine pancreas) at ...More data for this Ligand-Target Pair
Affinity DataIC50: 2.63E+4nMpH: 7.6Assay Description:The α-chymotrypsin inhibition activity was evaluated in 50 mM Tris-HCl buffer pH 7.6 with 10 mM CaCl2. α-Chymotrypsin (bovine pancreas) at ...More data for this Ligand-Target Pair
Affinity DataIC50: 2.82E+4nMpH: 7.6Assay Description:The α-chymotrypsin inhibition activity was evaluated in 50 mM Tris-HCl buffer pH 7.6 with 10 mM CaCl2. α-Chymotrypsin (bovine pancreas) at ...More data for this Ligand-Target Pair
Affinity DataIC50: 2.88E+4nMpH: 7.6Assay Description:The α-chymotrypsin inhibition activity was evaluated in 50 mM Tris-HCl buffer pH 7.6 with 10 mM CaCl2. α-Chymotrypsin (bovine pancreas) at ...More data for this Ligand-Target Pair

Affinity DataIC50: 3.55E+4nMAssay Description:Inhibition of jack bean ureaseMore data for this Ligand-Target Pair
Affinity DataIC50: 4.18E+4nMpH: 7.6Assay Description:The α-chymotrypsin inhibition activity was evaluated in 50 mM Tris-HCl buffer pH 7.6 with 10 mM CaCl2. α-Chymotrypsin (bovine pancreas) at ...More data for this Ligand-Target Pair
Affinity DataIC50: 4.37E+4nMAssay Description:Inhibition of jack bean ureaseMore data for this Ligand-Target Pair
Affinity DataIC50: 4.68E+4nMAssay Description:Inhibition of jack bean ureaseMore data for this Ligand-Target Pair

Affinity DataIC50: 5.25E+4nMAssay Description:Inhibition of jack bean ureaseMore data for this Ligand-Target Pair
Affinity DataIC50: 5.62E+4nMAssay Description:Inhibition of jack bean ureaseMore data for this Ligand-Target Pair
Affinity DataIC50: 5.89E+4nMAssay Description:Inhibition of jack bean ureaseMore data for this Ligand-Target Pair
Affinity DataIC50: 6.03E+4nMAssay Description:Inhibition of jack bean ureaseMore data for this Ligand-Target Pair
Affinity DataIC50: 6.03E+4nMAssay Description:Inhibition of jack bean ureaseMore data for this Ligand-Target Pair
Affinity DataIC50: 6.17E+4nMAssay Description:Inhibition of jack bean ureaseMore data for this Ligand-Target Pair
Affinity DataIC50: 6.31E+4nMAssay Description:Inhibition of jack bean ureaseMore data for this Ligand-Target Pair
Affinity DataIC50: 6.46E+4nMAssay Description:Inhibition of jack bean ureaseMore data for this Ligand-Target Pair

Affinity DataIC50: 6.76E+4nMAssay Description:Inhibition of jack bean ureaseMore data for this Ligand-Target Pair
Affinity DataIC50: 6.76E+4nMAssay Description:Inhibition of jack bean ureaseMore data for this Ligand-Target Pair

Affinity DataIC50: 7.08E+4nMAssay Description:Inhibition of jack bean ureaseMore data for this Ligand-Target Pair

Affinity DataIC50: 7.24E+4nMAssay Description:Inhibition of jack bean ureaseMore data for this Ligand-Target Pair