 Found 20 Enz. Inhib. hit(s) with all data for entry = 2203
Affinity DataKi: 11.5nM ΔG°: -45.3kJ/molepH: 7.5 T: 2°CAssay Description:The oxidation of NADPH was monitored at 340 nm using a Molecular Devices SpectraMax Plus 96-well microtiter plate reading spectrophotometer. Plots we...More data for this Ligand-Target Pair
 3D Structure (crystal)
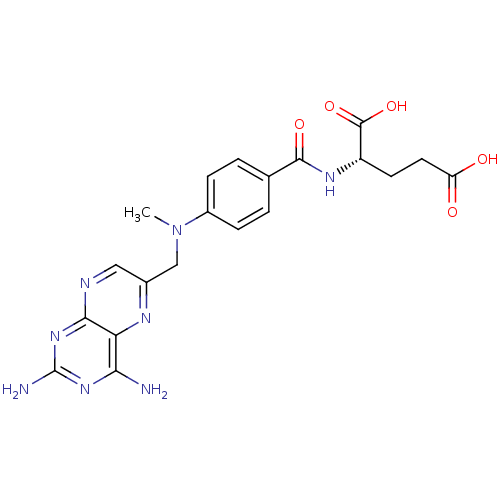
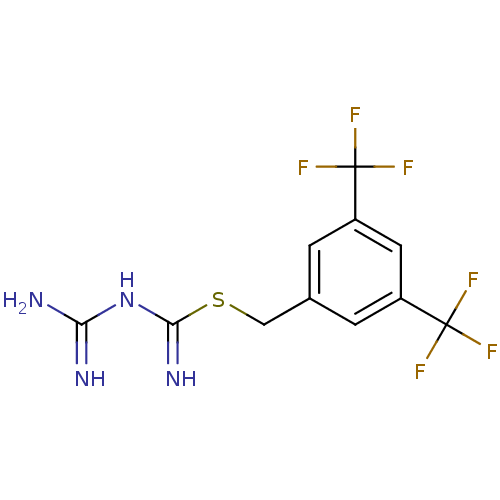
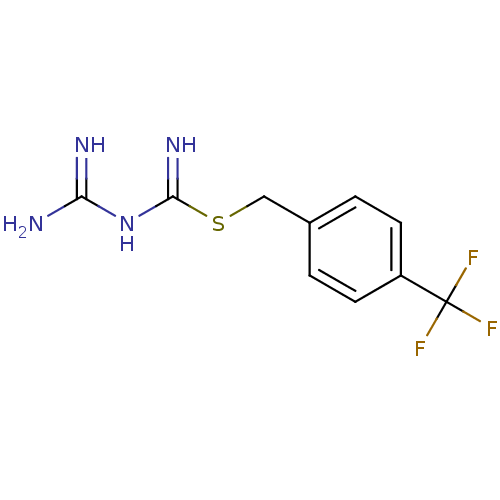
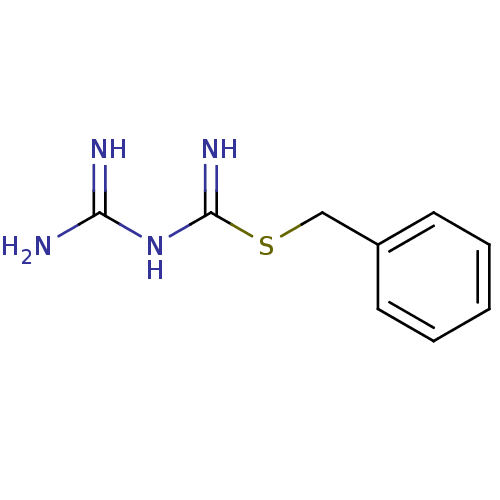
Affinity DataIC50: 3nMpH: 7.0 T: 2°CAssay Description:The DHFR inhibition observed with each derivative was characterized by determination and comparison of the IC50 values. IC50 determinations were perf...More data for this Ligand-Target Pair
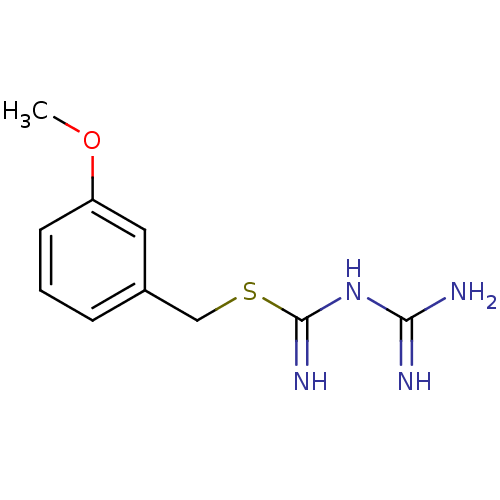
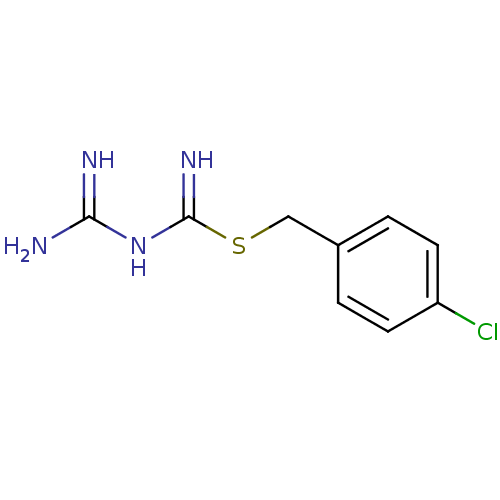
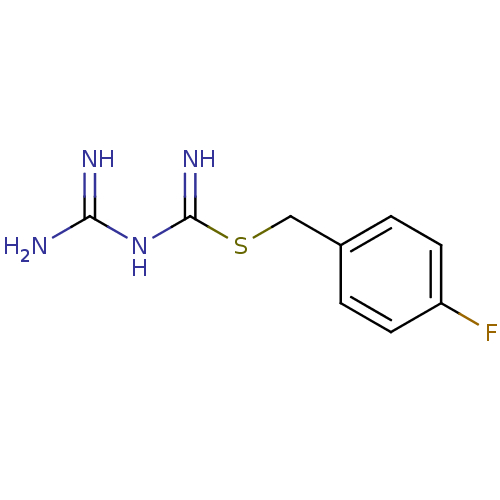
Affinity DataIC50: 75nMpH: 7.0 T: 2°CAssay Description:The DHFR inhibition observed with each derivative was characterized by determination and comparison of the IC50 values. IC50 determinations were perf...More data for this Ligand-Target Pair
Affinity DataIC50: 75nMpH: 7.0 T: 2°CAssay Description:The DHFR inhibition observed with each derivative was characterized by determination and comparison of the IC50 values. IC50 determinations were perf...More data for this Ligand-Target Pair
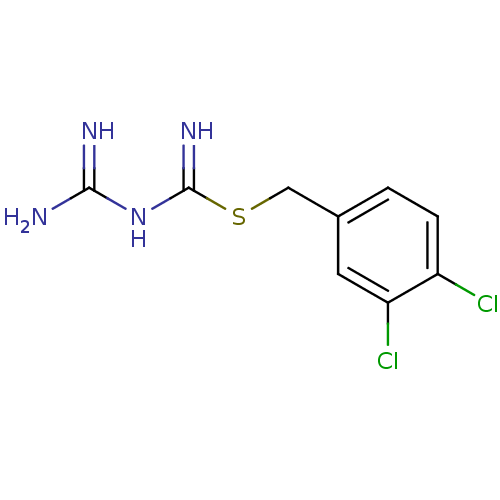
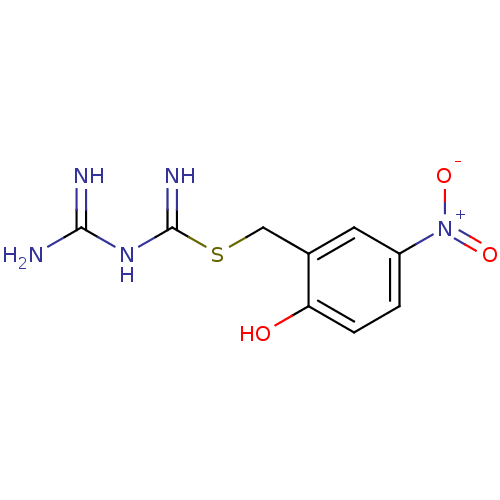
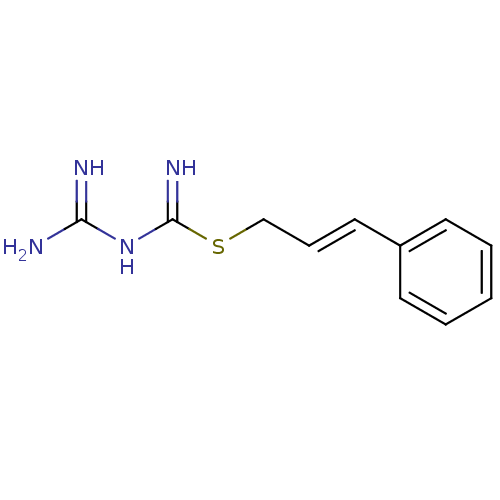
Affinity DataIC50: 3.30E+3nMpH: 7.0 T: 2°CAssay Description:The DHFR inhibition observed with each derivative was characterized by determination and comparison of the IC50 values. IC50 determinations were perf...More data for this Ligand-Target Pair
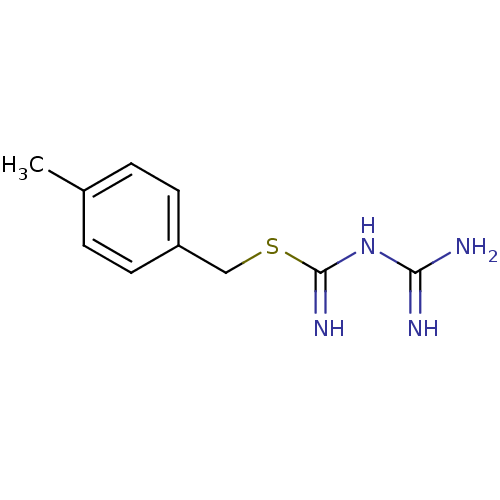
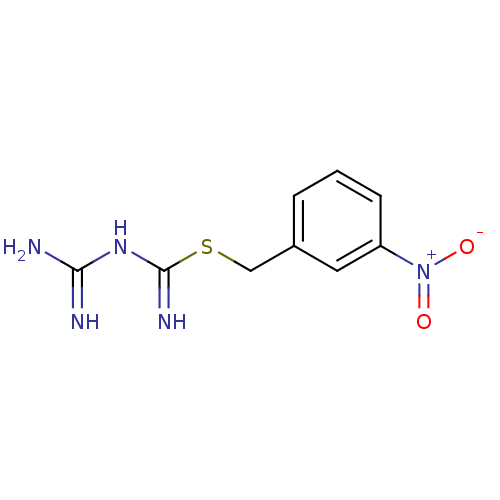
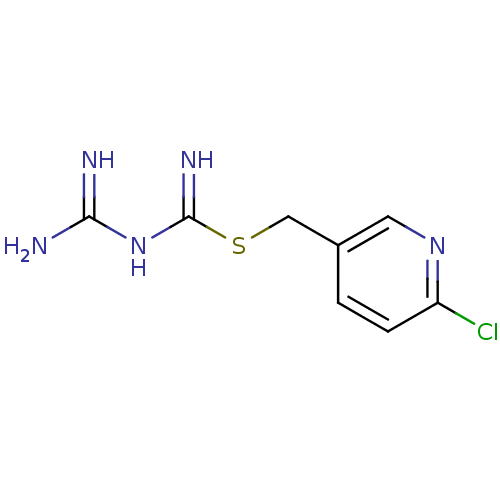
Affinity DataIC50: 3.70E+3nMpH: 7.0 T: 2°CAssay Description:The DHFR inhibition observed with each derivative was characterized by determination and comparison of the IC50 values. IC50 determinations were perf...More data for this Ligand-Target Pair
Affinity DataIC50: 3.80E+3nMpH: 7.0 T: 2°CAssay Description:The DHFR inhibition observed with each derivative was characterized by determination and comparison of the IC50 values. IC50 determinations were perf...More data for this Ligand-Target Pair

Affinity DataIC50: 4.30E+3nMpH: 7.0 T: 2°CAssay Description:The DHFR inhibition observed with each derivative was characterized by determination and comparison of the IC50 values. IC50 determinations were perf...More data for this Ligand-Target Pair
Affinity DataIC50: 5.60E+3nMpH: 7.0 T: 2°CAssay Description:The DHFR inhibition observed with each derivative was characterized by determination and comparison of the IC50 values. IC50 determinations were perf...More data for this Ligand-Target Pair
Affinity DataIC50: 1.26E+4nMpH: 7.0 T: 2°CAssay Description:The DHFR inhibition observed with each derivative was characterized by determination and comparison of the IC50 values. IC50 determinations were perf...More data for this Ligand-Target Pair
Affinity DataIC50: 1.30E+4nMpH: 7.0 T: 2°CAssay Description:The DHFR inhibition observed with each derivative was characterized by determination and comparison of the IC50 values. IC50 determinations were perf...More data for this Ligand-Target Pair
Affinity DataIC50: 1.42E+4nMpH: 7.0 T: 2°CAssay Description:The DHFR inhibition observed with each derivative was characterized by determination and comparison of the IC50 values. IC50 determinations were perf...More data for this Ligand-Target Pair
Affinity DataIC50: 1.51E+4nMpH: 7.0 T: 2°CAssay Description:The DHFR inhibition observed with each derivative was characterized by determination and comparison of the IC50 values. IC50 determinations were perf...More data for this Ligand-Target Pair
Affinity DataIC50: 1.89E+4nMpH: 7.0 T: 2°CAssay Description:The DHFR inhibition observed with each derivative was characterized by determination and comparison of the IC50 values. IC50 determinations were perf...More data for this Ligand-Target Pair
Affinity DataIC50: 1.98E+4nMpH: 7.0 T: 2°CAssay Description:The DHFR inhibition observed with each derivative was characterized by determination and comparison of the IC50 values. IC50 determinations were perf...More data for this Ligand-Target Pair
Affinity DataIC50: 2.49E+4nMpH: 7.0 T: 2°CAssay Description:The DHFR inhibition observed with each derivative was characterized by determination and comparison of the IC50 values. IC50 determinations were perf...More data for this Ligand-Target Pair
Affinity DataIC50: 3.46E+4nMpH: 7.0 T: 2°CAssay Description:The DHFR inhibition observed with each derivative was characterized by determination and comparison of the IC50 values. IC50 determinations were perf...More data for this Ligand-Target Pair
Affinity DataIC50: 3.47E+4nMpH: 7.0 T: 2°CAssay Description:The DHFR inhibition observed with each derivative was characterized by determination and comparison of the IC50 values. IC50 determinations were perf...More data for this Ligand-Target Pair
Affinity DataIC50: 3.51E+4nMpH: 7.0 T: 2°CAssay Description:The DHFR inhibition observed with each derivative was characterized by determination and comparison of the IC50 values. IC50 determinations were perf...More data for this Ligand-Target Pair
Affinity DataIC50: 4.06E+4nMpH: 7.0 T: 2°CAssay Description:The DHFR inhibition observed with each derivative was characterized by determination and comparison of the IC50 values. IC50 determinations were perf...More data for this Ligand-Target Pair