 Found 97 Enz. Inhib. hit(s) with all data for entry = 2506
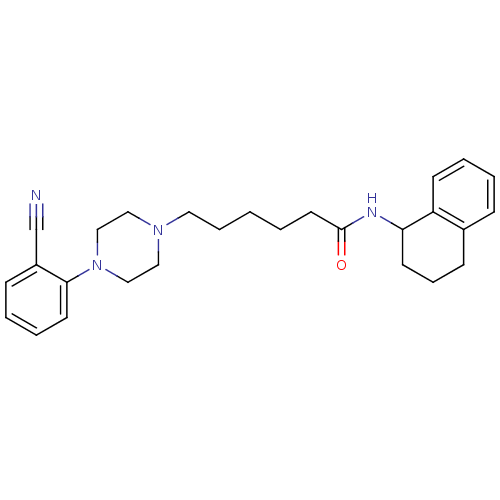
Affinity DataKi: 0.130nM ΔG°: -58.7kJ/molepH: 7.4 T: 2°CAssay Description:IC50 values for each test compound were determined from nonlinear regression analysis of data collected from ligand binding experiments. The inhibiti...More data for this Ligand-Target Pair
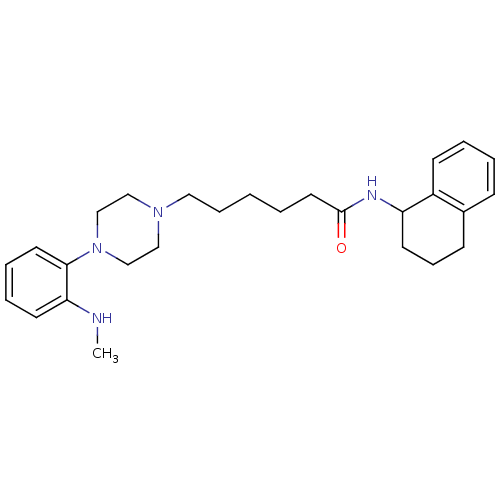
Affinity DataKi: 0.220nM ΔG°: -57.3kJ/molepH: 7.4 T: 2°CAssay Description:IC50 values for each test compound were determined from nonlinear regression analysis of data collected from ligand binding experiments. The inhibiti...More data for this Ligand-Target Pair
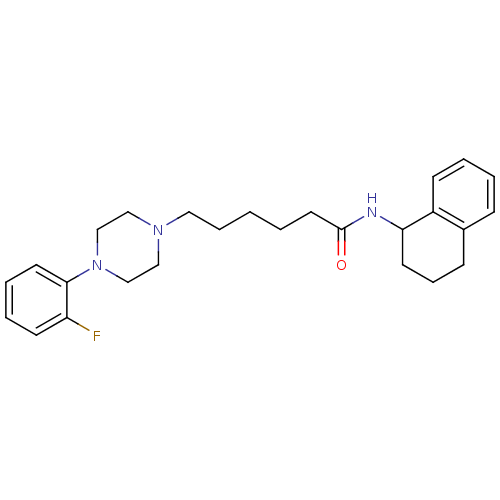
Affinity DataKi: 0.5nM ΔG°: -55.2kJ/molepH: 7.4 T: 2°CAssay Description:IC50 values for each test compound were determined from nonlinear regression analysis of data collected from ligand binding experiments. The inhibiti...More data for this Ligand-Target Pair
 3D Structure (crystal)
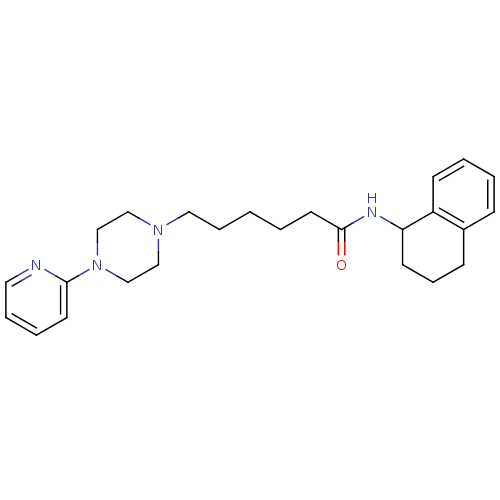
Affinity DataKi: 0.900nM ΔG°: -53.7kJ/molepH: 7.4 T: 2°CAssay Description:IC50 values for each test compound were determined from nonlinear regression analysis of data collected from ligand binding experiments. The inhibiti...More data for this Ligand-Target Pair
Affinity DataKi: 1.10nM ΔG°: -53.2kJ/molepH: 7.4 T: 2°CAssay Description:IC50 values for each test compound were determined from nonlinear regression analysis of data collected from ligand binding experiments. The inhibiti...More data for this Ligand-Target Pair
Affinity DataKi: 2nMAssay Description:IC50 values for each test compound were determined from nonlinear regression analysis of data collected from ligand binding experiments. The inhibiti...More data for this Ligand-Target Pair
Affinity DataKi: 2.10nMAssay Description:IC50 values for each test compound were determined from nonlinear regression analysis of data collected from ligand binding experiments. The inhibiti...More data for this Ligand-Target Pair
Affinity DataKi: 3.5nMAssay Description:IC50 values for each test compound were determined from nonlinear regression analysis of data collected from ligand binding experiments. The inhibiti...More data for this Ligand-Target Pair
Affinity DataKi: 3.85nMAssay Description:IC50 values for each test compound were determined from nonlinear regression analysis of data collected from ligand binding experiments. The inhibiti...More data for this Ligand-Target Pair
Affinity DataKi: 4.14nM ΔG°: -49.8kJ/molepH: 7.4 T: 2°CAssay Description:IC50 values for each test compound were determined from nonlinear regression analysis of data collected from ligand binding experiments. The inhibiti...More data for this Ligand-Target Pair
Affinity DataKi: 6.64nM ΔG°: -48.6kJ/molepH: 7.4 T: 2°CAssay Description:IC50 values for each test compound were determined from nonlinear regression analysis of data collected from ligand binding experiments. The inhibiti...More data for this Ligand-Target Pair
Affinity DataKi: 7.10nM ΔG°: -48.4kJ/molepH: 7.4 T: 2°CAssay Description:IC50 values for each test compound were determined from nonlinear regression analysis of data collected from ligand binding experiments. The inhibiti...More data for this Ligand-Target Pair
Affinity DataKi: 7.30nMAssay Description:IC50 values for each test compound were determined from nonlinear regression analysis of data collected from ligand binding experiments. The inhibiti...More data for this Ligand-Target Pair
Affinity DataKi: 8.60nMAssay Description:IC50 values for each test compound were determined from nonlinear regression analysis of data collected from ligand binding experiments. The inhibiti...More data for this Ligand-Target Pair
Affinity DataKi: 11.4nM ΔG°: -47.2kJ/molepH: 7.4 T: 2°CAssay Description:IC50 values for each test compound were determined from nonlinear regression analysis of data collected from ligand binding experiments. The inhibiti...More data for this Ligand-Target Pair
Affinity DataKi: 15nMAssay Description:IC50 values for each test compound were determined from nonlinear regression analysis of data collected from ligand binding experiments. The inhibiti...More data for this Ligand-Target Pair
Affinity DataKi: 15.2nM ΔG°: -46.4kJ/molepH: 7.4 T: 2°CAssay Description:IC50 values for each test compound were determined from nonlinear regression analysis of data collected from ligand binding experiments. The inhibiti...More data for this Ligand-Target Pair
Affinity DataKi: 16.6nMAssay Description:IC50 values for each test compound were determined from nonlinear regression analysis of data collected from ligand binding experiments. The inhibiti...More data for this Ligand-Target Pair
Affinity DataKi: 24nMAssay Description:IC50 values for each test compound were determined from nonlinear regression analysis of data collected from ligand binding experiments. The inhibiti...More data for this Ligand-Target Pair
Affinity DataKi: 25.4nM ΔG°: -45.1kJ/molepH: 7.4 T: 2°CAssay Description:IC50 values for each test compound were determined from nonlinear regression analysis of data collected from ligand binding experiments. The inhibiti...More data for this Ligand-Target Pair
Affinity DataKi: 26.4nMAssay Description:IC50 values for each test compound were determined from nonlinear regression analysis of data collected from ligand binding experiments. The inhibiti...More data for this Ligand-Target Pair
Affinity DataKi: 29.2nMAssay Description:IC50 values for each test compound were determined from nonlinear regression analysis of data collected from ligand binding experiments. The inhibiti...More data for this Ligand-Target Pair
Affinity DataKi: 32nMAssay Description:IC50 values for each test compound were determined from nonlinear regression analysis of data collected from ligand binding experiments. The inhibiti...More data for this Ligand-Target Pair
Affinity DataKi: 36.4nMAssay Description:IC50 values for each test compound were determined from nonlinear regression analysis of data collected from ligand binding experiments. The inhibiti...More data for this Ligand-Target Pair
Affinity DataKi: 40.1nM ΔG°: -43.9kJ/molepH: 7.4 T: 2°CAssay Description:IC50 values for each test compound were determined from nonlinear regression analysis of data collected from ligand binding experiments. The inhibiti...More data for this Ligand-Target Pair
Affinity DataKi: 48.7nM ΔG°: -43.4kJ/molepH: 7.4 T: 2°CAssay Description:IC50 values for each test compound were determined from nonlinear regression analysis of data collected from ligand binding experiments. The inhibiti...More data for this Ligand-Target Pair
Affinity DataKi: 49.6nM ΔG°: -43.4kJ/molepH: 7.4 T: 2°CAssay Description:IC50 values for each test compound were determined from nonlinear regression analysis of data collected from ligand binding experiments. The inhibiti...More data for this Ligand-Target Pair
Affinity DataKi: 51nMAssay Description:IC50 values for each test compound were determined from nonlinear regression analysis of data collected from ligand binding experiments. The inhibiti...More data for this Ligand-Target Pair
Affinity DataKi: 52.7nMAssay Description:IC50 values for each test compound were determined from nonlinear regression analysis of data collected from ligand binding experiments. The inhibiti...More data for this Ligand-Target Pair
Affinity DataKi: 60nMAssay Description:IC50 values for each test compound were determined from nonlinear regression analysis of data collected from ligand binding experiments. The inhibiti...More data for this Ligand-Target Pair
Affinity DataKi: 60nMAssay Description:IC50 values for each test compound were determined from nonlinear regression analysis of data collected from ligand binding experiments. The inhibiti...More data for this Ligand-Target Pair
Affinity DataKi: 60.9nMAssay Description:IC50 values for each test compound were determined from nonlinear regression analysis of data collected from ligand binding experiments. The inhibiti...More data for this Ligand-Target Pair
Affinity DataKi: 63.3nM ΔG°: -42.7kJ/molepH: 7.4 T: 2°CAssay Description:IC50 values for each test compound were determined from nonlinear regression analysis of data collected from ligand binding experiments. The inhibiti...More data for this Ligand-Target Pair
Affinity DataKi: 65.6nM ΔG°: -42.6kJ/molepH: 7.4 T: 2°CAssay Description:IC50 values for each test compound were determined from nonlinear regression analysis of data collected from ligand binding experiments. The inhibiti...More data for this Ligand-Target Pair
Affinity DataKi: 68nMAssay Description:IC50 values for each test compound were determined from nonlinear regression analysis of data collected from ligand binding experiments. The inhibiti...More data for this Ligand-Target Pair
Affinity DataKi: 77.8nMAssay Description:IC50 values for each test compound were determined from nonlinear regression analysis of data collected from ligand binding experiments. The inhibiti...More data for this Ligand-Target Pair
Affinity DataKi: 79.2nMAssay Description:IC50 values for each test compound were determined from nonlinear regression analysis of data collected from ligand binding experiments. The inhibiti...More data for this Ligand-Target Pair
Affinity DataKi: 96nMAssay Description:IC50 values for each test compound were determined from nonlinear regression analysis of data collected from ligand binding experiments. The inhibiti...More data for this Ligand-Target Pair
Affinity DataKi: 107nMAssay Description:IC50 values for each test compound were determined from nonlinear regression analysis of data collected from ligand binding experiments. The inhibiti...More data for this Ligand-Target Pair
Affinity DataKi: 112nMAssay Description:IC50 values for each test compound were determined from nonlinear regression analysis of data collected from ligand binding experiments. The inhibiti...More data for this Ligand-Target Pair
Affinity DataKi: 123nMAssay Description:IC50 values for each test compound were determined from nonlinear regression analysis of data collected from ligand binding experiments. The inhibiti...More data for this Ligand-Target Pair
Affinity DataKi: 128nMAssay Description:IC50 values for each test compound were determined from nonlinear regression analysis of data collected from ligand binding experiments. The inhibiti...More data for this Ligand-Target Pair
Affinity DataKi: 131nM ΔG°: -40.9kJ/molepH: 7.4 T: 2°CAssay Description:IC50 values for each test compound were determined from nonlinear regression analysis of data collected from ligand binding experiments. The inhibiti...More data for this Ligand-Target Pair
Affinity DataKi: 133nMAssay Description:IC50 values for each test compound were determined from nonlinear regression analysis of data collected from ligand binding experiments. The inhibiti...More data for this Ligand-Target Pair
Affinity DataKi: 143nMAssay Description:IC50 values for each test compound were determined from nonlinear regression analysis of data collected from ligand binding experiments. The inhibiti...More data for this Ligand-Target Pair
Affinity DataKi: 167nMAssay Description:IC50 values for each test compound were determined from nonlinear regression analysis of data collected from ligand binding experiments. The inhibiti...More data for this Ligand-Target Pair
Affinity DataKi: 168nMAssay Description:IC50 values for each test compound were determined from nonlinear regression analysis of data collected from ligand binding experiments. The inhibiti...More data for this Ligand-Target Pair
Affinity DataKi: 173nMAssay Description:IC50 values for each test compound were determined from nonlinear regression analysis of data collected from ligand binding experiments. The inhibiti...More data for this Ligand-Target Pair
Affinity DataKi: 183nMAssay Description:IC50 values for each test compound were determined from nonlinear regression analysis of data collected from ligand binding experiments. The inhibiti...More data for this Ligand-Target Pair

Affinity DataKi: 194nMAssay Description:IC50 values for each test compound were determined from nonlinear regression analysis of data collected from ligand binding experiments. The inhibiti...More data for this Ligand-Target Pair