 Found 448 with Last Name = 'ge' and Initial = 'x'
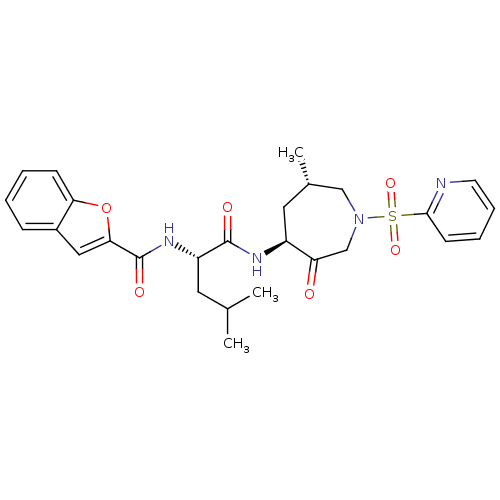
Affinity DataKi: 0.00990nM ΔG°: -62.2kJ/molepH: 5.5 T: 2°CAssay Description:Potential inhibitors were evaluated using the progress curve method. Assays were carried out in the presence of variable concentrations of test compo...More data for this Ligand-Target Pair
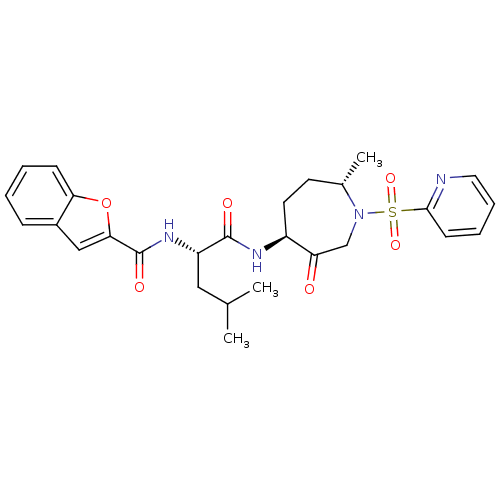
Affinity DataKi: 0.0400nM ΔG°: -58.8kJ/molepH: 5.5 T: 2°CAssay Description:Potential inhibitors were evaluated using the progress curve method. Assays were carried out in the presence of variable concentrations of test compo...More data for this Ligand-Target Pair

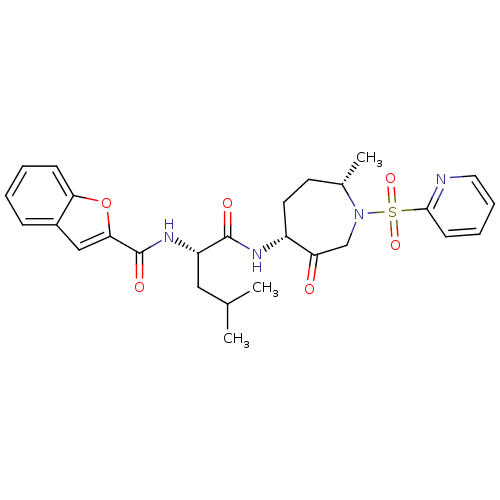
Affinity DataKi: 0.0410nM ΔG°: -58.7kJ/molepH: 5.5 T: 2°CAssay Description:Potential inhibitors were evaluated using the progress curve method. Assays were carried out in the presence of variable concentrations of test compo...More data for this Ligand-Target Pair
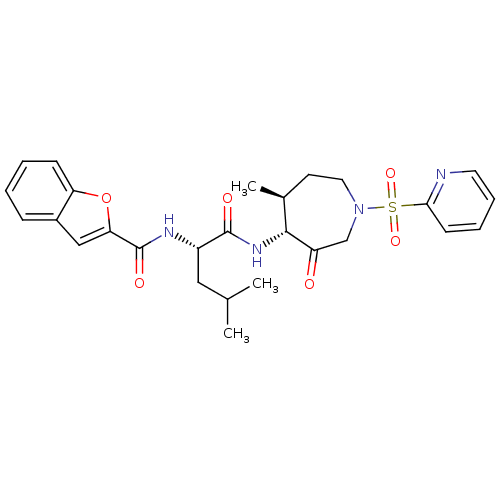
Affinity DataKi: 0.0630nMAssay Description:Potential inhibitors were evaluated using the progress curve method. Assays were carried out in the presence of variable concentrations of test compo...More data for this Ligand-Target Pair
Affinity DataKi: 0.0680nM ΔG°: -57.4kJ/molepH: 5.5 T: 2°CAssay Description:Potential inhibitors were evaluated using the progress curve method. Assays were carried out in the presence of variable concentrations of test compo...More data for this Ligand-Target Pair
Affinity DataKi: 0.140nM ΔG°: -55.7kJ/molepH: 5.5 T: 2°CAssay Description:Potential inhibitors were evaluated using the progress curve method. Assays were carried out in the presence of variable concentrations of test compo...More data for this Ligand-Target Pair

Affinity DataKi: 0.160nM ΔG°: -55.3kJ/molepH: 5.5 T: 2°CAssay Description:Potential inhibitors were evaluated using the progress curve method. Assays were carried out in the presence of variable concentrations of test compo...More data for this Ligand-Target Pair
 3D Structure (crystal)
Affinity DataKi: 0.630nM ΔG°: -52.0kJ/molepH: 5.5 T: 2°CAssay Description:Potential inhibitors were evaluated using the progress curve method. Assays were carried out in the presence of variable concentrations of test compo...More data for this Ligand-Target Pair

Affinity DataKi: 1.40nM ΔG°: -50.0kJ/molepH: 5.5 T: 2°CAssay Description:Potential inhibitors were evaluated using the progress curve method. Assays were carried out in the presence of variable concentrations of test compo...More data for this Ligand-Target Pair

Affinity DataKi: 1.5nM ΔG°: -49.9kJ/molepH: 5.5 T: 2°CAssay Description:Potential inhibitors were evaluated using the progress curve method. Assays were carried out in the presence of variable concentrations of test compo...More data for this Ligand-Target Pair
Affinity DataKi: 1.60nMAssay Description:Potential inhibitors were evaluated using the progress curve method. Assays were carried out in the presence of variable concentrations of test compo...More data for this Ligand-Target Pair
Affinity DataKi: 1.80nMAssay Description:Potential inhibitors were evaluated using the progress curve method. Assays were carried out in the presence of variable concentrations of test compo...More data for this Ligand-Target Pair
Affinity DataKi: 2.20nM ΔG°: -48.9kJ/molepH: 5.5 T: 2°CAssay Description:Potential inhibitors were evaluated using the progress curve method. Assays were carried out in the presence of variable concentrations of test compo...More data for this Ligand-Target Pair
Affinity DataKi: 2.5nM ΔG°: -48.6kJ/molepH: 5.5 T: 2°CAssay Description:Potential inhibitors were evaluated using the progress curve method. Assays were carried out in the presence of variable concentrations of test compo...More data for this Ligand-Target Pair
Affinity DataKi: 3.90nM ΔG°: -47.5kJ/molepH: 5.5 T: 2°CAssay Description:Potential inhibitors were evaluated using the progress curve method. Assays were carried out in the presence of variable concentrations of test compo...More data for this Ligand-Target Pair
Affinity DataKi: 4nMAssay Description:Potential inhibitors were evaluated using the progress curve method. Assays were carried out in the presence of variable concentrations of test compo...More data for this Ligand-Target Pair
Affinity DataKi: 4nM ΔG°: -47.5kJ/molepH: 5.5 T: 2°CAssay Description:Potential inhibitors were evaluated using the progress curve method. Assays were carried out in the presence of variable concentrations of test compo...More data for this Ligand-Target Pair
Affinity DataKi: 4.20nM ΔG°: -47.3kJ/molepH: 5.5 T: 2°CAssay Description:Potential inhibitors were evaluated using the progress curve method. Assays were carried out in the presence of variable concentrations of test compo...More data for this Ligand-Target Pair
Affinity DataKi: 4.5nM ΔG°: -47.2kJ/molepH: 5.5 T: 2°CAssay Description:Potential inhibitors were evaluated using the progress curve method. Assays were carried out in the presence of variable concentrations of test compo...More data for this Ligand-Target Pair

Affinity DataKi: 4.5nM ΔG°: -47.2kJ/molepH: 5.5 T: 2°CAssay Description:Potential inhibitors were evaluated using the progress curve method. Assays were carried out in the presence of variable concentrations of test compo...More data for this Ligand-Target Pair
Affinity DataKi: 5.80nMAssay Description:Potential inhibitors were evaluated using the progress curve method. Assays were carried out in the presence of variable concentrations of test compo...More data for this Ligand-Target Pair
Affinity DataKi: 7.90nM ΔG°: -45.8kJ/molepH: 5.5 T: 2°CAssay Description:Potential inhibitors were evaluated using the progress curve method. Assays were carried out in the presence of variable concentrations of test compo...More data for this Ligand-Target Pair
Affinity DataKi: 8nMAssay Description:Potential inhibitors were evaluated using the progress curve method. Assays were carried out in the presence of variable concentrations of test compo...More data for this Ligand-Target Pair
Affinity DataKi: 8.30nMAssay Description:Potential inhibitors were evaluated using the progress curve method. Assays were carried out in the presence of variable concentrations of test compo...More data for this Ligand-Target Pair
Affinity DataKi: 10nM ΔG°: -45.2kJ/molepH: 5.5 T: 2°CAssay Description:Potential inhibitors were evaluated using the progress curve method. Assays were carried out in the presence of variable concentrations of test compo...More data for this Ligand-Target Pair
Affinity DataKi: 13nMAssay Description:Potential inhibitors were evaluated using the progress curve method. Assays were carried out in the presence of variable concentrations of test compo...More data for this Ligand-Target Pair
Affinity DataKi: 19nM ΔG°: -43.6kJ/molepH: 5.5 T: 2°CAssay Description:Potential inhibitors were evaluated using the progress curve method. Assays were carried out in the presence of variable concentrations of test compo...More data for this Ligand-Target Pair

Affinity DataKi: 29nM ΔG°: -42.6kJ/molepH: 5.5 T: 2°CAssay Description:Potential inhibitors were evaluated using the progress curve method. Assays were carried out in the presence of variable concentrations of test compo...More data for this Ligand-Target Pair

Affinity DataKi: 30nM ΔG°: -42.5kJ/molepH: 5.5 T: 2°CAssay Description:Potential inhibitors were evaluated using the progress curve method. Assays were carried out in the presence of variable concentrations of test compo...More data for this Ligand-Target Pair
Affinity DataKi: 32nMAssay Description:Potential inhibitors were evaluated using the progress curve method. Assays were carried out in the presence of variable concentrations of test compo...More data for this Ligand-Target Pair
Affinity DataKi: 42nMAssay Description:Potential inhibitors were evaluated using the progress curve method. Assays were carried out in the presence of variable concentrations of test compo...More data for this Ligand-Target Pair

Affinity DataKi: 42nM ΔG°: -41.7kJ/molepH: 5.5 T: 2°CAssay Description:Potential inhibitors were evaluated using the progress curve method. Assays were carried out in the presence of variable concentrations of test compo...More data for this Ligand-Target Pair
Affinity DataKi: 43nMAssay Description:Inhibitory activity against CF40.NS3pro from Dengue virus type 2More data for this Ligand-Target Pair
Affinity DataKi: 45nM ΔG°: -41.5kJ/molepH: 5.5 T: 2°CAssay Description:Potential inhibitors were evaluated using the progress curve method. Assays were carried out in the presence of variable concentrations of test compo...More data for this Ligand-Target Pair
Affinity DataKi: 52nM ΔG°: -41.2kJ/molepH: 5.5 T: 2°CAssay Description:Potential inhibitors were evaluated using the progress curve method. Assays were carried out in the presence of variable concentrations of test compo...More data for this Ligand-Target Pair
Affinity DataKi: 60nMAssay Description:Potential inhibitors were evaluated using the progress curve method. Assays were carried out in the presence of variable concentrations of test compo...More data for this Ligand-Target Pair
Affinity DataKi: 73nMAssay Description:Potential inhibitors were evaluated using the progress curve method. Assays were carried out in the presence of variable concentrations of test compo...More data for this Ligand-Target Pair
Affinity DataKi: 92nMAssay Description:Potential inhibitors were evaluated using the progress curve method. Assays were carried out in the presence of variable concentrations of test compo...More data for this Ligand-Target Pair
Affinity DataKi: 110nMAssay Description:Potential inhibitors were evaluated using the progress curve method. Assays were carried out in the presence of variable concentrations of test compo...More data for this Ligand-Target Pair
Affinity DataKi: 150nM ΔG°: -38.6kJ/molepH: 5.5 T: 2°CAssay Description:Potential inhibitors were evaluated using the progress curve method. Assays were carried out in the presence of variable concentrations of test compo...More data for this Ligand-Target Pair
Affinity DataKi: 160nM ΔG°: -38.4kJ/molepH: 5.5 T: 2°CAssay Description:Potential inhibitors were evaluated using the progress curve method. Assays were carried out in the presence of variable concentrations of test compo...More data for this Ligand-Target Pair
Affinity DataKi: 300nMAssay Description:Potential inhibitors were evaluated using the progress curve method. Assays were carried out in the presence of variable concentrations of test compo...More data for this Ligand-Target Pair
Affinity DataKi: 350nMAssay Description:Potential inhibitors were evaluated using the progress curve method. Assays were carried out in the presence of variable concentrations of test compo...More data for this Ligand-Target Pair
Affinity DataKi: 430nMAssay Description:Potential inhibitors were evaluated using the progress curve method. Assays were carried out in the presence of variable concentrations of test compo...More data for this Ligand-Target Pair
Affinity DataKi: 500nMAssay Description:Potential inhibitors were evaluated using the progress curve method. Assays were carried out in the presence of variable concentrations of test compo...More data for this Ligand-Target Pair
Affinity DataKi: 660nMAssay Description:Potential inhibitors were evaluated using the progress curve method. Assays were carried out in the presence of variable concentrations of test compo...More data for this Ligand-Target Pair
Affinity DataKi: 680nMAssay Description:Potential inhibitors were evaluated using the progress curve method. Assays were carried out in the presence of variable concentrations of test compo...More data for this Ligand-Target Pair
Affinity DataKi: 790nMAssay Description:Potential inhibitors were evaluated using the progress curve method. Assays were carried out in the presence of variable concentrations of test compo...More data for this Ligand-Target Pair
Affinity DataKi: 850nMAssay Description:Inhibitory activity against CF40.NS3pro from Dengue virus type 2More data for this Ligand-Target Pair
Affinity DataKi: >1.00E+3nMAssay Description:Potential inhibitors were evaluated using the progress curve method. Assays were carried out in the presence of variable concentrations of test compo...More data for this Ligand-Target Pair