Query String: Gentian violet
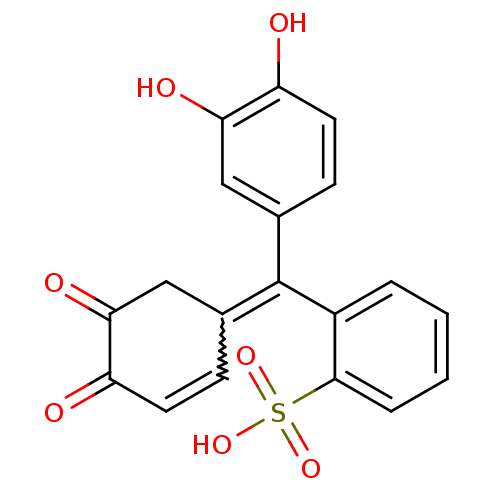 PYROCATECHOL VIOLET BDBM50427513
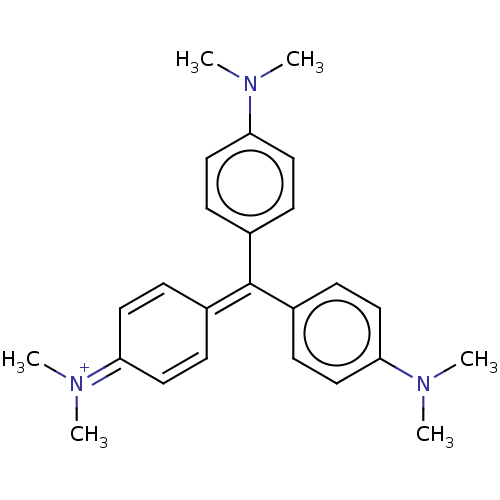 BDBM50052802 Hexamethyl pararosaniline CHEBI:77181 Crystal violet (15) CRYSTAL VIOLET
 BDBM50333185 CHEMBL1644886 Pontacyl Violet 6R
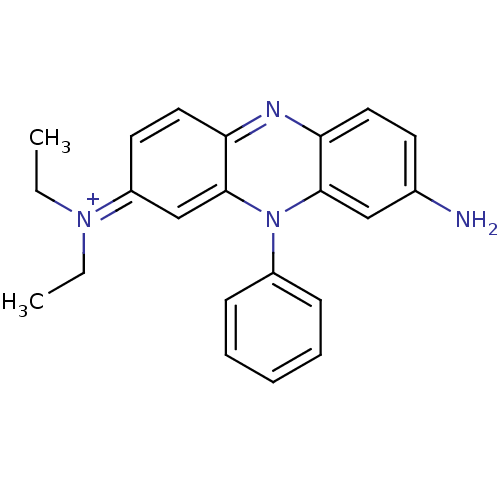 SMR001224409 BDBM76299 N2,N2-diethyl-10-phenylphenazin-10-ium-2,8-diamine;chloride cid_2733867 (8-amino-10-phenyl-phenazin-10-ium-2-yl)-diethyl-amine;chloride Methylene Violet 3RAX N2,N2-diethyl-10-phenyl-phenazin-10-ium-2,8-diamine;chloride 2-N,2-N-diethyl-10-phenylphenazin-10-ium-2,8-diamine;chloride MLS001359835
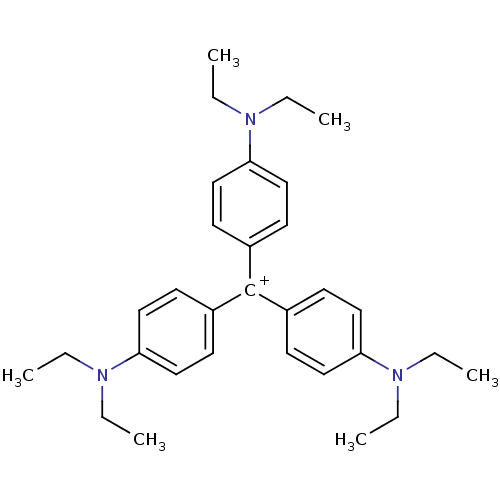 Ethyl Violet [4-[bis[4-(diethylamino)phenyl]methylidene]cyclohexa-2,5-dien-1-ylidene]-diethylazanium;chloride SMR001224407 cid_16955 [4-[bis[4-(diethylamino)phenyl]methylene]cyclohexa-2,5-dien-1-ylidene]-diethyl-ammonium;chloride BDBM81198 MLS001359914 [4-[bis[4-(diethylamino)phenyl]methylidene]-1-cyclohexa-2,5-dienylidene]-diethylammonium;chloride [4-[bis[4-(diethylamino)phenyl]methylidene]cyclohexa-2,5-dien-1-ylidene]-diethyl-azanium;chloride
- CPA assay cell proliferation arrest on HT1080 cells (CPA; crystal violet).
- ChEMBL_2105682 (CHEMBL4814357) Inhibition of IRE1 in human SUM159 cells incubated for 10 days by crystal violet staining based assay
- ChEMBL_1619334 (CHEMBL3861503) Inhibition of Escherichia coli UTI89 FimH-mediated biofilm formation after 48 hrs by crystal violet staining-based assay
- ChEMBL_1988445 (CHEMBL4621992) Inhibition of ENO1 in overexpressed human D423 cells incubated for 5 days by crystal violet staining based spectrophotometry
- ChEMBL_847917 (CHEMBL2150116) Inhibition of human dUTPase-mediated cell proliferation in HeLa S3 cells after 72 hrs by crystal violet staining
- ChEMBL_1361525 (CHEMBL3294849) Antimicrobial activity against Enterococcus faecalis assessed as inhibition of biofilm formation after 20 hrs by crystal violet staining analysis
- ChEMBL_1988446 (CHEMBL4621993) Inhibition of ENO1 in wild-type human LN319 cells incubated for 5 days by crystal violet staining based spectrophotometry
- ChEMBL_795372 (CHEMBL1937272) Inhibition of PRL-3-mediated cell migration in human DLD1 cells after 15 hrs by crystal violet staining based microscopic assay
- ChEMBL_624439 (CHEMBL1108767) Antagonist activity at CCR2 in human THP1 cells assessed as inhibition of MCP1-induced chemotaxis after 1 hr by crystal violet staining
- ChEMBL_795375 (CHEMBL1937275) Inhibition of PRL-3-mediated cell invasion in human DLD1 cells after 20 hrs using crystal violet staining by Matrigel invasion assay
- ChEMBL_1988448 (CHEMBL4621995) Inhibition of ENO1 in overexpressed human D423 cells incubated for 5 days in presence of 21 % oxygen by crystal violet staining based spectrophotometry
- ChEMBL_1988451 (CHEMBL4621998) Inhibition of ENO1 in overexpressed human D423 cells incubated for 5 days in presence of 1 % oxygen by crystal violet staining based spectrophotometry
- ChEMBL_2323795 Antibiofilm activity against Enterococcus faecalis ATCC19433 assessed as inhibition of biofilm formation incubated for 24 hrs by crystal violet staining based broth microdilution method
- ChEMBL_940752 (CHEMBL2330132) Antagonist activity at ERalpha receptor in human MCF7 cells assessed as inhibition of cell growth after 6 days by crystal violet staining method
- ChEMBL_1811034 (CHEMBL4310494) Inhibition of LSD1 in human THP1 cells assessed as induction of CD11b expression after 4 days by LIVE/DEAD violet staining based FACS analysis
- ChEMBL_1988449 (CHEMBL4621996) Inhibition of ENO1 in wild-type human LN319 cells incubated for 5 days in presence of 21 % oxygen by crystal violet staining based spectrophotometry
- ChEMBL_1988452 (CHEMBL4621999) Inhibition of ENO1 in wild-type human LN319 cells incubated for 5 days in presence of 1 % oxygen by crystal violet staining based spectrophotometry
- ChEMBL_1651852 (CHEMBL4001107) Inhibition of vitronectin binding to alphaVbeta3 in human EPC in presence of MnCl2 measured after 30 mins by crystal violet staining based cell adhesion assay
- ChEMBL_1698584 (CHEMBL4049566) Inhibition of alpha5 beta1 integrin (unknown origin)-mediated human K562 cell adhesion to GST-tagged fibronectin after 45 mins by crystal violet staining based spectrophotometric analysis
- ChEMBL_2048383 (CHEMBL4703082) Inhibition of alpha5beta1 integrin in human SW480 cells assessed as inhibition of cell adhesion to fibronectin incubated for 60 mins by crystal violet staining based analysis
- ChEMBL_1728981 (CHEMBL4144259) Inhibition of vitronectin binding to integrin alphaVbeta3 in HDF pretreated for 20 mins followed by vitronectin addition measured after 40 mins by crystal violet staining based assay
- ChEMBL_2048384 (CHEMBL4703083) Inhibition of alphavbeta1 integrin (unknown origin) expressed in CHO cells assessed as inhibition of cell adhesion to fibronectin incubated for 60 mins by crystal violet staining based analysis
- ChEMBL_859062 (CHEMBL2169087) Inhibition of dUTPase in human HeLa S3 cells assessed as potentiation of 1 uM FdUrd-induced decrease in cell density incubated for 48 hrs by crystal violet assay
- ChEMBL_2516993 Inhibition of IGF-IR in human MCF7 cells assessed as inhibition of anchorage-independent growth incubated for 30 mins and measured after 3 weeks by crystal violet staining based soft agar assay
- ChEMBL_1621498 (CHEMBL3863781) Inhibition of integrin alphaVbeta1 (unknown origin)-mediated CHO cell adhesion to fibronectin preincubated for 15 to 30 mins followed by 60 min incubation for adhesion by crystal violet staining based cell adhesion assay
- ChEMBL_1621499 (CHEMBL3863782) Inhibition of human integrin alphaVbeta3-mediated human SW480 cell adhesion to fibrinogen preincubated for 15 to 30 mins followed by 60 min incubation for adhesion by crystal violet staining based cell adhesion assay
- ChEMBL_1621502 (CHEMBL3863785) Inhibition of human integrin alpha5beta1-mediated human SW480 cell adhesion to fibronectin preincubated for 15 to 30 mins followed by 60 min incubation for adhesion by crystal violet staining based cell adhesion assay
- ChEMBL_2048385 (CHEMBL4703084) Inhibition of alphavbeta3 integrin (unknown origin) expressed in human SW480 cells transfected with human beta3 assessed as inhibition of cell adhesion to fibrinogen incubated for 60 mins by crystal violet staining based analysis
- ChEMBL_847916 (CHEMBL2150115) Inhibition of human dUTPase-mediated cell proliferation in HeLa S3 cells assessed as compound concentration required to reduce 50% of 1 uM of FdUrd T/C after 24 hrs by crystal violet staining
- ChEMBL_1996606 (CHEMBL4630501) Antagonist activity at ADRB2 endogenously expressed in HEK293 cells transfected with cAMP FRET biosensor assessed as inhibition of cimaterol-induced response pre-incubated for 45 mins under constant violet light conditions by FRET assay
- ChEMBL_2162899 (CHEMBL5047760) Inhibition of alphavbeta3 integrin receptor-mediated cell adhesion to vitronectin in human A549 cells preincubated for 30 mins followed by VN substrate addition and measured after 1 hr by crystal violet based staining method
- ChEMBL_2434475 Inhibition of MYC in chicken embryonic fibroblasts assessed as reduction in transformed cell foci with repeated addition of compounds every second day and measured after 1 to 3 weeks by crystal violet staining based analysis
- ChEMBL_1621500 (CHEMBL3863783) Inhibition of human wild type integrin alphaVbeta5-mediated human SW480 cell adhesion to vitronectin preincubated for 15 to 30 mins followed by 60 min incubation for adhesion by crystal violet staining based cell adhesion assay
- ChEMBL_1621501 (CHEMBL3863784) Inhibition of human integrin alphaVbeta8-mediated human SNB19 cell adhesion to recombinant human TGFbeta1 LAP preincubated for 15 to 30 mins followed by 60 min incubation for adhesion by crystal violet staining based cell adhesion assay
- ChEMBL_2162898 (CHEMBL5047759) Inhibition of alphavbeta3 integrin receptor-mediated cell adhesion to vitronectin in human WM 266-4 cells preincubated for 30 mins followed by VN substrate addition and measured after 1 hr by crystal violet based staining method
- Lactate Dehydrogenase Inhibition Assay An LDH enzymatic assay developed for high throughput format was used. The dehydrogenase reaction was run in the lactate to pyruvate direction and coupled with the ability of diaphorase to reduce p-iodonitrotetrazolium violet using the NADH generated in the conversion of lactate to pyruvate. The progression of the coupling reaction was monitored as the increase of absorbance at 492 nm. Positive hits were subjected to additional analysis to determine IC50 values.
- In-Vitro (Enzyme) Assay In-Vitro (Enzyme) Assay for Determination of the Efficacy of the Inhibitors of the Inhibition of TGF-Beta-Mediated EffectsAs an example, the ability of the inhibitors to eliminate TGF-beta-mediated growth inhibition is tested.Cells of the lung epithelial cell line Mv1Lu are sown in a defined cell density in a 96-well microtitre plate and cultivated overnight under standard conditions. Next day, the medium is replaced by medium which comprises 0.5% of FCS and 1 ng/ml of TGF-beta, and the test substances are added in defined concentrations, generally in the form of dilution series with 5-fold steps. The concentration of the solvent DMSO is constant at 0.5%. After a further two days, Crystal Violet staining of the cells is carried out. After extraction of the Crystal Violet from the fixed cells, the absorption is measured spectrophotometrically at 550 nm. It can be used as a quantitative measure of the adherent cells present and thus of the cell proliferation during the culture.
- Viral titer plaque assay Vero-E6 cells were seeded at 4 x 10E5 cells/well in 12-well plates and infected for 1 hour with the SARS-CoV-2 isolate USA-WA1/2020 at an MOI of 0.01. The cells were washed twice to remove residual unattached virus. Serial dilutions of each compound (0.1% DMSO in 2% FBS in DMEM media) were added to the cells and incubated at 37 °C (2 dpi). After 2 dpi, the supernatant containing virus was cleared from cell debris at 1000 rpm for 10 min and frozen until analysis via plaque assay. For the plaque assay, Vero-E6 cells were seeded at 7.5 x 10E5 cells/well in 6-well plates. The following day, the media was removed and replaced with 100 μL of 10-fold serial dilutions of previously frozen viral supernatant. Plates were incubated at 37°C for 1 hour with gentle rocking. Subsequently, overlay media (DMEM, 2% FBS, 0.6% Avicel RC-581) was added to each well. At 2 dpi for SARS-CoV-2 plates were fixed with 10% formaldehyde for 30 min, stained with crystal violet solution (0.5% crystal violet in 20% ethanol) for 30 min, and then rinsed with deionized water to visualize plaques.
- Inhibitory Assay The IC50 values for the tested compounds were determined as previously described [2, 3], with minor modifications. Briefly, in 96-well tissue culture plates, 2.4x10⁴ Vero-E6 cells were distributed in each well and incubated overnight at a humidified 37° C. incubator under 5% CO2 condition. The cell monolayers were then washed once with 1xPBS. An aliquot of the SARS-CoV-2 "NRC-03-nhCoV" virus [40] containing 100 TCID50 was incubated with serial diluted compounds and kept at 37° C. for 1 h. The Vero-E6 cells were treated with virus/compound mix and co-incubated at 37° C. in a total volume of 200 uL per well. Untreated cells infected with virus represented the virus control; however, cells that were not treated and not infected were the cell control. Following incubation at 37° C. in 5% CO2 incubator for 72 h, the cells were fixed with 100 uL of 10% paraformaldehyde for 20 min and stained with 0.5% crystal violet in distilled water for 15 min at RT. The crystal violet dye was then dissolved using 100 uL of absolute methanol per well and the optical density of the color was measured at 570 nm using the Anthos Zenyth 200 rt plate reader (Anthos Labtec Instruments, Heerhugowaard, the Netherlands). The IC50 of the compound refers to a concentration of the compound required to reduce the virus-induced cytopathic effect (CPE) by 50%, relative to the virus control.
- HIV-1 plaque reduction assay Preliminary experiments in the inhibition of HIV-1 replication by invention compounds were performed as follows. Drug assays were carried out as previously described by Larder et. al., Antimicrobial Agents & Chemotherapy, 34:436-441, 1990. HIV-1LA1 infected HT4-6C cells were exposed to drugs as indicated and incubated for 3 days at 37° C. The cells were fixed with crystal violet to visualize plaques. Antiviral activity was assessed as the percentage of control plaques (no drug) measured in drug treated samples. The EC50 is the micromolar concentration which reduces plaque number by 50%. The activity of adefovir was compared with AZT (zidovudine) and 1-O-hexadecylpropanediol-3-adefovir (HDP-ADV) in HIV-1 infected HT4-6C cells.
- Viral Plaque Reduction Assay African green monkey kidney BSC-1 cells were grown in Dulbecco's modified Eagle medium (DMEM) supplemented with 10% fetal bovine serum (FBS) (Gibco BRL Life Technologies, Gaithersburg, Md.) and 0.1% gentamicin antibiotic at 37° C. in a humidified 5% CO2 environment. Confluent BSC-1 cells were infected with vaccinia virus at an MOI of 0.005 in 48-well plate. The test compounds and control cidofovir were dissolved in DMSO and diluted with the medium. One hour post infection, 400 uL of the test compounds and control were added per well at concentrations ranging from 200 nM to 200 uM and incubated at 37° C. for 16 hours. A 5% solution of formaldehyde in PBS was used to fix the cells. After washing twice with PBS, the plate was stained with 0.2% crystal violet in 50% ethanol.
- Antiviral Assay To evaluate the anti-HSV activity of 1, 17 or Brequinar by plaque reduction assays (PRA), Vero cells were seeded in 24-well plates at a density of 70×103 cells. After 24 h, cells were treated with different concentrations of 17, 1 or Brequinar 1 h prior to infection, and then infected with HSV-1 or HSV-2 (50 PFU/well). Following virus adsorption (2 h at 37 C), cultures were maintained in medium-containing 0.8% methylcellulose (Sigma) plus compounds. At 48 h post infection (h.p.i.), cells were fixed and stained by using 20% ethanol and 1% crystal violet. Plaques were microscopically counted, and the mean plaque counts for each concentration expressed as a percentage of the mean plaque count for the control virus. The number of plaques was plotted as a function of drug concentration; concentration producing 50% reduction in plaque formation (EC 50) was determined as described by Terlizzi et al. (Antiviral Research 132, 154-164, 2016).
- Dose response biochemical screening assay for inhibitors of c-Jun N-Terminal Kinase 3 (JNK3) Source (MLSCN Center Name): The Scripps Research Institute Molecular Screening Center Affiliation: The Scripps Research Institute, TSRI Assay Provider: Scripps Florida Network: Molecular Library Screening Center Network (MLSCN) Grant Proposal Number ML00111 Grant Proposal PI: Philip LoGrasso External Assay ID: JNK3_INH_TR-FRET_1536_IC50 Name: Dose response biochemical screening assay for inhibitors of c-Jun N-Terminal Kinase 3 (JNK3) Description: The c-Jun N-Terminal Kinases (JNK) are members of the mitogen activated protein (MAP) kinase family of enzymes. Among the many substrates phosphorylated by JNKs is the N-terminal activation domain of the transcription factor c-Jun. So far, three genes have been found to encode for JNK kinases, namely JNK1, JNK2 and JNK3. Whereas JNK1 and JNK2 exhibit a ubiquitous human expression pattern, JNK3 expression appears to be largely restricted to the brain [1]. JNKs are activated by a variety of stimuli including cytokines, ultra violet light,
- Inhibition Assay of HCoV-229E Viruses HCoV-229E viral genome replication was examined by RT-PCR with specific primers against its open reading frame 1 (“ORF1”) and ORF nucleocapsid (“ORFN”). See Yang et al., Front. Pharmacol. 11, Article 606097 (2020). Fetus lung fibroblast MRC5 cells were inoculated with the HCoV-229E virus at a MOI of 1. The MRC5 cells thus infected were treated with one of Compounds 1-3. Untreated MRC5 cells were used as a control sample. RT-PCR analysis was performed. Compounds 1-3 each inhibited HCoV-229E viral genome replication and subgenomic viral RNA syntheses at a concentration between 10 nM and 300 nM. Cytopathic effects were studied and visualized after the infected cells were treated with one of Compounds 1-3. An end point assay by TCID50 was performed. Crystal violet was used to stain live cells to determine the EC50 of each compound.
- SARS-CoV-2 Plaque Assay 1 The assay was performed in triplicate in 24-well tissue culture plates. Vero E6 cells were seeded in Dulbecco's modified Eagle's medium ( DMEM ) with 10% Fetal Bovine Serum ( FBS , Biological Industries, Kibbutz, Israel) and antibiotics one day before infection. SARS-CoV-2 viruses were added to the cell monolayer and allowed to sit for 1 hour at 37 C. After viruses were removed, the cell monolayer was washed once with PBS before covering with media containing agarose or methylcellulose for 5-7 days. The cells were fixed with 3.7% formaldehyde overnight followed by removal of overlay media. They were then stained with crystal violet to count the plaque-forming units ( PFU ). The percentage of inhibition was calculated as [1−(VD/VC)] 100%, where VD and VC refer to the virus titer in the presence and absence of a test compound, respectively.
- SARS-CoV-2 Plaque Assay 2 The assay was performed in triplicate in 24-well tissue culture plates. Vero E6 cells were seeded in Dulbecco's modified Eagle's medium ( DMEM ) with 10% Fetal Bovine Serum ( FBS , Biological Industries, Kibbutz, Israel) and antibiotics one day before infection. SARS-CoV-2 viruses were added to the cell monolayer and allowed to sit for 1 hour at 37 C. After viruses were removed, the cell monolayer was washed once with PBS before covering with media containing agarose or methylcellulose for 5-7 days. The cells were fixed with 3.7% formaldehyde overnight followed by removal of overlay media. They were then stained with crystal violet to count the plaque-forming units ( PFU ). The percentage of inhibition was calculated as [1−(VD/VC)] 100%, where VD and VC refer to the virus titer in the presence and absence of a test compound, respectively.
- plaque reduction assay Confluent monolayers of Vero E6 ACE2 cells in 12-well plates were washed once with DMEM and infected with approximately 50 plaque forming units (PFUs) of SARS-CoV-2 in each well. The plates were incubated on a rocker at 37 °C for 45 min for virus adsorption. The virus inoculum was removed and replaced by overlay medium (DMEM containing 1% low-melting point agarose without serum) containing 3-fold serial dilutions of the test compounds and placed in a 37 °C CO2 incubator until plaques could be visualized under light. The cells were then fixed with a 4% formaldehyde solution for at least 30 min, and the overlaid agarose was removed and stained with a 0.2% (w/v) crystal violet solution. The plaques were counted by visual examination, and the required concentration to reduce the 50% plaque number (EC50) was calculated relative to the control without test compounds.
- Viral quantification via plaque assay in Paris Cells were seeded in 24-well plates at a concentration of 7.5×10⁴ cells/well. The following day, serial dilutions were performed in serum-free MEM media. After 1 hour, absorption at 37° C., 2× overlay media was added to the inoculum to give a final concentration of 2% (v/v) FBS/MEM media and 0.05% (w/v) agarose (all Thermo Fisher Scientific) to achieve a semi-solid overlay. Plaque assays were incubated at 37° C. for 3 days. Samples were fixed using 4% formalin (Sigma Aldrich) and plaques were visualized using crystal Violet solution (Sigma Aldrich).Cell viability Paris. Cell viability was measured using the CellTiter-Glo luminescent cell viability assay (Promega) following the manufacturer's instructions, and luminescence measured in a Tecan Infinite 2000 plate reader. Cytotoxicity was performed in uninfected cells with same compound dilutions and concurrent with viral replication assay. Percent viability was calculated relative to untreated cells (100% viability) and cells lysed with 20% ethanol (0% viability).
- BVDV antiviral and plaque assays To evaluate antiviral activity against BVDV, a single cycle virus yield reduction assay was performed in the presence of from 0.16 μM to 100 μM through 5-fold dilution. Specifically, 2×10⁵ MDBK cells/well were plated in 24 well plates. Twenty four hours later, the cells were infected with BVDV at multiplicity of infection (MOI) of 0.5 PFU/cell in 100 uL complete media. After adsorption for 1 hour at 37° C., the inoculum was removed, and cells were washed with media before media containing vehicle or from 0.16 μM to 100 μM through 5-fold dilution of test compound was added. At 22 hours post infection, both cells and media were collected and freeze-thawed three times before the virus was tittered. For BVDV virus, titer determination, 10−2, 10−3, 10−4 dilutions of virus were inoculated onto MDBK cells as described previously. After absorption and washing the cells were overlaid with medium containing methylcellulose or soft agar and incubated at 37° C. for 3 days or until plaques were visible. Plaques were counted directly under the microscope or after staining with crystal violet in 70% methanol for 15 minutes.
- Cell Adhesion Assay Evaluation of cell attachment to extracellular matrix proteins was performed as previously described by Yokosaki et al, J. Biol. Chem., 271: (39): 24144-24150 (1996). Briefly, wells of non-tissue culture-treated polystyrene 96-well flat-bottom microtiter plates (Linbro/Titertek, Flow Laboratories, McLean, Va.) were coated by incubation with 100 μl of each substrate in PBS at 37° C. for 1 hour. 96-well flat-bottomed tissue culture plates were coated with human plasma fibronectin for 1 hour at 37° C. After incubation, wells were washed with PBS, then blocked with 1% bovine serum albumin (BSA) for one hour. Control wells were filled with 1% BSA. SW480 cells were detached using 10 mM EDTA and resuspended in serum-free DMEM. For blocking experiments, cells were incubated with 10 μg/ml of the antibody for 15 minutes at 4° C. before plating. The plates were centrifuged at 10 g for 5 minutes before incubation for 1 hour at 37° C. in humidified 5% CO2. Nonadherent cells were removed by centrifugation (top side down) at 10 g for 5 minutes. Attached cells were stained with 0.5% crystal violet, and the wells were washed with PBS. The relative number of cells in each well was evaluated after solubilization in 40 μl of 2% Triton X-100 by measuring absorbance at 595 nm in a microplate reader. All determinations were carried out in triplicate.
- Cellular Assay-Influenza Virus Replication PR8 and X31 in Calu-3 Human Bronchial Epithelial Cells The ability of the tested compound to block influenza virus replication (PR8 and X31) in Calu-3 human bronchial epithelial cells was evaluated as described by Beaulieu A. et al. J Virol. 2013 April; 87(8):4237-51.Calu-3 cells were washed with Dulbecco's phosphate-buffered saline (D-PBS) and exposed to influenza virus (diluted in incomplete medium; 0.2% bovine serum albumin [BSA] instead of FBS). After virus adsorption (1 h at 37° C.), cells were washed once with D-PBS, and cells were incubated in incomplete culture medium containing increasing concentrations of the tested compound for 48 h.Viral titers were determined in the supernatants of infected cells by viral plaque assays as described by Cloutier et al. J Infect Dis. 2012 Feb. 15; 205(4):621-30. Serial 10-fold dilutions of clarified supernatants were prepared in incomplete Eagle's minimal essential medium (EMEM) (containing 0.1% bovine serum albumin instead of fetal bovine serum) and were titered on Madin-Darby canine kidney (MDCK) cells according to standard viral plaque assays. Confluent MDCK cells were exposed to lung supernatant dilutions for 1 hour to allow virus adsorption. Cells were then washed, and a semifluid medium containing Avicel RC-581 (FMC BioPolymer), incomplete EMEM, and 1 μg/mL Tosyl phenylalanyl chloromethyl ketone (TPCK)-treated trypsin (Sigma-Aldrich) was added to the cells. Cells were incubated for 48 hours, and viral plaques were revealed with 2% crystal violet after Carnoy fixation.
- Inhibition Assay of HCoV-OC43 Human colon adenocarcinoma cell line HCT-8 (ATCC@ CCL-244, American Type Culture Collection, Manassas, VA, USA) was obtained from American Type Culture Collection (“ATCC”). It was established as stock at early passage to ensure cell line-specific characteristics. HCoV-OC43 viruses (ATCC@VR1558™, American Type Culture Collection, Manassas, VA, USA) were grown and propagated in HCT-8 cells cultured with DMEM and 2% FBS (Biological Industries, Kibbutz, Israel). The cells were seeded in a 96-well plate and then cultured in a DMEM medium containing 2% FBS. Subsequently, they were pretreated with one of Compounds 1-6 at one of five predetermined concentrations in a 5-fold dilution for 1 hour prior to HCoV-OC43 virus infection at an MOI of 0.05. The resultant supernatant at the 72 d.p.i. were subjected to an end-point assay and a TCID50 determination after 6 days to measure viral-yield inhibition. The cells (72 d.p.i.) were fixed with 80% acetone and were analyzed by an IFA assay using an antibody against HCoV-OC43 N protein. EC50 were determined accordingly. The viabilities of HCT-8 cells were also studied using CellTiter 96 AQueous Non-Radioactive Cell Proliferation Assay kit (“MTS”) (Promega, Madison, WI, USA). CC50 values were calculated. In addition, to demonstrate the cytopathic effect of HCT-8 infected by HCoV-OC43 at an MOI of 0.05, the cells thus treated were stained with crystal violet after fixation at 6 d.p.i.
- Intracellular Calcium Assay Cell Lines and Cell Culture.The PathHunter U2OS HTR2C β-Arrestin cell line (5-HT2cR-U2OS; DiscoveRx) stably express the nonedited human 5-HT2CR isoform (h5-HT2CR). The 5-HT2CR-U2OS cells were grown in Assay Complete U2OS Medium 31 (DiscoveRx) at 37° C., 5% CO2 and 85% relative humidity according to manufacturer's recommendations utilizing AssayComplete Cell Detachment Reagent (DiscoveRx). Cells were passaged at 70-80% confluence and all experiments were conducted using cells in log phase growth.Intracellular Calcium Assay.The ability of the molecules to act as agonists to induce 5-HT2CR-mediated intracellular calcium (Cai ++) release was conducted in an U2OS cell line stably expressing the human 5-HT2CR. For all molecules examined, the observed potency was shifted rightward relative to 5-HT or WAY163909 (Table 1).Intracellular calcium (Cai ++) release was monitored using the FLIPR Calcium 4 Assay Kit (Molecular Devices) according to previously published protocols with minor modifications. See, e.g., Shashack, M. J., et al., ACS Chem Neurosci. 2 (11), 640-644 (2011); Seitz, P. K.; Bremer, N. M., et al., BMC Neurosci. 13, 25 (2012).Cells were plated at 5,000-7,000 cells/well in Assay Complete Cell Plating Reagent 16 (DiscoveRx) in black-sided, clear bottomed 96-well tissue culture plates and allowed to adhere overnight. Medium was removed and replaced with 40 μl Hank's balanced salt solution without calcium, magnesium and phenol red (HBSS; Corning) plus 40 μl Calcium 4 dye solution in Buffer B supplemented with 2.5 mM probenecid (Sigma-Aldrich) to inhibit extracellular dye transport. Plates were incubated for 60 min at 37° C. followed by 30 min at room temperature in the dark.Fluorescence (λex=485 nm, λem=525 nm) was measured using a FlexStation3 (Molecular Devices). Baseline was established for 17 secs before addition of 20 μl vehicle (HBSS without calcium or magnesium) or 5× concentrated compound. Addition of 5-HT, WAY163909, or ligand occurred at the 17-sec time point and fluorescence was recorded every 1.7 sec for 120 sec. Maximum peak height was determined using FlexStation software (SoftMax Pro 5.4). After the final readings, cells were fixed in 2% paraformaldehyde overnight.Data AnalysisPeak responses from each well were normalized to total cell mass as determined with crystal violet staining. See e.g., Ding, C. et al., ACS Chem. Neurosci 3 (7), 538-545 (2012).