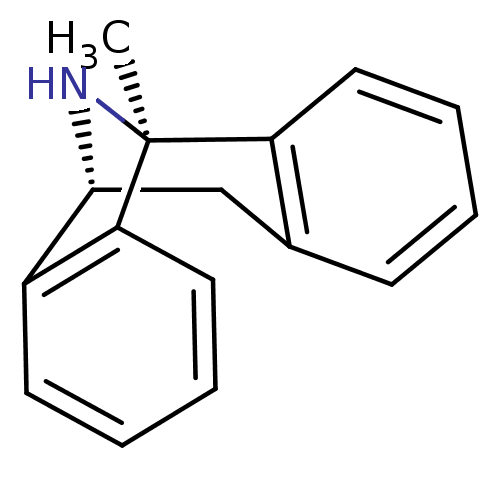
 1-methyl-16-azatetracyclo[7.6.1.02,7.010,15]hexadeca-2(7),3,5,10(15),11,13-hexaene maleate((+)-MK801) BDBM50030386 (1S)-1-methyl-16-azatetracyclo[7.6.1.0^{2,7}.0^{10,15}]hexadeca-2(7),3,5,10,12,14-hexaene; (2Z)-but-2-enedioate
 (1S,9R)-1-methyl-16-azatetracyclo[7.6.1.0^{2,7}.0^{10,15}]hexadeca-2,4,6,10(15),11,13-hexaene (5S,10S)-(+)-5-methyl-10,11-dihydro-5Hdibenzo[a,d]cyclohepten-5,10-imine 1-methyl-16-azatetracyclo[7.6.1.02,7.010,15]hexadeca-2(7),3,5,10(15),11,13-hexaene(MK-801) (+)-1-methyl-16-azatetracyclo[7.6.1.02,7.010,15]hexadeca-2(7),3,5,10(15),11,13-hexaene 1-methyl-16-azatetracyclo[7.6.1.02,7.010,15]hexadeca-2(7),3,5,10,12,14-hexaene CHEMBL284237 1-methyl-16-azatetracyclo[7.6.1.02,7.010,15]hexadeca-2,4,6,10(15),11,13-hexaene (-)-1-methyl-16-azatetracyclo[7.6.1.02,7.010,15]hexadeca-2(7),3,5,10(15),11,13-hexaene (MK-801)1-methyl-16-azatetracyclo[7.6.1.02,7.010,15]hexadeca-2(7),3,5,10(15),11,13-hexaene dizocilpine (+)-MK-801 (+)MK-801 (+/-) MK-8011-methyl-(9R,1R)-16-azatetracyclo[7.6.1.02,7.010,15]hexadeca-2(7),3,5,10(15),11,13-hexaene (5S,10R)-(+)-5-methyl-10,11-dihydro-5Hdibenzo[a,d]cyclohepten-5,10-imine MK-801 1-methyl-16-azatetracyclo[7.6.1.02,7.010,15]hexadeca-2(7),3,5,10(15),11,13-hexaene BDBM50344263 (+/-)-1-methyl-16-azatetracyclo[7.6.1.02,7.010,15]hexadeca-2(7),3,5,10(15),11,13-hexaene (+/-)-MK801 (1S,9R)-1-methyl-16-azatetracyclo[7.6.1.0^{2,7}.0^{10,15}]hexadeca-2(7),3,5,10(15),11,13-hexaene MK-801 (Dizocilpine) (-)-MK801 (Dizocilpine)1-methyl-16-azatetracyclo[7.6.1.02,7.010,15]hexadeca-2(7),3,5,10(15),11,13-hexaene 10,11-Dihydro-5-methyl-5H-dibenzo[a,d]cyclohepten-5,10-imine.(MK-801)
 1-methyl-16-azatetracyclo[7.6.1.02,7.010,15]hexadeca-2(7),3,5,10(15),11,13-hexaene(MK-801) (+)-1-methyl-16-azatetracyclo[7.6.1.02,7.010,15]hexadeca-2(7),3,5,10(15),11,13-hexaene (+/-) MK-8011-methyl-(9R,1R)-16-azatetracyclo[7.6.1.02,7.010,15]hexadeca-2(7),3,5,10(15),11,13-hexaene (5S,10R)-(+)-5-methyl-10,11-dihydro-5Hdibenzo[a,d]cyclohepten-5,10-imine MK-801 1-methyl-16-azatetracyclo[7.6.1.02,7.010,15]hexadeca-2(7),3,5,10(15),11,13-hexaene (+/-)-1-methyl-16-azatetracyclo[7.6.1.02,7.010,15]hexadeca-2(7),3,5,10(15),11,13-hexaene (1S,9R)-1-methyl-16-azatetracyclo[7.6.1.0^{2,7}.0^{10,15}]hexadeca-2(7),3,5,10(15),11,13-hexaene BDBM50000663 MK-801 (Dizocilpine) (-)-MK801 US11944616, Compound Dizocilpine (Dizocilpine)1-methyl-16-azatetracyclo[7.6.1.02,7.010,15]hexadeca-2(7),3,5,10(15),11,13-hexaene (1S,9R)-1-methyl-16-azatetracyclo[7.6.1.0^{2,7}.0^{10,15}]hexadeca-2,4,6,10(15),11,13-hexaene MK-801,(+) (5S,10S)-(+)-5-methyl-10,11-dihydro-5Hdibenzo[a,d]cyclohepten-5,10-imine 1-methyl-16-azatetracyclo[7.6.1.02,7.010,15]hexadeca-2(7),3,5,10,12,14-hexaene CHEMBL284237 MK-801,(-) 1-methyl-16-azatetracyclo[7.6.1.02,7.010,15]hexadeca-2,4,6,10(15),11,13-hexaene (-)-1-methyl-16-azatetracyclo[7.6.1.02,7.010,15]hexadeca-2(7),3,5,10(15),11,13-hexaene (MK-801)1-methyl-16-azatetracyclo[7.6.1.02,7.010,15]hexadeca-2(7),3,5,10(15),11,13-hexaene dizocilpine (+)-MK-801 (+)MK-801 (+/-)-MK801 10,11-Dihydro-5-methyl-5H-dibenzo[a,d]cyclohepten-5,10-imine.(MK-801)
- ChEMBL_2294015 Displacement of [3H]MK801 from NMDA receptor NR2B subunit (unknown origin)
- ChEMBL_2033648 (CHEMBL4687806) Displacement of [3H]-MK801 from rat brain GluN1/GluN2A expressed in HEK293 cells
- ChEMBL_2033649 (CHEMBL4687807) Displacement of [3H]-MK801 from rat brain GluN1/GluN2B expressed in HEK293 cells
- ChEMBL_2033653 (CHEMBL4687811) Displacement of [3H]-MK801 from human forebrain GluN1/GluN2B expressed in HEK293 cells by at -70 mV holding potential by patch-clamp assay
- FDSS Assay To each well of the plate, 10 μL test compound, control (MK801) or HHnoCa buffer was added to a final concentration of 10 μM with a final concentration of DMSO of 0.1%. Following 10 minutes pre-incubation in the dark, plates are loaded onto the Hamamatsu FDSS 6000. After collecting baseline fluorescence images, 3 μM glutamate, 3 glycine, and 1 mM Ca2+ in HHnoCa buffer is added to each well, and Ca2+ is recorded for 3 minutes. Data were processed by computing ratio of fluorescence at the end of data collection to baseline fluorescence to assess degree of Ca′ influx inhibition relative to that observed in MK801.
- Receptor Binding Assay Affinities of various compounds were measured in vitro using competitive radioligand binding assays. Serial dilutions of test compounds were incubated with membranes prepared from CHO-K1 cells expressing the mu opioid receptor (MOR; for opioid receptor binding) or rat forebrain membranes (for NMDA receptor binding). 2 nM [3H] Naloxone (MOR) or 0.2 nM [3H] MK801 (NMDA) were used as the specific, competitive radioligands. 10 uM Naloxone (MOR), or 10 uM MK801 (NMDA) was used to determine non-specific binding. Bound radioactivity was measured using a scintillation counter & IC50 values for test compounds were determined by non-linear regression analysis using a one-site competition model (Graph Pad Prizm). Due to each test compound being solubilized in a buffered system for the assay, the results presented herein reflect the free base activity.
- NR2B Antagonist Activity HEK293 cell lines stably expressing cloned human NR1/NR2B and NR1/NR2A, respectively, were established according to standard previously described methods (Hansen et al. Comb. Chem High Throughput Screen. 2008, 11:304-315). Activation of the NR2A or NR2B subtype of NMDA receptor with glutamate as an agonist and glycine co-agonist on these cells results in calcium influx, which can be monitored with fluorescent indicator Fluo-4. A cell-based assay has been implemented to evaluate the effect of a compound on NR2A and NR2B receptors by measuring the fluorescent changes (Hansen et al. Comb. Chem High Throughput Screen. 2008, 11:304-315).HEK293 cells stably expressing NR2A or NR2B receptors were cultured at 37 ° C. in a humidified CO2 incubator in DMEM supplemented with 10% fetal bovine serum (FBS) (Hyclone), 10 M MK801 (Sigma-Aldrich) and 50 M AP-5 (Tocris). For experiments, the cells were seeded onto poly-D-lysine-coated 96-well black plates with clear bottom (Corning) at a density of 50,000 cells/well. After overnight culture, the growth medium was removed from the wells and the cells were incubated at 37 ° C. for 60 minutes in Hanks buffer containing 4 M fluo-4-AM (Invitrogen) and 0.1% bovine serum albumin (BSA). After dye-loading, the cells were washed three times with Hanks buffer and incubated for 10 minutes at room temperature with various concentrations of test compounds prepared in Hanks buffer with 0.1% BSA. The cell plates were placed onto an FDSS Cell fluorescence reader (Hamamatsu). After 20 seconds of reading background fluorescence, agonist glutamate at final 100 M and co-agonist glycine at final 50 M were added to the cells to activate the receptor, and the resulting fluorescence changes were recorded and quantified. Based on the changes in fluorescence intensity, the pharmacological effect of test compounds was analyzed and the IC50 values derived from a non-linear least squares fitting of the concentration-dependent response to a standard logistic equation using Prism (Graphpad Software, Inc.):Amplitude=Max Amplitude/(1+(IC50/[antagonist])n).
- NR2B Antagonist Activity HEK293 cell lines stably expressing cloned human NR1/NR2B and NR1/NR2A, respectively, were established according to standard previously described methods (Hansen et al., Comb. Chem High Throughput Screen. 11:304, 2008). Activation of the NR2A or NR2B subtype of NMDA receptor with glutamate as an agonist and glycine co-agonist on these cells results in calcium influx, which can be monitored with fluorescent indicator Fluo-4. A cell based assay has been implemented to evaluate the effect of a compound on NR2A and NR2B receptors by measuring the fluorescent changes (Hansen et al., Comb. Chem High Throughput Screen. 11:304, 2008).HEK293 cells stably expressing NR2A or NR2B receptors were cultured at 37° C. in a humidified CO2 incubator in DMEM supplemented with 10% fetal bovine serum (FBS) (Hyclone), 10 μM MK801 (Sigma-Aldrich) and 50 μM AP-5 (Tocris). For experiments, the cells were seeded onto poly-D-lysine-coated 96-well black plates with clear bottom (Corning) at a density of 50,000 cells/well. After overnight culture, the growth medium was removed from the wells and the cells were incubated at 37° C. for 60 min in Hanks buffer containing 4 μM fluo-4-AM (Invitrogen) and 0.1% bovine serum albumin (BSA). After dye-loading, the cells were washed three times with Hanks buffer and incubated for 10 min at room temperature with various concentrations of test compounds prepared in Hanks buffer with 0.1% BSA. The cell plates were placed onto FDSS μCell fluorescence reader (Hamamatsu). After 20 sec reading of background fluorescence, agonist glutamate at final 100 μM and co-agonist glycine at final 50 μM were added to the cells to activate the receptor, and the resulting fluorescence changes were recorded and quantified. Based on the changes in fluorescence intensity, the pharmacological effect of test compounds were analyzed and the IC50 values derived from a non-linear least squares fitting of the concentration-dependent response to a standard logistic equation using Prism (Graphpad, Inc): Amplitude=Max Amplitude/(1+(IC50/[antagonist])n).
- NR2B Antagonist Activity HEK293 cell lines stably expressing cloned human NR1/NR2B and NR1/NR2A, respectively, were established according to standard previously described methods (Hansen et al., Comb. Chem High Throughput Screen. 11:304, 2008). Activation of the NR2A or NR2B subtype of NMDA receptor with glutamate as an agonist and glycine co-agonist on these cells results in calcium influx, which can be monitored with fluorescent indicator Fluo-4. A cell based assay has been implemented to evaluate the effect of a compound on NR2A and NR2B receptors by measuring the fluorescent changes (Hansen et al., Comb. Chem High Throughput Screen. 11:304, 2008).HEK293 cells stably expressing NR2A or NR2B receptors were cultured at 37° C. in a humidified CO2 incubator in DMEM supplemented with 10% fetal bovine serum (FBS) (Hyclone), 10 μM MK801 (Sigma-Aldrich) and 50 μM AP-5 (Tocris). For experiments, the cells were seeded onto poly-D-lysine-coated 96-well black plates with clear bottom (Corning) at a density of 50,000 cells/well. After overnight culture, the growth medium was removed from the wells and the cells were incubated at 37° C. for 60 min in Hanks buffer containing 4 μM fluo-4-AM (Invitrogen) and 0.1% bovine serum albumin (BSA). After dye-loading, the cells were washed three times with Hanks buffer and incubated for 10 min at room temperature with various concentrations of test compounds prepared in Hanks buffer with 0.1% BSA. The cell plates were placed onto FDSS μCell fluorescence reader (Hamamatsu). After 20 sec reading of background fluorescence, agonist glutamate at final 100 μM and co-agonist glycine at final 50 μM were added to the cells to activate the receptor, and the resulting fluorescence changes were recorded and quantified. Based on the changes in fluorescence intensity, the pharmacological effect of test compounds were analyzed and the IC50 values derived from a non-linear least squares fitting of the concentration-dependent response to a standard logistic equation using Prism (Graphpad, Inc):Amplitude=Max Amplitude/(1+(IC 50/[antagonist])n).
- NR2B Antagonist Activity HEK293 cell lines stably expressing cloned human NR1/NR2B and NR1/NR2A, respectively, were established according to standard previously described methods (Hansen et al., Comb. Chem High Throughput Screen. 11:304, 2008). Activation of the NR2A or NR2B subtype of NMDA receptor with glutamate as an agonist and glycine co-agonist on these cells results in calcium influx, which can be monitored with fluorescent indicator Fluo-4. A cell based assay has been implemented to evaluate the effect of a compound on NR2A and NR2B receptors by measuring the fluorescent changes (Hansen et al., Comb. Chem High Throughput Screen. 11:304, 2008).HEK293 cells stably expressing NR2A or NR2B receptors were cultured at 37° C. in a humidified CO2 incubator in DMEM supplemented with 10% fetal bovine serum (FBS) (Hyclone), 10 μM MK801 (Sigma-Aldrich) and 50 μM AP-5 (Tocris). For experiments, the cells were seeded onto poly-D-lysine-coated 96-well black plates with clear bottom (Corning) at a density of 50,000 cells/well. After overnight culture, the growth medium was removed from the wells and the cells were incubated at 37° C. for 60 min in Hanks buffer containing 4 μM fluo-4-AM (Invitrogen) and 0.1% bovine serum albumin (BSA). After dye-loading, the cells were washed three times with Hanks buffer and incubated for 10 min at room temperature with various concentrations of test compounds prepared in Hanks buffer with 0.1% BSA. The cell plates were placed onto FDSS μCell fluorescence reader (Hamamatsu). After 20 sec reading of background fluorescence, agonist glutamate at final 100 μM and co-agonist glycine at final 50 μM were added to the cells to activate the receptor, and the resulting fluorescence changes were recorded and quantified. Based on the changes in fluorescence intensity, the pharmacological effect of test compounds were analyzed and the IC50 values derived from a non-linear least squares fitting of the concentration-dependent response to a standard logistic equation using Prism (Graphpad, Inc):Amplitude=Max Amplitude/(1+(IC50/[antagonist])n).
- NR2B Antagonist Activity HEK293 cell lines stably expressing cloned human NR1/NR2B and NR1/NR2A, respectively, were established according to standard previously described methods (Hansen et al., Comb. Chem High Throughput Screen. 11:304, 2008). Activation of the NR2A or NR2B subtype of NMDA receptor with glutamate as an agonist and glycine co-agonist on these cells results in calcium influx, which can be monitored with fluorescent indicator Fluo-4. A cell based assay has been implemented to evaluate the effect of a compound on NR2A and NR2B receptors by measuring the fluorescent changes (Hansen et al., Comb. Chem High Throughput Screen. 11:304, 2008).HEK293 cells stably expressing NR2A or NR2B receptors were cultured at 37° C. in a humidified CO2 incubator in DMEM supplemented with 10% fetal bovine serum (FBS) (Hyclone), 10 μM MK801 (Sigma-Aldrich) and 50 μM AP-5 (Tocris). For experiments, the cells were seeded onto poly-D-lysine-coated 96-well black plates with clear bottom (Corning) at a density of 50,000 cells/well. After overnight culture, the growth medium was removed from the wells and the cells were incubated at 37° C. for 60 min in Hanks buffer containing 4 μM fluo-4-AM (Invitrogen) and 0.1% bovine serum albumin (BSA). After dye-loading, the cells were washed three times with Hanks buffer and incubated for 10 min at room temperature with various concentrations of test compounds prepared in Hanks buffer with 0.1% BSA. The cell plates were placed onto FDSS pCell fluorescence reader (Hamamatsu). After 20 sec reading of background fluorescence, agonist glutamate at final 100 μM and co-agonist glycine at final 50 μM were added to the cells to activate the receptor, and the resulting fluorescence changes were recorded and quantified. Based on the changes in fluorescence intensity, the pharmacological effect of test compounds were analyzed and the IC50 values derived from a non-linear least squares fitting of the concentration-dependent response to a standard logistic equation using Prism (Graphpad, Inc): Amplitude=Max Amplitude/(1+(IC50/[antagonist])n).