Query String: Tofacitinib
 US10961228, Example Tofacitinib US11414413, Example Tofacitinib US20230348487, Example Tofacitinib US11524961, Compound Toficitinib BDBM488640
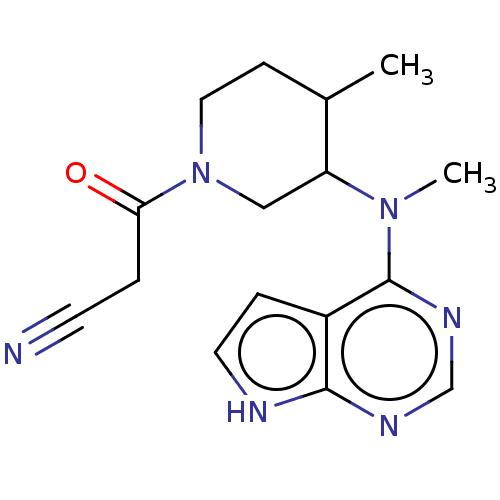
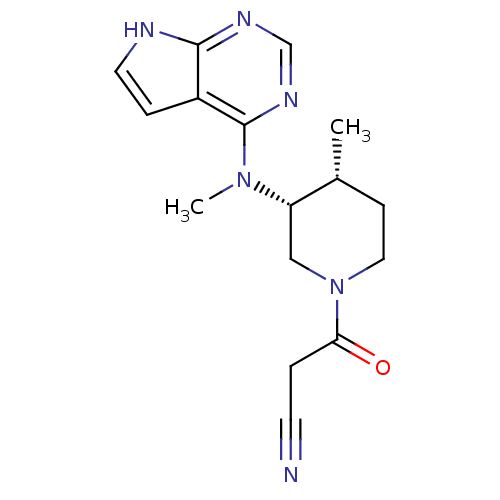 BDBM50193995 US10112907, Example 00035 US10399979, Compound Tofacitinib CHEMBL221959 US20240140952, Compound Tofacitinib 3-((3R,4R)-4-methyl-3-(methyl(7H-pyrrolo[2,3-d]pyrimidin-4-yl)amino)piperidin-1-yl)-3-oxopropanenitrile US10875847, Compound Tofacitinib Tofacitinib citrate (1) 3-{(3R,4R)-4-methyl-3-[methyl(7H-pyrrolo[2,3-d]pyrimidin-4-yl)amino]piperidin-1-yl}-3-oxopropanenitrile Tofacitinib US10766894, Compound TABLE 1.20 US11203595, TABLE 1.20 TOFACITINIB CITRATE US20250257069, Compound Tofacitinib 3-(4-methyl-3-(methyl(7H-pyrrolo[2,3-d]pyrimidin-4-yl)amino)piperidin-1-yl)-3-oxopropanenitrile US11078206, Example Tofacitinib CP-690550 US11339167, Example Tofacitinib
- In Vitro Kinase Assays Biological activities of the MMT3-72 and its active metabolite MMT3-72-M2 were evaluated against JAK1, JAK2, JAK3 and TYK2 using kinase assays (FIG. 3 , Table 1). The compound MMT3-72 showed modest inhibitory activities against JAK1 and JAK2 (199.3 nM and 448.3 nM, respectively) and poor inhibitory activities against JAK3 and TYK2 (6821 nM and 2976 nM, respectively). However, the active metabolite MMT3-72-M2 showed strong inhibitory activities against JAK1 (2.0 nM), JAK2 (16.3 nM), and TYK2 (55.2 nM), but only weak inhibitory activities against JAK3 (701.3 nM). In comparison, fedratinib strongly inhibited JAK1 (10.1 nM) and JAK2 (15.6 nM), but poorly inhibited JAK3 and TYK2. The inhibitory profiles of JAK1, 2, and TYK2 of MMT3-72-M2 may have advantages to treat UC since JAK2/TYK2/IL-12/IL-23 signaling is strongly implicated in UC, while JAK1 isoform has long been identified as potential target in treating IBD as seen in Upadacitinib. In addition, MMT3-72-M2 showed poor inhibitory activities against JAK3 that may also be preferred in treating UC to reduce the unwanted adverse effects. Tofacitinib inhibited JAK3 with an IC50 of 1.6 nM and showed serious adverse effects. JAK3 inhibition has been shown to potentially lead to lymphopenia and thus hypothetically to an increased risk of infection.
- JAK1, JAK2 and JAK3 In Vitro Enzyme Assays The JAK LanthaScreen Kinase Assay (Invitrogen) is used to determine the ability of test compounds to inhibit JAK1, JAK2, and JAK3 kinase activity. These are TR-FRET assay formats that use long-lifetime terbium labeled antibody as the donor species and GFP-STAT1 as the acceptor species. Use the TR-FRET ratio to monitor JAK kinase activity where an increase in phosphorylation of the GFP-STAT1 results in an increase in the TR-FRET ratio. Perform the kinase reaction using a 12.5 μl reaction volume in shallow black 384-well Proxiplate . Add reagents to obtain final reaction conditions of 50 ml HEPES pH, 1.76 mM Triton X-100, ATP (20.0 μM for JAK1 and JAK3 or 5 μM for JAK2) enzyme assays, 10.0 mM MgCl2, 1 mM EGTA and 0.01% Brij-35, 0.05 mM GFP-STAT1, 14 nM JAK1 enzyme for JAK1, 1.0 nM for JAK2 or 2.5 nM for JAK3 enzyme assays, and 4% DMSO and serial dilutions of test compound (diluted 1:3 from 20,000 to 1 nM). Following ATP/GFP-STAT1 addition, centrifuge the assay plates for 1 minute at 1000 revolutions per minute (RPM). Allow the plates to incubate at RT for 60 minutes and then add 12.5 μl of a stopping buffer containing 20 mM EDTA, 2 nM Terbium-anti-phosphorylated Signal Transducers and Activators of Transcription [phosphorylation Tyrosine 701 amino acid] Antibody (Tb-anti-pSTAT1 [pTyr701], 0.67 mM tris(hydroxymethyl)aminoethane hydrochloride (Trizma) pH 7.5, 0.02% NaN3 and 0.01% nonylphenylpolyethylene glycol (Nonidet P40). Incubate at RT for 90 min and read in an EnVision plate reader with 340 nm wavelength excitation filter and emission filters of 520 nm and 495 nm wavelengths. Derive the ratio from the emission wavelength for the GFP-STAT1 which is measured at 520 nm versus the emission at 495 nm for the (Tb-anti-pSTAT1 [pTyr701]. Derive the IC50 value for each compound using percent inhibition data which is calculated from the reaction data relative to on-plate controls (active enzyme versus enzyme inhibited at 2.0 mM with tofacitinib). Use ACTIVITYBASE 4.0 to fit the percent inhibition and ten-point compound concentration data to a four-parameter logistic equation.