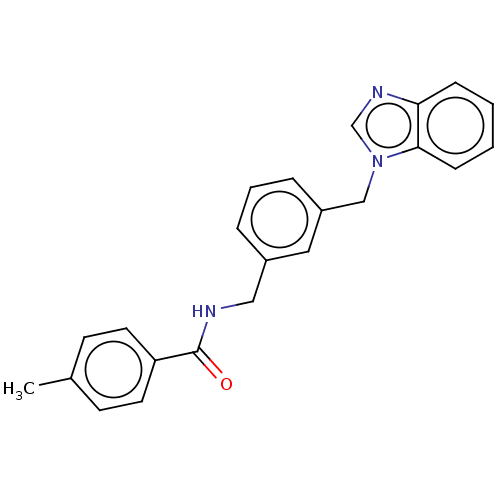
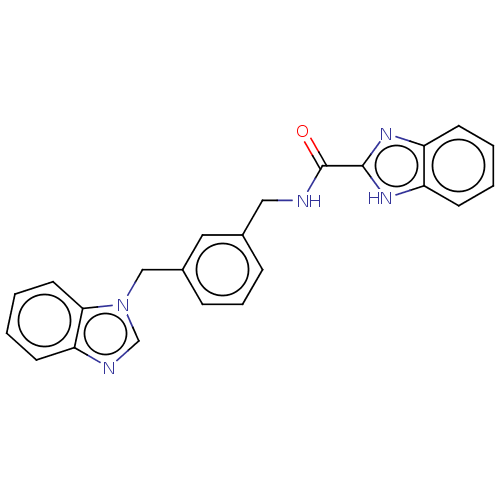
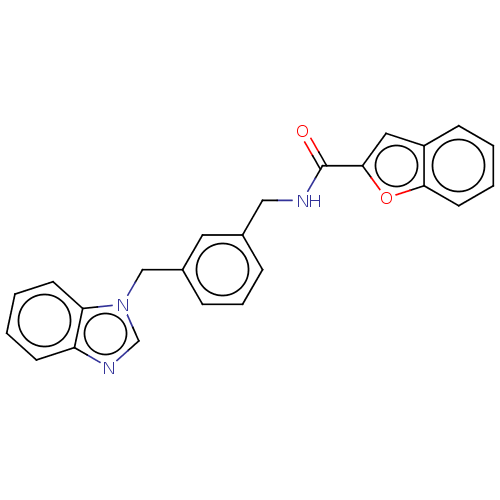
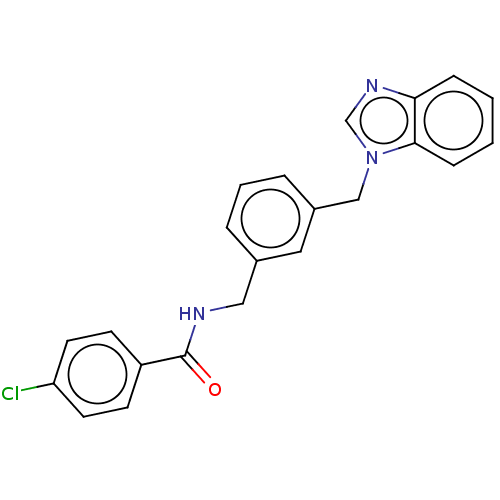
 Found 32 Enz. Inhib. hit(s) with all data for entry = 50007998
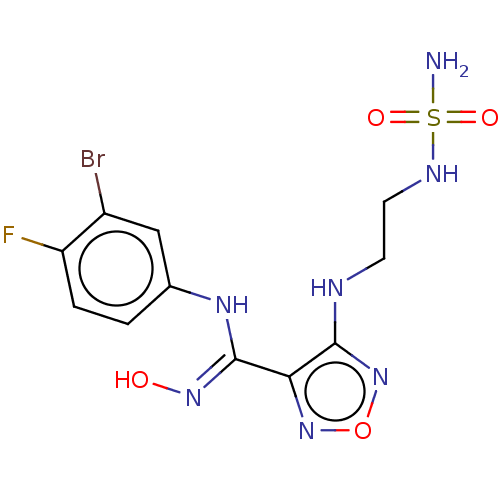
Affinity DataIC50: 7.70nMAssay Description:Inhibition of IDO1 in IFNgamma-stimulated human A375 cells assessed as reduction in L-Kyn level measured after 48 hrs by HPLC analysisMore data for this Ligand-Target Pair
 3D Structure (crystal)
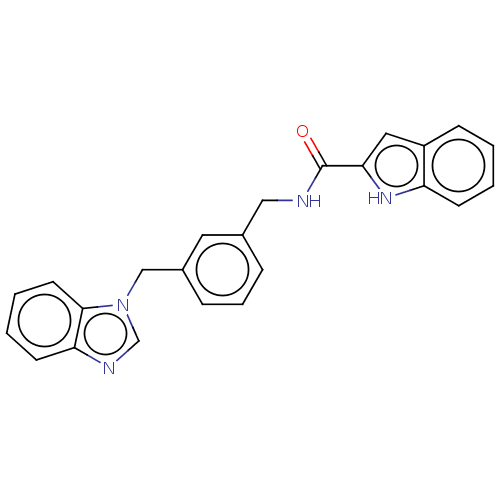
Affinity DataIC50: 9.30nMAssay Description:Inhibition of mouse IDO1 transfected in P815 cells assessed as reduction in L-Kyn level measured after 16 hrs by HPLC analysisMore data for this Ligand-Target Pair

Affinity DataIC50: 13nMAssay Description:Inhibition of mouse IDO1 transfected in P815 cells assessed as reduction in L-Kyn level measured after 16 hrs by HPLC analysisMore data for this Ligand-Target Pair
Affinity DataIC50: 14nMAssay Description:Inhibition of IDO1 in IFNgamma-stimulated human LXF-289 cells assessed as reduction in L-Kyn level measured after 48 hrs by HPLC analysisMore data for this Ligand-Target Pair
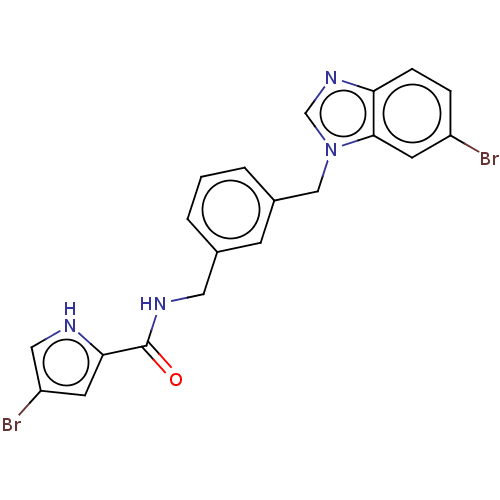
Affinity DataIC50: 16nMAssay Description:Inhibition of IDO1 in IFNgamma-stimulated human A375 cells assessed as reduction in L-Kyn level measured after 48 hrs by HPLC analysisMore data for this Ligand-Target Pair
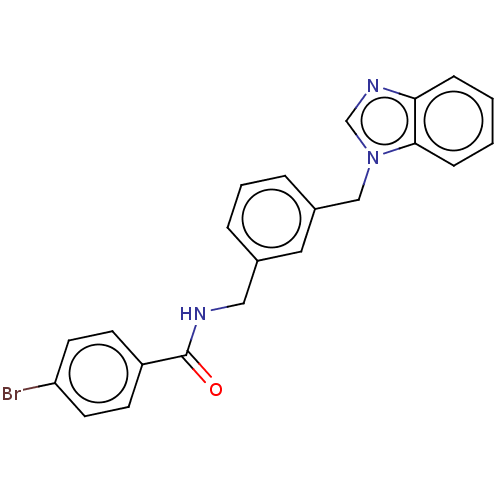
Affinity DataIC50: 19nMAssay Description:Inhibition of IDO1 in IFNgamma-stimulated human A375 cells assessed as reduction in L-Kyn level measured after 48 hrs by HPLC analysisMore data for this Ligand-Target Pair
Affinity DataIC50: 21nMAssay Description:Inhibition of IDO1 in IFNgamma-stimulated human MCF7 cells assessed as reduction in L-Kyn level measured after 48 hrs by HPLC analysisMore data for this Ligand-Target Pair
Affinity DataIC50: 43nMAssay Description:Inhibition of IDO1 in IFNgamma-stimulated human HepG2 cells assessed as reduction in L-Kyn level measured after 48 hrs by HPLC analysisMore data for this Ligand-Target Pair
Affinity DataIC50: 64nMAssay Description:Inhibition of IDO1 in IFNgamma-stimulated human HeLa cells assessed as reduction in L-Kyn level measured after 48 hrs by HPLC analysisMore data for this Ligand-Target Pair
Affinity DataIC50: 72nMAssay Description:Inhibition of IDO1 in IFNgamma-stimulated human HeLa cells assessed as reduction in L-Kyn level measured after 48 hrs by HPLC analysisMore data for this Ligand-Target Pair
Affinity DataIC50: 72nMAssay Description:Inhibition of IDO1 in IFNgamma-stimulated human A375 cells assessed as reduction in L-Kyn level measured after 48 hrs by HPLC analysisMore data for this Ligand-Target Pair
Affinity DataIC50: 83nMAssay Description:Inhibition of IDO1 in IFNgamma-stimulated human MCF7 cells assessed as reduction in L-Kyn level measured after 48 hrs by HPLC analysisMore data for this Ligand-Target Pair

Affinity DataIC50: 90nMAssay Description:Inhibition of IDO1 in IFNgamma-stimulated human A375 cells assessed as reduction in L-Kyn level measured after 48 hrs by HPLC analysisMore data for this Ligand-Target Pair
Affinity DataIC50: 90nMAssay Description:Inhibition of IDO1 in IFNgamma-stimulated human HeLa cells assessed as reduction in L-Kyn level measured after 48 hrs by HPLC analysisMore data for this Ligand-Target Pair
Affinity DataIC50: 110nMAssay Description:Inhibition of IDO1 in IFNgamma-stimulated human MCF7 cells assessed as reduction in L-Kyn level measured after 48 hrs by HPLC analysisMore data for this Ligand-Target Pair
Affinity DataIC50: 112nMAssay Description:Inhibition of mouse IDO1 transfected in P815 cells assessed as reduction in L-Kyn level measured after 16 hrs by HPLC analysisMore data for this Ligand-Target Pair
Affinity DataIC50: 134nMAssay Description:Inhibition of IDO1 in IFNgamma-stimulated human A375 cells assessed as reduction in L-Kyn level measured after 48 hrs by HPLC analysisMore data for this Ligand-Target Pair
Affinity DataIC50: 140nMAssay Description:Inhibition of IDO1 in IFNgamma-stimulated human DAN-G cells assessed as reduction in L-Kyn level measured after 48 hrs by HPLC analysisMore data for this Ligand-Target Pair
Affinity DataIC50: 327nMAssay Description:Inhibition of IDO1 in IFNgamma-stimulated human A375 cells assessed as reduction in L-Kyn level measured after 48 hrs by HPLC analysisMore data for this Ligand-Target Pair
Affinity DataIC50: 407nMAssay Description:Inhibition of IDO1 in IFNgamma-stimulated human A375 cells assessed as reduction in L-Kyn level measured after 48 hrs by HPLC analysisMore data for this Ligand-Target Pair
Affinity DataIC50: 413nMAssay Description:Inhibition of IDO1 in IFNgamma-stimulated human A375 cells assessed as reduction in L-Kyn level measured after 48 hrs by HPLC analysisMore data for this Ligand-Target Pair
Affinity DataIC50: 477nMAssay Description:Inhibition of IDO1 in IFNgamma-stimulated human A375 cells assessed as reduction in L-Kyn level measured after 48 hrs by HPLC analysisMore data for this Ligand-Target Pair
Affinity DataIC50: 605nMAssay Description:Inhibition of IDO1 in IFNgamma-stimulated human DAN-G cells assessed as reduction in L-Kyn level measured after 48 hrs by HPLC analysisMore data for this Ligand-Target Pair
Affinity DataIC50: 636nMAssay Description:Inhibition of IDO1 in IFNgamma-stimulated human A375 cells assessed as reduction in L-Kyn level measured after 48 hrs by HPLC analysisMore data for this Ligand-Target Pair
Affinity DataIC50: 781nMAssay Description:Inhibition of IDO1 in IFNgamma-stimulated human A375 cells assessed as reduction in L-Kyn level measured after 48 hrs by HPLC analysisMore data for this Ligand-Target Pair
Affinity DataIC50: 961nMAssay Description:Inhibition of IDO1 in IFNgamma-stimulated human A375 cells assessed as reduction in L-Kyn level measured after 48 hrs by HPLC analysisMore data for this Ligand-Target Pair
Affinity DataIC50: 1.94E+3nMAssay Description:Inhibition of IDO1 in IFNgamma-stimulated human DAN-G cells assessed as reduction in L-Kyn level measured after 48 hrs by HPLC analysisMore data for this Ligand-Target Pair
Affinity DataIC50: 5.46E+3nMAssay Description:Inhibition of mouse TDO transfected in P815 cells assessed as reduction in L-Kyn level measured after 16 hrs by HPLC analysisMore data for this Ligand-Target Pair
Affinity DataIC50: 1.32E+4nMAssay Description:Inhibition of mouse TDO transfected in P815 cells assessed as reduction in L-Kyn level measured after 16 hrs by HPLC analysisMore data for this Ligand-Target Pair
Affinity DataIC50: 3.23E+4nMAssay Description:Inhibition of mouse TDO transfected in P815 cells assessed as reduction in L-Kyn level measured after 16 hrs by HPLC analysisMore data for this Ligand-Target Pair
Affinity DataKd: 550nMAssay Description:Binding affinity to NT650-NHS fluorophore-labeled recombinant human N-terminal His-tagged IDO1 expressed in Escherichia coli measured after 10 mins b...More data for this Ligand-Target Pair
Affinity DataKd: 3.46E+3nMAssay Description:Binding affinity to NT650-NHS fluorophore-labeled recombinant human N-terminal His-tagged IDO1 expressed in Escherichia coli measured after 10 mins b...More data for this Ligand-Target Pair