Compound (8)
Article Title (3)
Assay (33)
Van Ommeslaeghe, K; Elaut, G; Brecx, V; Papeleu, P; Iterbeke, K; Geerlings, P; Tourwé, D; Rogiers, V Amide analogues of TSA: synthesis, binding mode analysis and HDAC inhibition. Bioorg Med Chem Lett 13: 1861 -4 (2003) Garigipati, RS; Seibel, G; Mayer, RJ; Bolognese, B; McCord, M; Marshall, LA; Adams, JL Novel frameworks for trifluoromethyl ketone and phosphonate tsa inhibitors of type II PLA2 Bioorg Med Chem Lett 7: 1421 -1426 (1997) Gradl, S; Steuber, H; Weiske, J; Szewczyk, MM; Schmees, N; Siegel, S; Stoeckigt, D; Christ, CD; Li, F; Organ, S; Abbey, M; Kennedy, S; Chau, I; Trush, V; Barsyte-Lovejoy, D; Brown, PJ; Vedadi, M; Arrowsmith, C; Husemann, M; Badock, V; Bauser, M; Haegebarth, A; Hartung, IV; Stresemann, C Discovery of the SMYD3 Inhibitor BAY-6035 Using Thermal Shift Assay (TSA)-Based High-Throughput Screening. SLAS Discov 26: 947 -960
ChEMBL_1989579 (CHEMBL4623314) Inhibition of human Cav3.1 expressed in tsA-201 cells by patch clamp electrophysiology ChEMBL_1989580 (CHEMBL4623315) Inhibition of human Cav3.2 expressed in tsA-201 cells by patch clamp electrophysiology ChEMBL_1989581 (CHEMBL4623316) Inhibition of human Cav3.3 expressed in tsA-201 cells by patch clamp electrophysiology ChEMBL_1456651 (CHEMBL3370251) Agonist activity at human GABAAalpha1beta2gamma2S receptor expressed in tsA-201cells by FLIPR membrane potential blue assay ChEMBL_1456653 (CHEMBL3370253) Agonist activity at human GABAA rho1 expressed in tsA-201cells by FLIPR membrane potential blue assay ChEMBL_1456657 (CHEMBL3370257) Agonist activity at human GABAAalpha2beta2gamma2S receptor expressed in tsA-201cells by FLIPR membrane potential blue assay ChEMBL_1456659 (CHEMBL3370259) Agonist activity at human GABAAalpha3beta2gamma2S receptor expressed in tsA-201cells by FLIPR membrane potential blue assay ChEMBL_494699 (CHEMBL938658) Displacement of [3H]MLA from rat alpha-7 nAChR/mouse 5HT3A chimera expressed in human tsA-201 cells ChEMBL_143234 (CHEMBL752377) Binding affinity against nicotinic acetylcholine receptor alpha2-beta4 using [3H]epibatidine as radioligand expressed in HEK293 cells or tsA cells ChEMBL_143411 (CHEMBL750054) Binding affinity against nicotinic acetylcholine receptor alpha3-beta4 using [3H]epibatidine as radioligand expressed in HEK293 cells or tsA cells ChEMBL_143881 (CHEMBL751864) Binding affinity against nicotinic acetylcholine receptor alpha4-beta2 using [3H]epibatidine as radioligand expressed in HEK293 cells or tsA cells ChEMBL_144019 (CHEMBL750434) Binding affinity against nicotinic acetylcholine receptor alpha4-beta4 using [3H]epibatidine as radioligand expressed in HEK293 cells or tsA cells ChEBML_1693686 Inhibition of human Cav3.2 alpha1H expressed in HEK tsA-201 cells at holding potential of -110 mV by whole cell patch clamp method ChEMBL_1673553 (CHEMBL4023582) Displacement of [3H]-Diprenorphine from human mu opioid receptor expressed in HEK293-TSA cell membranes after 4 hrs by scintillation counting method ChEMBL_1645342 (CHEMBL3994271) Inhibition of GFP-fused Cav3.2-alpha1 (unknown origin) expressed in human tsA-201 cells at holding potential of -110 mV by whole cell patch clamp method ChEMBL_936603 (CHEMBL2318766) Displacement of [3H]MLA from rat nAChR alpha7 linked to ion channel portion of 5-HT3A receptor expressed in human tsA-201 cells after 2.5 hrs by scintillation counting analysis Thermal Shift Assay (TSA) The thermal shift assay (TSA) measurements were performed in a Corbett Rotor-Gene 6000 (QIAGEN Rotor-Gene Q, Sydney, Australia) instrument using the blue channel (excitation 365±20, detection 460±15 nm). Samples contained 10 μM protein, 0-200 μM compound, 50 mM solvatochromic dye ANS (8-anilino-1-naphthalene sulfonate) and 50mM phosphate buffer containing 100 mM NaCl at pH 7.0, with the final DMSO concentration at 2%. The applied heating rate was 1 °C/min. Data analysis was performed as previously described [Kazlauska et al., PLoS ONE, 7:e36899]. Thermal Shift Assay (TSA) In a typical TSA, 0.4 μg of BRD4 BD1 protein were mixed with 5× Sypro Orange (Molecular Probe) and adjusted to a final volume of 5 μl with 100 mM HEPES buffer, pH 7.5 (Applichem), and 150 mM NaCl (Sigma). For binding experiments, 1% DMSO (Sigma) or JQ1 in serial dilution (0.14 μM to 100 μM, 3-fold) was added to the mixture. To protect samples from evaporation, they were overlaid with 1 μl of silicone oil DC200 (Sigma). Melting curves were recorded using a ThermoFluor system (Johnson and Johnson Pharmaceutical Research and Development) after heating the samples from 25 up to 95 °C while measuring the fluorescence intensity of the dye with the excitation and emission filters set to 465 and 590 nm, respectively. Enzymatic activity assay HDAC proteins of different subtypes (purchased from BPS), test compounds, and substrate solutions at concentrations of 2.5-40 M (purchased from BPS) were each added to a 384-well plate, and the plate was incubated at 37° C. for 30 min. 1 M Trypsin and 10 M TSA were added, and the plate was incubated at room temperature for 15 min. The fluorescence intensity at an excitation wavelength of 360 nm and an emission wavelength of 455 nm was measured, and then the inhibition rate at each concentration was calculated. IC50 was obtained by fitting using GraphPadPrism 7.0 software. In vitro HDAC8 Assay Briefly, the HDAC8 enzyme was diluted 20 times. Then, 10 μL of HDAC8 solution was mixed with compounds at various concentrations (50 μL). Then, 40 μL of the substrate [Boc-Lys-(acetyl)-AMC, 300 μm] was added, and the mixture was incubated at 37 °C for 30 min. Subsequently, the reaction was stopped by the addition of 100 μL of developer containing trypsin (10 μg/mL) and TSA (2 μm). Fluorescence intensity was measured by a microplate reader at excitation and emission wavelengths of 390 and 460 nm, respectively. In vitro HDACs Inhibition Fluorescence Assay In brief, 10 μL of HeLa nuclear extract was mixed with various concentrations of target compounds (50 μL), SAHA, using 100% and none HDACs groups as control group, and the mixture. After incubation at 37 °C for 10 min, fluorogenic substrate Boc-Lys (acetyl)-AMC (40 μL) was added and then the mixture was incubated at 37 °C for 30 min. The mixture was stopped by addition of 100 μL of developer containing trypsin and TSA afterward. Over the next incubation at 37 °C for 20 min, fluorescence intensity was measured using a microplate reader at excitation and emission wavelengths of 390 and 460 nm, respectively. In vitro HDACs Inhibition Fluorescence Assay Bos-Lys (acetyl)-4-amino-7-methylcoumarin substrate was used in inhibition assays against class I (HDAC1, HDAC2, HDAC3) and class IIb (HDAC6), while Boc-Lys (trifluoroacetyl)-4-amino-7-methylcoumarin substrate for class IIa (MDA-MB-231 cell lysate). 10 µL of enzyme solution was mixed with various concentrations of tested compounds (50 µL). Five minutes later, 40 µL of fluorogenic substrate was added. The mixture was incubated at 37°C for 30 minutes, stopped by addition of 100 µL of developer containing trypsin and TSA, and then incubated again at 37°C for 20 min. Fluorescence intensity was measure using a microplate reader at excitation and emission wavelengths of 390 and 460 nm, respectively. Enzymatic Assay HDAC5 reagents: N-terminal GST tagged HDAC5 was purchased from BPS Bioscience [catalog #50045]. Assays were performed with buffer containing 20 mM HEPES, pH 8.0 [Boston BioProducts, catalog #BB-104, 1M stock], 137 mM NaCl [Sigma, catalog #S5150, 5M stock], 2.7 mM KCl [BioChemika, catalog #87526, 4M stock], 1 mM MgCl2 [Fluka, catalog #63020, 1M stock], and 0.05% BSA (Fraction V) [Invitrogen, catalog #15260, 7.5% stock]. The HDAC5 enzyme was run at the final concentration of 0.447 nM. Boc-Lys(TFA)-AMC substrate [Bachem, catalog #1-1985.0050], used to evaluate enzyme activity, was added at the final concentration of 60 uM. To enable detection of the signal, Developer II [BioMol Research Laboratories, catalog #KI-176] was added at a 1:200 dilution to the stop solution, which also included 20 uM trichostatin A (TSA) [Sigma, catalog #T8552] to ensure complete termination of the reaction. In vitro HDACs Inhibition Fluorescence Assay In brief, 10 μL of enzyme solution (HeLa nuclear extracts, HDAC1, HDAC4, HDAC6, HDAC8, HDAC11) was mixed with various concentrations of target compounds (50 μL), SAHA, and PXD101, using 100% and none HDACs groups as control group. Afterincubation at 37 °C for 10 min, 40 μL of fluorogenic substrate (Boc-Lys(Ac)-AMC for HeLa nuclear extracts; Ac-Leu- GlyLyS(Ac)-AMC for HDAC1, HDAC6, and HDAC11; Ac-Leu-GlyLyS(Tfa)-AMC for HDAC4 and HDAC8) was added, and then, the mixture was incubated at 37 °C for 30 min. The mixture was stopped by addition of 100 μL of developer containing trypsin and TSA afterward. Over the next incubation at 37 °C for 20 min, fluorescence intensity was measured using a microplate reader at excitation and emission wavelengths of 390 and 460 nm, respectively. Inhibition Assay Key enzyme kinetic parameters for one class I HDAC (HDAC8) and one class Ha HDAC (HDAC4) were determined using commercially available human recombinant HDAC enzymes (BPS Bioscience, San Diego, Calif.) and fluorogenic HDAC assay kits (BPS Bioscience). Kinetic parameters were determined by performing HDAC activity assays at varied concentrations of the HDAC substrate according to the manufacturer's protocol. Assay data were analyzed via non-linear regression (GraphPad Software, Inc., CA). Inhibition assays were used to determine the half maximal inhibitory concentration, IC50, for tropolone analogs in HDAC8 and HDAC6. The potent hydroxamic acid HDAC inhibitor, Trichostatin A (TSA), provided in the assay kit, served as a control for the assays. IC50 values for the tropolone analogs were converted to inhibition constants, Ki, for each of the inhibitors using the KM value in accordance with the techniques previously described by Cheng and Prusoff. Fluorescent Activity Assay In vitro HDAC assays were performed using a HDAC fluorescent activity assay kit (Biomol, UK) according to the manufacturer's instructions. Compounds were reduced prior to analysis; 1 mM compound was reduced with 30 mM DTT in DMSO overnight at room temperature, protected from light. Reactions were then set up in a 96-well plate. For each reaction 10 ul compound (5x required concentration in assay buffer) was mixed with 15 ml diluted HeIa Nuclear Extract (30-fold in assay buffer). Serial dilutions were set up for each compound. Reactions containing HeIa extract only and assay buffer only were also set up. 25 ul diluted Fluor de Lys substrate (100-fold in assay buffer) was added to each reaction, which were then incubated at 37C for 1 hour. The reaction was stopped by addition of 50 ul Fluor de Lys Developer (20-fold dilution in assay buffer, plus TSA diluted 100-fold). The reactions were then incubated at room temperature for 10 minutes before fluorescence was measured. HDAC Fluorescent Assays Activity against HDACs 1 to 11 was assessed by using an acetylated 7-amino-4-methylcoumarin (AMC)-labeled peptide substrate. A substrate based on residues 379–382 of p53 (Arg-His-Lys-Lys(Ac)) was used for assaying the activity of HDAC1, HDAC2, HDAC3, HDAC6, HDAC10 and HDAC11. For HDAC8, the diacetylated peptide substrate, based on residues 379–382 of p53 (Arg-His-Lys(Ac)- Lys(Ac)), was used. HDAC4, HDAC5, HDAC7 and HDAC9 assays used the class IIa HDAC–specific fluorogenic substrate (Boc-Lys(trifluoroacetyl)-AMC). The HDACs 1– 11 were purchased from BPS Bioscience Inc. (San Diego, California). All reactions were conducted with a HDAC substrate at 50 μM in assay buffer (50 mM Tris-HCl, pH 8.0, 137 mM NaCl, 2.7 mM KCl, 1 mM MgCl2, 1 mg/mL BSA) containing 1% DMSO final concentration. In this assay, a HDAC substrate was deacetylated by the HDAC. Trichostatin A (TSA) was then added to stop the HDAC activity, and the reaction was developed by the addition of trypsin In Vitro Assay In vitro HDAC assays were performed using a HDAC fluorescent activity assay kit (Biomol, UK) according to the manufacturer's instructions. Compounds were reduced prior to analysis; 1 mM compound was reduced with 30 mM DTT in DMSO overnight at room temperature, protected from light. Reactions were then set up in a 96-well plate. For each reaction 10 μl compound (5x required concentration in assay buffer) was mixed with 15 ml diluted HeIa Nuclear Extract (30-fold in assay buffer). 25 μl diluted Fluor de Lys substrate (100-fold in assay buffer) was added to each reaction, which were then incubated at 37 C for 1 hour. The reaction was stopped by addition of 50 μl Fluor de Lys Developer (20-fold dilution in assay buffer, plus TSA diluted 100-fold). The reactions were then incubated at room temperature for 10 minutes before fluorescence was measured using a CytoFluor Il Fluorescence Multiwell Plate Reader and CytoFluor Il software with filters set at 360 nM for excitation and 460 nM for emission. HDAC1 & HDAC3 Inhibition Assay IC50 determination for HDAC1 and HDAC3—Prior to adding reagents, 50 nL/well of compound were added to Proxiplates using an Echo dispenser instrument (Beckman Coulter, CA, US). After addition of compound, 2.5 μL/well of 2× enzyme solution was added and the enzyme was pre-incubated with compound for 3 hours at room temp. (˜22° C.). After the pre-incubation period, the enzyme reaction was initiated by adding 2.5 μL/well of 2× Fluor de Lys® substrate solution. The assay reaction was stopped after one hour by adding 5 μl/well of a 0.66× Developer solution containing TSA (3.2 μM). The final product of the enzyme reaction was read using a Spectramax plate reader instrument (Molecular Devices, CA, US) using a fluorescent readout (Ex 360 nm/Em 460 nm). The final enzyme concentrations in the assay buffer for HDAC1 and 3 were 6 and 1.2 nM, respectively. The final Fluor de Lys® substrate concentration in the assay buffer was 16 μM for all HDAC enzymes. IC50 values were determined using the following equation:EfreeEo=100(1-11+(1IC50)n)(1)Where Efree and Eo are the free and total amount of HDAC enzyme in the reaction mixture, n is the hill coefficient, I is the free inhibitor concentration, and IC50 is the measure of the potency equivalent to the inhibitor concentration that leads to a 50% occupancy of the total enzyme. Each data was generated in duplicate. AlphaLISA Inhibition Screening Assay The Kat6a inhibitory activity of test compounds was determined using an Alpha Screen-based detection method. The assay reactions were conducted in a volume of 10 μL in Alpha Plate, White 384 well plate (cat #6008280, Perkin Elmer). The enzymatic reactions were performed in assay buffer pH 8.0 (50 mM Tris-HCl, 0.1 mM EDTA, 0.01% Tween-20, 1 mM Dithiothreitol, 0.1% BSA (fatty acid free) and 330 nM TSA (Trichostatin A)). 10 μL reaction volume consisting of 25 nM of Recombinant KAT6A/MOZ (488-778) protein (Active motif, Catalog #81223), 400 nM Acetyl coenzyme A (Catalog #A2056, Sigma), 200 nM of Histone H3 peptide [(amino acids 1-21), biotin-labeled (BPS Biosciences, Catalog #52011)]. Test compounds were screened at different doses starting with 10 μM, 3 fold dilution and 10 point Dose response curve. Enzyme and compounds solution were pre-incubated in assay plate for 60 or 10 min at room temperature then substrate and Acetyl coenzyme A solution were added to the plate. After addition, the plate was sealed with adhesive seals and incubated for 120 minutes at room temperature.After 120 minutes of incubation, 5 L (10 g/mL) of AlphaLISA anti-acetyl-Lysine acceptor beads (Perkin Elmer, Catalog #AL143C) were added to the plate and it was incubated for 60 minutes at room temperature. Then 10 L (10 g/mL) of Alpha Streptavidin donor beads (Perkin Elmer, Catalog #6760002S) were added to the plate which was further incubated for 60 minutes at room temperature. After incubation, the alpha signal was recorded by using Perkin Elmer Envision multi-mode reader. Caliper Endpoint Assay for HDAC Enzymatic Activity Assay HDAC reactions were assembled in 384 well plates (Greiner) in a total volume of 20 μL as follows: HDAC proteins (and their regulatory subunit, if applicable) were pre-diluted in the assay buffer comprising: 100 mM HEPES, pH 7.5, 0.1% BSA, 0.01% Triton X-100, 25 mM KCl and dispensed into a 384 well plate (10 μL per well). Test compounds were serially pre-diluted in 100% DMSO using 3-fold dilution steps and added to the protein samples by acoustic dispensing (Labcyte Echo). Concentration of DMSO was equalized to 1% in all samples. Final compound concentration in assays typically ranged from 100 μM to 0.00056 μM for a 12-point concentration-response format. Reference compounds such as TSA (trichostatin A) and MS-275, were tested in an identical manner.Control samples (0%-inhibition in the absence of inhibitor, DMSO only) and 100%-inhibition (in the absence of enzyme) were assembled in replicates of four (for each caliper sipper) and used to calculate the %-inhibition in the presence of compounds. At this step compounds were pre-incubated with enzyme for 30 minutes at room temperature (20-23° C.). The reactions were initiated by addition of 10 μL of the FAM-labeled substrate peptide (see table above) pre-diluted in the same assay buffer. Final concentration of substrate peptide was 1 μM. The reactions were allowed to proceed at room temperature (20-23° C.). Typical incubation times for each HDAC, based on pre-determined enzyme progress curves, vary and are listed in table above.Following incubation, the reactions were quenched by addition of 50 μL of termination buffer (100 mM HEPES, pH7.5, 0.01% Triton X-100, 0.05% SDS). Terminated plates were analyzed on a microfluidic electrophoresis instrument (Caliper LabChip® 3000, Caliper Life Sciences/Perkin Elmer) which enables electrophoretic separation of deacetylated product from acetylated substrate. A change in the relative intensity of the peptide substrate and product is the parameter measured. Enzymatic Activity Assay For each test compound, 100× concentrated DMSO solutions at 8 doses were prepared and then diluted in assay buffer (25 mM Tris-HCl, pH 8, 130 mM NaCl, 0.05% Tween-20, 10% Glycerol) to obtain 5× concentrated solutions in relation to the final concentrations (typical final concentration range 6.4-200000 nM or 0.18-50000 nM, final DMSO content 1%). Then 10 μL solution of each test compound concentration were placed on a 96-well plate in triplicate and 15 μL of 3.33× concentrated enzyme solution in the assay buffer containing 3.33× concentrated BSA (final BSA concentration 2 mg/mL for HDAC4, HDAC5 and HDAC9 or 1 mg/mL for other isoforms) and in the case of HDAC6-3.33× concentrated TCEP (final TCEP concentration 200 μM) were added to each well. After a period of preincubation (incubation times and temperatures vary for different isoforms and are shown in table 1) 25 μL of solution containing the substrate were added. As substrate, FLUOR DE LYS deacetylase substrate (Enzo Life Sciences, cat: BML-KI104, FdL), FLUOR DE LYS -Green substrate (Enzo Life Sciences, cat: BML-KI572, FdL_G) or Boc-Lys(Tfa)-AMC (Bachem, cat: 4060676.005, Tfal) 2× concentrated solution in assay buffer were used. Following a reaction period (reaction times and temperatures vary for different isoforms and are reported in Table 1), 50 μL of the development solution consisting of concentrate FLUOR DE LYS developer I (Enzo Life Sciences, ca: BML-KI105), diluted 200 times in buffer (50 mM Tris-HCl, pH 8, 137 mM NaCl, 2.7 mM KCl, 1 mM MgCl2) plus 2 μM TSA was added and, after 25 minutes at room temperature in the dark, using the Victor 1420 Multilabel Counter Perkin Elmer Wallac instrument, the fluorescence reading was carried out. Enzymatic activity on recombinant human HDAC6 and HDAC1 was evaluated (Table 2) for each synthesized compound. All compounds tested resulted virtually inactive (IC50 > 30 μM) on HDAC1. Histone Deacetylase Assay The inhibitory activities of compounds of present invention were determined using biochemical HDAC assays (Reaction Biology Corp. biochemical assay services). Compound with indicated doses was tested in the biochemical assays of HDAC 1, HDAC2, HDAC3, HDAC4, HDAC5, HDAC6, HDAC7, HDAC 8, HDAC9, HDAC10, and HDAC11 enzyme.Compounds were tested in singlicate 10-dose IC50 mode with 3-fold serial dilution starting at 10 μM against 11 HDACs. HDAC reference compounds Trichostatin A (TSA) and TMP269 were tested in a 10-dose IC50 with 3-fold serial dilution starting at 10 μM.Substrate for HDAC1,2,3,6,10: Fluorogenic peptide from p53 residues 379-382 (RHKK(Ac)AMC). Substrate for HDAC4,5,7,9, and 11: Fluorogenic HDAC Class2a Substrate (Trifluoroacetyl Lysine). Substrate for HDAC 8: Fluorogenic peptide from p53 residues 379-382 (RHK(Ac)K(Ac)AMC).General Reaction Procedure: (Standard IC50 determination) a. 2× enzyme was added to wells of reaction plate except to No Enzyme (No En) control wells. Add buffer in No En wells. b. Compounds to be tested in 100% DMSO were added to the enzyme mixture by Acoustic technology (Echo550; nanoliter range). The mixture was spinned down and preincubated. c. 2× Substrate Mixture (Fluorogenic HDAC Substrate and co-factor (500 μM of Nicotinamide adenine dinucleotide (NAD<+>) in all Sirt assay) were added to all reaction wells to initiate the reaction. The plates were spinned and shaken. d. The plates were incubated for 1-2 hr. at 30° C. with seal. e. Developer with Trichostatin A (or TMP269 or NAD<+>) was added to stop the reaction and to generate fluorescent color. f. Fluorescence was read (excitatory, 360; emission, 460) using the EnVision Multilabel Plate Reader (Perkin Elmer) g. Endpoint reading was taken for analysis after the development reaches plateau.Data Analysis: The percentages of enzyme activity (relative to DMSO controls) and IC50 values were calculated using the GraphPad Prism 4 program based on a sigmoidal dose-response equation. The blank (DMSO) value was entered as 1.00E-12 of concentration for curve fitting.
 US9956192, Compound TSA US9751832, TSA US10227295, Compound TSA US11207431, TSA BDBM337661
 TSA BDBM198120
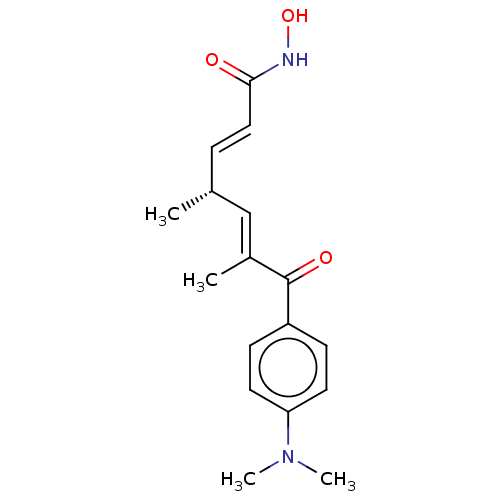 BDBM197336 R-TSA
 BDBM197337 S-TSA
 US9956192, Compound TSA BDBM390441
 (2E,4E,6R)-7-[4-(dimethylamino)phenyl]-N-hydroxy-4,6-dimethyl-7-oxohepta-2,4-dienamide TSA Trichostatin A (TSA) BDBM19130 CHEMBL99
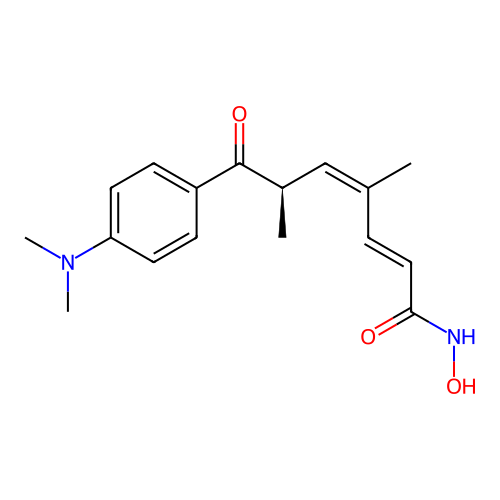 US20250250263, Compound trichostatin BDBM747161 US20250179065, Compound TSA (trichostatin A)
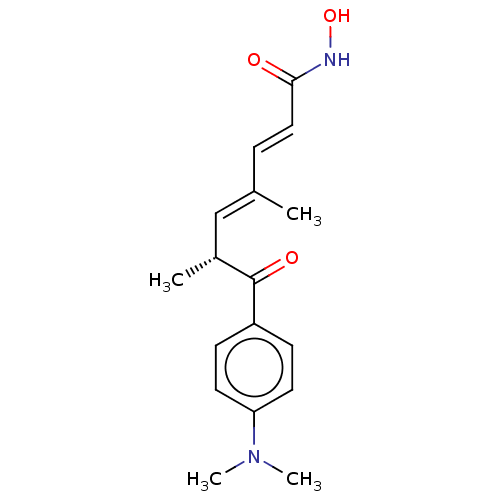 US10011611, Trichostatin A GNF-Pf-1011 CHEBI:46024 Trichostatin A (TSA) US20230322747, Compound trichostatin A BDBM50005711 Trichostatin A US9265734, TSA US11535598, Compound Trichostatin A US10722597, Compound Trichostatin TRICHOSTATIN