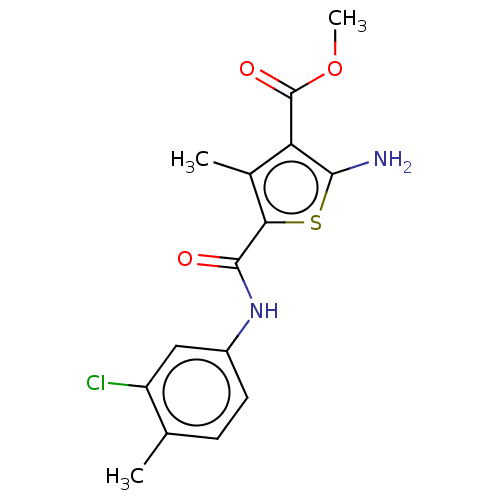
 Methyl 2amino5[(3chloro4methylphenyl)carbamoyl]4methylthiophene3carboxylate (Inh 7) US9334288, 3 BDBM163642
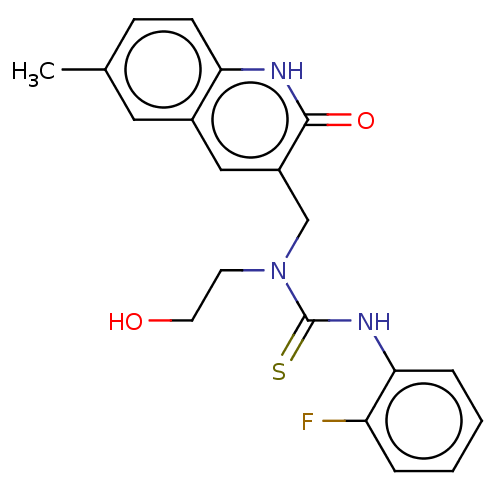 BDBM163638 1(2Fluorophenyl)3(2hydroxyethyl)3[(6methyl2oxo1,2dihydroquinolin3yl)methyl]thiourea (Inh 3)
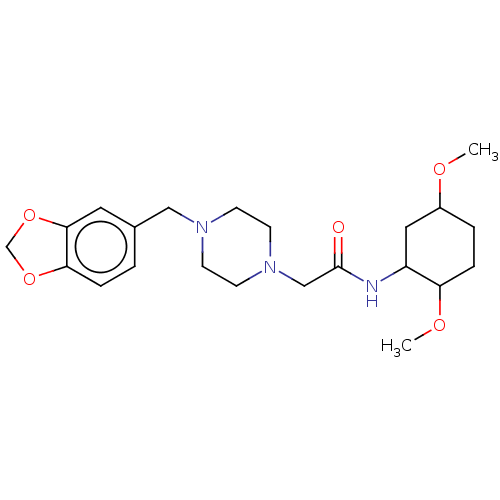 2[4(2H1,3benzodioxol5ylmethyl)piperazin1yl]N(2,5dimethoxycyclohexyl)acetamide (Inh 8) US9334288, 8 BDBM163643
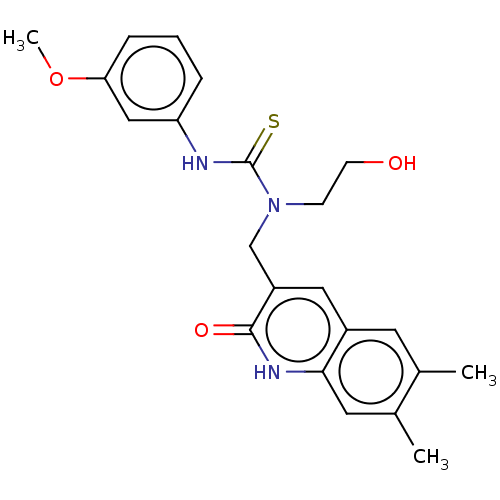 3[(6,7Dimethyl2oxo1,2dihydroquinolin3yl)methyl]3(2hydroxyethyl)1(3 methoxyphenyl)thiourea (Inh 2) BDBM163637 US9334288, 4
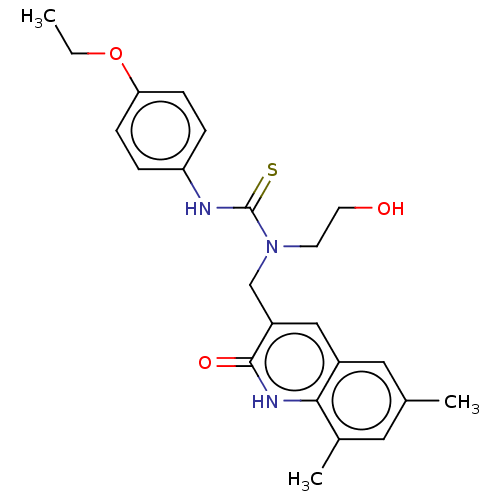 BDBM163636 US9334288, 1 3[(6,8Dimethyl2oxo1,2dihydroquinolin3 yl)methyl]1(4ethoxyphenyl)3(2hydroxyethyl)thiourea (Inh 1)
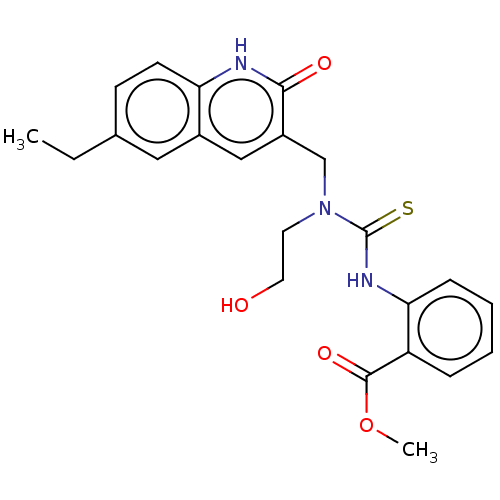 Methyl 2({[(6ethyl2oxo1,2dihydroquinolin3yl)methyl](2 hydroxyethyl)carbamothioyl}amino)benzoate (Inh 4) BDBM163639 US9334288, 6
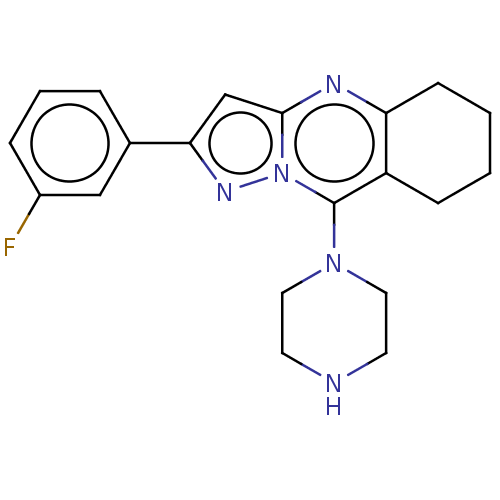 1[2(3Fluorophenyl)5H,6H,7H,8Hpyrazolo[3,2b]quinazolin9yl]piperazine (Inh 6) US9334288, 7 BDBM163641
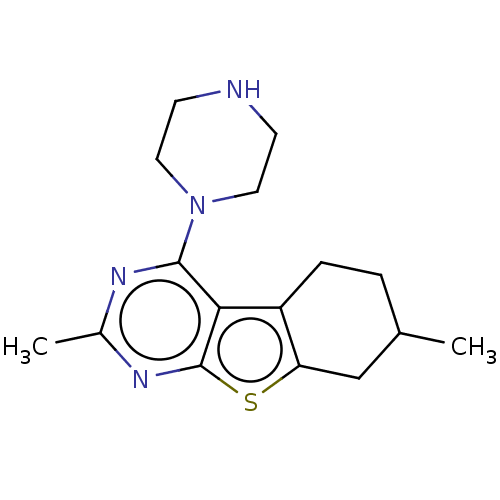 5,11Dimethyl3(piperazin1yl)8thia4,6diazatricyclo[7.4.0.0 ,⁷]trideca1(9),2(7),3,5tetraene (Inh 5) US9334288, 5 BDBM163640
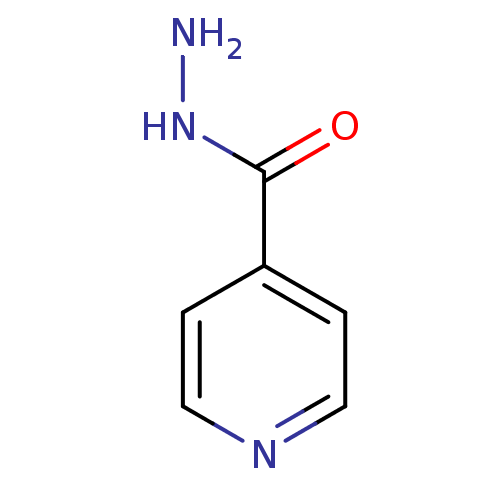 INH isoniazid Laniazid BDBM50336507 4-pyridinecarbohydrazide(Isoniazid) Isonicotinylhydrazine isonicotinamide Nydrazid isonicotinohydrazide Stanozide Rimifon Dow-isoniazid Isoniazid (INH) pyridine-4-carbohydrazide isonicotinhydrazide ISONICOTINIC ACID HYDRAZIDE(ISONIAZIDE) Isonicotinic acid hydrazide(Isoniazid) isonicotinyl hydrazide Hyzyd Isonicotinic acid hydrazide (Isoniazid) CHEMBL64
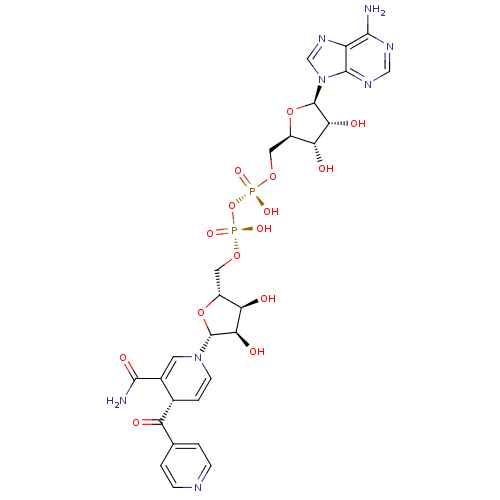 [({[(2R,3S,4R,5R)-5-(6-amino-9H-purin-9-yl)-3,4-dihydroxyoxolan-2-yl]methoxy}(hydroxy)phosphoryl)oxy]({[(2R,3S,4R,5R)-5-[(4S)-3-carbamoyl-4-(pyridin-4-ylcarbonyl)-1,4-dihydropyridin-1-yl]-3,4-dihydroxyoxolan-2-yl]methoxy})phosphinic acid BDBM16300 [[(2R,3S,4R,5R)-5-(6-aminopurin-9-yl)-3,4-dihydroxy-oxolan-2-yl]methoxy-hydroxy-phosphoryl]oxy-[[(2R,3S,4R,5R)-5-[(4S)-3-carbamoyl-4-(pyridine-4-carbonyl)-4H-pyridin-1-yl]-3,4-dihydroxy-oxolan-2-yl]methoxy]phosphinic acid INH-NAD Adduct ISONICOTINIC-ACETYL-NICOTINAMIDE-ADENINE DINUCLEOTIDE
- MO, C; Xu, X MNK INHIBITORS US Patent US20240092799 (2024)
- Jin, X; Yu, R; Wang, X; Proud, CG; Jiang, T Progress in developing MNK inhibitors. Eur J Med Chem 219: (2021)
- Reich, SH; Sprengeler, PA; Webber, SE; Xiang, AX; Ernst, JT MNK inhibitors and methods related thereto US Patent US9669031 (2017)
- Xu, W; Kannan, S; Verma, CS; Nacro, K Update on the Development of MNK Inhibitors as Therapeutic Agents. J Med Chem 65: 983-1007 (2022)
- Fernandez, A; Monsen, PJ; Platanias, LC; Schiltz, GE Medicinal chemistry approaches to target the MNK-eIF4E axis in cancer. RSC Med Chem 14: 1060-1087 (2023)
- Sprengeler, PA; Reich, SH; Webber, SE; Ernst, JT Heterocyclic compounds that inhibit the kinase activity of Mnk useful for treating various cancers US Patent US10000487 (2018)
- MNK, mTOR or eIF4E-selecting the best anti-tumor target for blocking translation initiation.
- Discovery of D25, a Potent and Selective MNK Inhibitor for Sepsis-Associated Acute Spleen Injury.
- Teo, T; Yang, Y; Yu, M; Basnet, SK; Gillam, T; Hou, J; Schmid, RM; Kumarasiri, M; Diab, S; Albrecht, H; Sykes, MJ; Wang, S An integrated approach for discovery of highly potent and selective Mnk inhibitors: Screening, synthesis and SAR analysis. Eur J Med Chem 103: 539-50 (2015)
- Abdelaziz, AM; Basnet, SKC; Islam, S; Li, M; Tadesse, S; Albrecht, H; Gerber, C; Yu, M; Wang, S Synthesis and evaluation of 2'H-spiro[cyclohexane-1,3'-imidazo[1,5-a]pyridine]-1',5'-dione derivatives as Mnk inhibitors. Bioorg Med Chem Lett 29: 2650-2654 (2019)
- Cherian, J; Nacro, K; Poh, ZY; Guo, S; Jeyaraj, DA; Wong, YX; Ho, M; Yang, HY; Joy, JK; Kwek, ZP; Liu, B; Wee, JL; Ong, EH; Choong, ML; Poulsen, A; Lee, MA; Pendharkar, V; Ding, LJ; Manoharan, V; Chew, YS; Sangthongpitag, K; Lim, S; Ong, ST; Hill, J; Keller, TH Structure-Activity Relationship Studies of Mitogen Activated Protein Kinase Interacting Kinase (MNK) 1 and 2 and BCR-ABL1 Inhibitors Targeting Chronic Myeloid Leukemic Cells. J Med Chem 59: 3063-78 (2016)
- Yu, M; Li, P; Basnet, SK; Kumarasiri, M; Diab, S; Teo, T; Albrecht, H; Wang, S Discovery of 4-(dihydropyridinon-3-yl)amino-5-methylthieno[2,3-d]pyrimidine derivatives as potent Mnk inhibitors: synthesis, structure-activity relationship analysis and biological evaluation. Eur J Med Chem 95: 116-26 (2015)
- ChEMBL_2184596 (CHEMBL5096678) Inhibition of Inh (unknown origin)
- MymA Inhibition Assay Inhibition of MymA activity by INH was checked using different concentrations (0-12 um) of INH, 100 um of trimeth- ylamine and 5 mg of MymA along with the other components in the enzyme assay as described above.
- ChEMBL_1868728 (CHEMBL4369794) Binding affinity to His-tagged human MNK expressed in Escherichia coli BL21(DE3) in presence of ATP by 9F-NMR spectroscopy analysis
- Biochemical Enzymatic Assay Compounds are screened for MNK inhibition using the ADP-Glo kinase assay kit (Promega, catalogue No. V9101). All kinase reactions are performed in Reaction Buffer E (15 mM HEPES pH7.4, 20 mM NaCl, 1 mM EGTA, 10 mM MgCl2, 0.1 mg/ml BGG, and 0.02% Tween-20). Final MNK 1 reactions contained 10 nM recombinant MNK1 (Life Technologies, PR9138A), 100 μM MNK substrate peptide Ac-TATKSGSTTKNR-NH2 (American Peptide Company), 300 μM ATP, and varying concentrations of the inhibitory compound of interest. Final MNK2 reactions contained 3 nM recombinant MNK2 (Life Technologies, PV5607), 50 μM MNK substrate peptide Ac-TATKSGSTTKNR-NH2 (American Peptide Company), 10 μM ATP, and varying concentrations of the inhibitory compound of interest. Final DMSO concentration in each reaction is 1%.
- MNK Biochemical Enzymatic Assay Compounds are screened for MNK inhibition using the ADP-Glo kinase assay kit (Promega, catalogue No. V9101). All kinase reactions are performed in Reaction Buffer E (15 mM HEPES pH7.4, 20 mM NaCl, 1 mM EGTA, 10 mM MgCl2, 0.1 mg/ml BGG, and 0.02% Tween-20). Final MNK1 reactions contained 10 nM recombinant MNK1 (Life Technologies, PR9138A), 100 μM MNK substrate peptide Ac-TATKSGSTTKNR-NH2 (amino acid sequence shown SEQ ID NO: 1) (American Peptide Company), 300 μM ATP, and varying concentrations of the inhibitory compound of interest. Final MNK2 reactions contained 3 nM recombinant MNK2 (Life Technologies, PV5607), 50 μM MNK substrate peptide Ac-TATKSGSTTKNR-NH2 (amino acid sequence shown SEQ ID NO: 1) (American Peptide Company), 10 μM ATP, and varying concentrations of the inhibitory compound of interest. Final DMSO concentration in each reaction is 1%.Kinase reactions are carried out in 96-well half-area white flat-bottom polystyrene plates in a final volume of 25 μl. MNK1/2 enzymes are pre-incubated with compound and peptide substrate for 5 minutes prior to the addition of ATP. After the addition of ATP, kinase reactions are incubated at room temperature for 40 minutes. Reactions are subsequently stopped by the addition of 25 μl of ADP-Glo Reagent and incubating for an additional 40 minutes. The final luminescent signal used for kinase activity readout is produced by the addition of 45 μl of Kinase Detection Reagent (ADP-Glo kit, Promega) and incubating for 40 minutes. The luminescent signal is detected using a Victor 2 multilabel counter (Perkin Elmer) and the concentration of compound necessary to achieve inhibition of enzyme activity by 50% (IC50) is calculated using signals from an 8-point compound dilution series.
- Mnk Biochemical Enzymatic Assay Compounds are screened for Mnk inhibition using the ADP-Glo kinase assay kit (Promega, catalogue No. V9101). All kinase reactions are performed in Reaction Buffer E (15 mM HEPES pH7.4, 20 mM NaCl, 1 mM EGTA, 10 mM MgCl2, 0.1 mg/ml BGG, and 0.02% Tween-20). Final Mnk1 reactions contained 10 nM recombinant Mnk1 (Life Technologies, PR9138A), 100 μM Mnk substrate peptide Ac-TATKSGSTTKNR-NH2 (American Peptide Company), 300 μM ATP, and varying concentrations of the inhibitory compound of interest. Final Mnk2 reactions contained 3 nM recombinant Mnk2 (Life Technologies, PV5607), 50 μM Mnk substrate peptide Ac-TATKSGSTTKNR-NH2 (American Peptide Company), 10 μM ATP, and varying concentrations of the inhibitory compound of interest. Final DMSO concentration in each reaction is 1%. Kinase reactions are carried out in 96-well half-area white flat-bottom polystyrene plates in a final volume of 25 μl. Mnk1/2 enzymes are pre-incubated with compound and peptide substrate for 5 minutes prior to the addition of ATP. After the addition of ATP, kinase reactions are incubated at room temperature for 40 minutes. Reactions are subsequently stopped by the addition of 25 μl of ADP-Glo Reagent and incubating for an additional 40 minutes. The final luminescent signal used for kinase activity readout is produced by the addition of 45 μl of Kinase Detection Reagent (ADP-Glo kit, Promega) and incubating for 40 minutes. The luminescent signal is detected using a Victor 2 multilabel counter (Perkin Elmer) and the concentration of compound necessary to achieve inhibition of enzyme activity by 50% (IC50) is calculated using signals from an 8-point compound dilution series.
- Counterscreen for exosite inhibitors of ADAM17: Fluorescence resonance energy transfer (FRET)-based biochemical high throughput dose response assay to identify inhibitors of ADAM10 Source (MLPCN Center Name): The Scripps Research Institute Molecular Screening Center (SRIMSC) Center Affiliation: Torrey Pines Institute for Molecular Sciences (TPIMS) Assay Provider: Dmitriy Minond, Torrey Pines Institute for Molecular Sciences (TPIMS) Network: Molecular Libraries Probe Production Centers Network (MLPCN) Grant Proposal Number: 1 R03 DA033985-01 Grant Proposal PI: Dmitriy Minond, Torrey Pines Institute for Molecular Sciences (TPIMS) External Assay ID: ADAM10_INH_QFRET_1536_3XIC50 INH DCSRUN for ADAM17 INH Name: Counterscreen for exosite inhibitors of ADAM17: Fluorescence resonance energy transfer (FRET)-based biochemical high throughput dose response assay to identify inhibitors of ADAM10. Description: Approximately 20-30% of breast cancer patients have tumors that over-express human epidermal growth factor receptor (HER2), which confers an aggressive tumor phenotype and poor prognosis [1-3]. A Disintegrin and Metalloprotease (ADAM) proteases are responsible for a
- Biochemical Enzymatic Assay Compounds are screened for MNK inhibition using the ADP-Glo kinase assay kit (Promega, catalogue No. V9101). All kinase reactions are performed in Reaction Buffer E (15 mM HEPES pH7.4, 20 mM NaCl, 1 mM EGTA, 10 mM MgCl2, 0.1 mg/ml BGG, and 0.02% Tween-20). Final MNK1 reactions contained 10 nM recombinant MNK1 (Life Technologies, PR9138A), 100 μM MNK substrate peptide Ac-TATKSGSTTKNR-NH2 (American Peptide Company), 300 μM ATP, and varying concentrations of the inhibitory compound of interest. Final MNK2 reactions contained 3 nM recombinant MNK2 (Life Technologies, PV5607), 50 μM MNK substrate peptide Ac-TATKSGSTTKNR-NH2 (American Peptide Company), 10 μM ATP, and varying concentrations of the inhibitory compound of interest. Final DMSO concentration in each reaction is 1%.Kinase reactions are carried out in 96-well half-area white flat-bottom polystyrene plates in a final volume of 25 μl. MNK1/2 enzymes are pre-incubated with compound and peptide substrate for 5 minutes prior to the addition of ATP. After the addition of ATP, kinase reactions are incubated at room temperature for 40 minutes. Reactions are subsequently stopped by the addition of 25 μl of ADP-Glo Reagent and incubating for an additional 40 minutes. The final luminescent signal used for kinase activity readout is produced by the addition of 45 μl of Kinase Detection Reagent (ADP-Glo kit, Promega) and incubating for 40 minutes. The luminescent signal is detected using a Victor 2 multilabel counter (Perkin Elmer) and the concentration of compound necessary to achieve inhibition of enzyme activity by 50% (IC50) is calculated using signals from an 8-point compound dilution series.
- MNK Biochemical Enzymatic Assay This protocol establishes the binding assays for MNK1 and MNK2 using ADP-Glo assay. MNK phosphorylates the substrate and converts ATP to ADP, which was detected by Envision and used to reflect the reminding activity of MNK. Reagents and equipment used in the assay are listed below, followed by the protocol.Number Name Vendor Cat# 1 HEPES Life Technologies 15630-080 2 NaCl Sigma S5886-1Kg 3 MgCl2 Sigma M1028 4 BSA Sigma B2064-50G 5 Tween-20 Bio-RAD 170-6531 6 ADP-Glo Kinase Assay Promega V9101 7 MNK1 Carna 8 MNK2 Carna 9 ATP Promega V915B10 Substrate peptide NJ peptide 11 Topseal A PerkinElmer E534112 OptiPlate-384 PerkinElmer 600729013 Envision Perkin Elmer 210414 Centrifuge Eppendorf 5810R15 Echo 550 Liquid Handler Labcyte Echo 550a) Add 50 μL compound to 384-well dilution plateb) Dilute compound 1:3 in succession in DMSO for each column for 10+0 pts (refer to dilution plate map)c) Transfer 0.1 μL diluted compound solution in each row to 384 assay plate using Echo, each column containing 2 replicates (refer to assay plate map)d) Add 5 μL enzyme working solution to 384-well assay plate, centrifuge 1000 RPM for 1 mine) Incubate at 25 C. for 15 minf) Add 5 μL substrate working solution to initiate reactiong) Incubate at 25 C. for 60 minh) Add 10 μL ADP Glo reagent, centrifuge 1000 RPM for 1 mini) Incubate at 25 C. for 60 minj) Add 20 μL kinase detection reagent, centrifuge 1000 RPM for 1 mink) Incubate at 25 C. for 60 minl) Read on Envision for US LUM as RLUm) Data analysis: IC50s were determined based on a non-linear regression analysis of data collected.
- Biochemical Assay EZH2 biochemical assay (IC50): Compound potencies were assessed through incorporation of 3H-SAM into a biotinylated H3 peptide. Specifically, 30 pM PRC2 containing wt EZH2 (pentameric complex prepared in-house) was pre-incubated with 450 nM SAM, 450 nM 3H-SAM, 2 μM H3K27me3 activating peptide (H2N-RKQLATKAAR(Kme3)SAPATGGVKKP-amide) and compounds (as 10 point duplicate dose response titrations in DMSO, final assay 0.8% DMSO (v/v)) for 3-5 h in 50 mM Tris (pH 8.5), 1 mM DTT, 0.07 mM Brij-35, 0.1% BSA, and 0.8% DMSO in a total volume of 12.5 μl. Reaction was initiated with biotinylated H3 substrate peptide (H2N-RKQLATKAAR(Kmel)SAPATGGVKKP-NTPEGBiot) as a 2 μM stock in 12.5 μl of buffer and allowed to react at room temperature for 18-22 h. Quenching was accomplished by addition of 20 μl of STOP solution (50 mM Tris (pH 8.5), 200 mM EDTA, 2 mM SAH). 35 μl of the quenched solution was transferred to streptavidin coated FlashPlates (PerkinElmer), incubated 1-2 h, washed, and read in a TopCount Reader (PerkinElmer). IC50s were calculated in Genedata Screener using non-linear least square four parameter fits, where the four parameters were IC50, Hill slope, pre-transitional baseline (0% INH), and post-transitional baseline (100% INH).
- ZH2 biochemical assay (IC50) Compound potencies were assessed through incorporation of 3H-SAM into a biotinylated H3 peptide. Specifically, 30 pM PRC2 containing wt EZH2 (pentameric complex prepared in-house) was pre-incubated with 450 nM SAM, 450 nM 3H-SAM, 2 μM H3K27me3 activating peptide (H2N-RKQLATKAAR(Kme3)SAPATGGVKKP-amide) and compounds (as 10 point duplicate dose response titrations in DMSO, final assay 0.8% DMSO (v/v)) for 3-5 h in 50 mM Tris (pH 8.5), 1 mM DTT, 0.07 mM Brij-35, 0.1% BSA, and 0.8% DMSO in a total volume of 12.5 μl. Reaction was initiated with biotinylated H3 substrate peptide (H2N-RKQLATKAAR(Kme1)SAPATGGVKKP-NTPEGBiot) as a 2 μM stock in 12.5 μl of buffer and allowed to react at room temperature for 18-22 h. Quenching was accomplished by addition of 20 μl of STOP solution (50 mM Tris (pH 8.5), 200 mM EDTA, 2 mM SAH). 35 μl of the quenched solution was transferred to streptavidin coated FlashPlates (PerkinElmer), incubated 1-2 h, washed, and read in a TopCount Reader (PerkinElmer). IC50s were calculated in Genedata Screener using non-linear least square four parameter fits, where the four parameters were IC50, Hill slope, pre-transitional baseline (0% INH), and post-transitional baseline (100% INH).
- Evaluation of the inhibitory activity against PRMT5 enzyme activity A 1× enzyme reaction buffer (10 mM Tris 8.0 (Sigma, Cat. No. T2694-1L), 0.01% Tween-20 (Sigma, Cat. No. P2287-100ML), and 1 mM DTT (Sigma, Cat. No. D0632-10G)) was prepared. PRMT5 (Active Motif, Cat. No. 31921) and [3H]—SAM (PerkinElmer, Cat. No. NET155VO01MC) were added to the 1× enzyme reactionbuffer, to prepare a 25/15× mixed solution (PRMT5 final concentration: 5 nM, [3H]—SAM final concentration: 0.3 μM). 15 L of this solution was transferred into a 384-well microplate (Corning 384-well Polypropylene Storage Microplates, Cat. No. 3657) with various concentrations of the compounds (DMSO final concentration 1%), and incubated at room temperature for 60 minutes. A polypeptide substrate, GL-27 (Ac-SGRGKGGKGLGKGGAKRHRKVGG-K) (Biotin) (GL Biochem, Cat. No. 342095), was added into the 1× enzyme reaction buffer to prepare a 25/10× substrate solution. Then 10 μL of the polypeptide substrate solution (final concentration of the polypeptide substrate: 100 nM) was added, the reaction was performed at room temperature for 120 minutes, and then 5 μL 6× ice cold SAM (Sigma, Cat. No. A7007-100MG) solution was added to stop the reaction (SAM final concentration: 0.125 mM). 25 μL of the reaction system was transferred into a FlashPlate (Streptavidin FlashPlate HTS PLUS, High Capacity, 384-well, Perkin Elmer, Cat. No. SMP410A001PK), and incubated at room temperature for 1 hour. After washed three times with distilled water containing 0.1% Tween-20, the microplate was read on a MicroBeta reader for CPM data (Counts Per Minute). After the CPM original data of the compounds at various concentrations were obtained, the data were normalized according to Inh %=(Max−Sample)/(Max−Min)*100%, and the enzyme activity inhibition rate Inh % at each concentration point was obtained (wherein Max was the CPM value of a positive well with the enzyme, Min was the CPM value of a negative well without the enzyme, and Sample was the CPM value of the sample well treated with the compounds). Then the inhibition rate Inh % (Y) corresponding to each concentration (X) was input in EXCEL, and the IC 50 value (the half inhibitory concentration) of each compound was calculated with the XLfit plug-in according to the built-in four-parameter fitting equation Y=Bottom+(Top−Bottom)/(1+(IC50/X)*HillSlope).
- Test on the inhibitory activity of the compounds of the invention against PRMT5 enzyme by radioisotopic method Test method: A 1× enzyme reaction buffer (10 mM Tris 8.0 (Sigma, Cat. No. T2694-1L), 0.01% Tween-20 (Sigma, Cat. No. P2287-100 ML), 1 mM DTT (Sigma, Cat. No. D0632-10G)) was prepared. PRMT5 (Active Motif, Cat. No. 31921) and [3H]SAM (PerkinElmer, Cat. No. NET155V001MC) were added to the 1×enzyme reaction buffer, to prepare a 25/15× mixed solution (PRMT5 final concentration: 5 nM, [3H]SAM final concentration: 0.3 μM). 15 μL of this solution was transferred into a 384-well microplate (Corning 384-well Polypropylene Storage Microplates, Cat. No. 3657) with various concentrations of the compounds (DMSO final concentration 1%), and incubated at room temperature for 60 minutes. A polypeptide substrate, GL-27 (Ac-SGRGKGGKGLGKGGAKRHRKVGG-K (Biotin) (GL Biochem, Cat. No. 342095)), was added into the 1×enzyme reaction buffer to prepare a 25/10× substrate solution. Then 10 μL of the polypeptide substrate solution (final concentration of the polypeptide substrate: 100 nM) was added, a reaction was stirred at room temperature for 120 minutes, and then 5 μL 6× ice cold SAM (Sigma, Cat. No. A7007-100 MG) solution was added to stop the reaction (SAM final concentration: 0.125 mM). 25 L of the reaction mixture was transferred into a FlashPlate (Streptavidin FlashPlate HTS PLUS, High Capacity, 384-well, Perkin Elmer, Cat. No. SMP410A001PK), and incubated at room temperature for 1 h. After washed three times with distilled water containing 0.1% Tween-20, the microplate was read on a MicroBeta reader for CPM data (Counts Per Minute). After the CPM raw data of the compounds at various concentrations were obtained, the data were normalized according to Inh %=(Max-Sample)/(Max-Min)*100%, and the enzyme activity inhibition rate Inh % at each concentration point was obtained (wherein Max is the CPM value of a positive well with the enzyme, Min is the CPM value of a negative well without the enzyme, and Sample is the CPM value of the sample well treated with the compounds). Then the inhibition rate Inh % (Y) corresponding to each concentration (X) was input in EXCEL, and the IC50 value (the half maximal inhibitory concentration) of each compound was calculated with the XLfit plug-in according to the built-in four-parameter fitting equation Y=Bottom+(Top-Bottom)/(1+(IC50/X)*HillSlope).
- QFRET-based biochemical high throughput dose response assay to identify exosite inhibitors of ADAM17 Source (MLPCN Center Name): The Scripps Research Institute Molecular Screening Center (SRIMSC) Center Affiliation: Torrey Pines Institute for Molecular Sciences (TPIMS) Assay Provider: Dmitriy Minond, Torrey Pines Institute for Molecular Sciences (TPIMS) Network: Molecular Libraries Probe Production Centers Network (MLPCN) Grant Proposal Number: 1 R03 DA033985-01 Grant Proposal PI: Dmitriy Minond, Torrey Pines Institute for Molecular Sciences (TPIMS) External Assay ID: ADAM17_INH_QFRET_1536_3XIC50 INH DRUN Name: QFRET-based biochemical high throughput dose response assay to identify exosite inhibitors of ADAM17. Description: Approximately 20-30% of breast cancer patients have tumors that over-express human epidermal growth factor receptor (HER2), which confers an aggressive tumor phenotype and poor prognosis [1-3]. A Disintegrin and Metalloprotease (ADAM) proteases are responsible for amplification of HER2 signaling due to either cleavage of its extracellular domain or release of H
- Counterscreen for inhibitors of phospholipase C isozymes (PLC-B3): Fluorescence-based biochemical high throughput dose response assay to identify inhibitors of phospholipase C isozymes (PLC-gamma1) Source (MLPCN Center Name): The Scripps Research Institute Molecular Screening Center (SRIMSC) Center Affiliation: The Scripps Research Institute Assay Provider: Qisheng Zhang, University of North Carolina at Chapel Hill Network: Molecular Libraries Probe Production Centers Network (MLPCN) Grant Proposal Number: R01GM098894 Grant Proposal PI: Qisheng Zhang, University of North Carolina at Chapel Hill External Assay ID: PLCG1_INH_QFRET_1536_3XIC50 DCSRUN for PLCB3 INH Name: Counterscreen for inhibitors of phospholipase C isozymes (PLC-B3): Fluorescence-based biochemical high throughput dose response assay to identify inhibitors of phospholipase C isozymes (PLC-gamma1). Description: Extracellular stimuli including hormones, growth factors, and neurotransmitters promote activation of phospholipase C (PLC) isozymes and cleavage of the membrane lipid phosphatidylinositol 4,5- bisphosphate (PtdIns(4,5)P2) into the classical second messengers, diacylglycerol and inositol 1,4,5- trisphosph
- In Vitro Histone Deacetylase Assay I The probe binding HDAC11 assay was performed using a time resolved fluorescence (TRF) assay format. Recombinant N-terminal GST tag full-length human HD AC 11 was expressed and purified from baculovirus in Sf9 insect cells (SignalChem, #H93-30G-1000). Each assay was performed in 1536 black well microplates (Corning, #3936) in a final volume of 8 μL in assay buffer containing 50 mM HEPES (pH 7.5), 50 mM KCl, 50 mM NaCl, 0.5 mM GSH (L-Glutathione reduced, Sigma #G4251), 0.03% BGG (0.22 μM filtered, Sigma, #G7516-25G), and 0.01% Triton X-100 (Sigma, #T9284-10L). 100 nL of 10-point, 3-fold serial dilution in DMSO was pre-dispensed into respective wells of 1536 assay plates for a final test concentration range of 25 μM to 1.3 nM respectively. The final concentration in the assay of HD AC 11 and probe (a fluorescein labeled HD AC 11 inhibitor) was 2.5 nM and 20 nM respectively. 4 μL of 2× probe and 2× anti-GST Terbium (Cisbio, #61GSTXLB) was added to assay plates followed by 4 μL of 2×HDAC11. Plates were incubated for 16 hours at room temperature before time resolved fluorescence was read on the Envision (Excitation at 340 nm, and Emission at 485 nm and 535 nm, Perkin Elmer).Data from HD AC 11 Assays were reported as percent inhibition (inh) compared with control wells based on the following equation: % inh=1−((FLU−AveLow)/(AveHigh−AveLow)) where FLU=measured time resolved fluorescence. AveLow=average time resolved fluorescence of no enzyme control (n=32). AveHigh=average time resolved fluorescence of DMSO control (n=32). IC50 values were determined by curve fitting of the standard 4 parameter logistic fitting algorithm included in the Activity Base software package: IDBS XE Designer Model205. Data is fitted using the Levenburg Marquardt algorithm.
- HTRF Biochemical Assay for CBP and BRD4 Activity The assay was performed in a final volume of 6 μL in assay buffer containing 50 mM Hepes (pH 7.5, (0.5M Hepes, pH 7.5 solution; Teknova H1575)), 0.5 mM GSH, 0.01% BGG (0.22 μM filtered, Sigma, G7516-25G), 0.005% BSA (0.22 μM filtered, EMD Millipore Corporation, 126575) and 0.01% Triton X-100 (Sigma, T9284-10L). Nanoliter quantities of 10-point, 3-fold serial dilution in DMSO were pre-dispensed into 1536 assay plates (Corning, #3724BC) for a final test concentration of 33 μM to 1.7 nM, top to lowest dose, respectively. 3 of 2× Protein and 3 μL of 2× Peptide Ligand were added to assay plates (pre-stamped with compound). Plates were incubated for varying times at room temperature prior to measuring the signal. TR-FRET (Time-Resolved Fluorescence Resonance Energy Transfer) was measured on the PHERAstar (BMG, equipped with HTRF optic module [337/520/490]) or on the Envision (PerkinElmer, equipped with the TRF Laser unit, TRF dual mirror D400/D505 and emission filters M520 and M495). Data were reported as percent inhibition compared with control wells based on the following equation: % inh=1−((TR-FRET ratio−AveLow)/(AveHigh−AveLow)) where TR-FRET ratio=(Fluorescence at 520 nm/Fluorescence at 490 nm)*10000), AveLow=average TR-FRET ratio of no enzyme control (n=32), and AveHigh=average TR-FRET ratio of DMSO control (n=32). IC50 values were determined by curve fitting of the standard 4 parameter logistic fitting algorithm included in the Activity Base software package: IDBS XE Designer Model 205. Data is fitted using the Levenburg Marquardt algorithm. For all assay formats data were reported as percent inhibition compared with control wells based on the following equation: % inh=100*((FLU−AveLow)/(AveHigh−AveLow)) where FLU=measured Fluorescence, AveLow=average Fluorescence of no enzyme control (n=32), and AveHigh=average Fluorescence of DMSO control (n=32). IC50 values were determined by curve fitting of the standard 4 parameter logistic fitting algorithm included in the Activity Base software package: IDBS XE Designer Model 205. Data is fitted using the Levenburg Marquardt algorithm.
- Test on EZH2 (Y641F) and EZH2 (Y641N) Inhibitory Activities ProceduresCompounds at different concentrations were dissolved in 100% DMSO and transferred to test plates, and the final concentration of DMSO was 1%. Enzyme solution and substrate SAM solution were prepared with 1-fold reaction buffer (optimized Tris buffer). 5 uL of enzyme solution was added to the test plate and wells only added with 5 uL of reaction buffer were used as negative control wells. After incubation at room temperature for 15 min, the plate was added with 5 uL of substrate solution per well to initiate the reaction, and then incubated at room temperature for 60 min. 5 uL of receptor solution was added and the plate was incubated away from light at room temperature for 60 min. 10 uL of donor solution was added and the plate was incubated away from light at room temperature for 30 min. The endpoint values were read on the Envision and the IC50 was calculated.Data CalculationData were fitted by GraphPad Prism 5 software and inhibition rate was calculated according to equation (1)Inh %=(Max−Signal)/(Max−Min)×100 (1)IC50 was calculated using equation (2)Y=Bottom+(Top−Bottom)/(1+10{circumflex over ( )}((Log IC 50 −X)×Hill Slope))Y: inhibition rate; X: concentration of the compound
- Test on EZH2 (wt) Inhibitory Activity Table 4: ProceduresCompounds at different concentrations were dissolved in 100% DMSO and transferred to test plates, and the final concentration of DMSO was 1%. Enzyme solution and substrate SAM solution were prepared with 1-fold reaction buffer (optimized Tris buffer). 5 uL of enzyme solution was added to the test plate and wells only added with 5 uL of reaction buffer were used as negative control wells. After incubation at room temperature for 15 min, the plate was added with 5 uL of substrate solution per well to initiate the reaction, and then incubated at room temperature for 60 min. 5 uL of receptor solution was added and the plate was incubated away from light at room temperature for 60 min. 10 uL of donor solution was added and the plate was incubated away from light at room temperature for 30 min. The endpoint values were read on the Envision and the IC50 was calculated.Data CalculationData were fitted by GraphPad Prism 5 software and inhibition rate was calculated according to equation (1)Inh %=(Max−Signal)/(Max−Min)×100 (1)IC50 was calculated using equation (2)Y=Bottom+(Top−Bottom)/(1+10{circumflex over ( )}((Log IC 50 −X)×Hill Slope))Y: inhibition rate; X: concentration of the compound
- USP7 Assay B (Ubitquin-Rhodamine 110 Assay) Each assay was performed in a final volume of 20 μL in assay buffer containing 20 mM Tris-HCl (pH 8.0, (1M Tris-HCl, pH 8.0 solution; Corning 46-031-CM)), 2 mM CaCl2 (1M Calcium Chloride solution; Sigma #21114) 1 mM GSH (L-Glutathione reduced; Sigma #G4251), 0.01% Prionex (0.22 μM filtered, Sigma #G-0411), and 0.01% Triton X-100. Stock compound solutions were stored at −20° C. as 10 mM in DMSO. Up to 1 month prior to the assay, 2 mM test compounds were pre-dispensed into assay plates (Black, low volume; Corning #3820) and frozen at −20° C. Prestamped assay plates were allowed to come to room temperature on the day of the assay. For the screen, 100 nL of 2 mM was pre-dispensed for a final screening concentration of 10 μM (DMSO(fc)=0.5%). For follow-up studies, 250 nL of an 8-point, 3-fold serial dilution in DMSO was pre-dispensed into assay plates for a final test concentration of 25 μM-11 nM (1.25% DMSO final concentration). Unless otherwise indicated, all follow-up assays were run on triplecate plates. Enzyme (USP7, construct Met (208-1102)-TEV-6*His; Viva Q93009-1) concentration and incubation times were optimized for the maximal signal-to-background while maintaining initial velocity conditions at a fixed substrate concentration. The final concentration of the enzyme in the assay was either 75 pM or 250 pM. Final substrate (Ub-Rh110; Ubiquitin-Rhodamine 110, R&D Systems (biotechne)#U-555) concentration was 25 nM with [Ub-Rh110]<
- ADORA2B Receptor Binding Assay 100 μL of Adenosine A2B membrane stock was dispensed into individual wells of an assay plate. 1 μL of each compound (test compounds, high control compound, low control compound) was then transferred into individual wells, followed by 100 μL of radio-labeled ligand. Plates were then sealed, and incubated at room temperature for 1 hour. Unifilter-96 GF/C filter plates were pre-soaked with 50 μL of 0.5% BSA per well for at least 30 min at room temperature. When binding assays were completed, reaction mixtures were filtered through GF/C plates using a Perkin Elmer Filtermate Harvester, and then each plate was washed 4× with cold wash buffer. Filter plates were then dried for 1 hour at 50° C. After drying, the bottom of the filter plate wells was sealed using Perkin Elmer Unifilter-96 backing seal tape. 50 μL of Perkin Elmer Microscint 20 cocktail was then added, and the top of the filter plate was then sealed using Perkin Elmer TopSeal-A sealing film. 3H trapped on the filter was counted using a Perkin Elmer MicroBeta2 Reader. Data analysis was performed using GraphPad Prism 5 software, and the Inhibition [% Control] was calculated using the following equation: % Inh=(1−Background subtracted Assay value/Background subtracted HC value) *100.
- ADORA1A Receptor Binding Assay 2 L of each compound (test compounds, high control compound, low control compound) was transferred into individual wells of an assay plate. Also, to each individual well, 98 L of Adenosine A1a membrane stock (for ADORA1A Receptor Binding Assay) or Adenosine A2a membrane stock (for ADORA2A Receptor Binding Assay) was dispensed, followed by 100 L of radio-labeled ligand. Plates were then sealed and incubated at room temperature for 1 hour (for ADORA1A Receptor Binding Assay) or 2 hours (for ADORA2A Receptor Binding Assay). Unifilter-96 GF/C filter plates were pre-soaked with 50 L of 0.3% PEI per well for at least 30 min at room temperature. When binding assays were completed, reaction mixtures were filtered through GF/C plates using a Perkin Elmer Filtermate Harvester, and then each plate was washed 4 with cold wash buffer. Filter plates were then dried for 1 hour at 50 ° C. After drying, the bottom of the filter plate wells was sealed using Perkin Elmer Unifilter-96 backing seal tape. 50 L of Perkin Elmer Microscint 20 cocktail was then added, and the top of the filter plate was then sealed using Perkin Elmer TopSeal-A sealing film. 3H trapped on the filter was counted using a Perkin Elmer MicroBeta2 Reader. Data analysis was performed using GraphPad Prism 5 software, and the Inhibition [% Control] was calculated using the following equation: % Inh=(1 Background subtracted Assay value/Background subtracted HC value) *100.
- Biochemical Inhibition Assay NAMPT Protein Purification. Recombinant His-tagged NAMPT was produced in E. coli cells, purified over a Ni column, and further purified over a size-exclusion column by XTAL Biostructures.The NAMPT Enzymatic Reaction. The NAMPT enzymatic reactions were carried out in Buffer A (50 mM Hepes pH 7.5, 50 mM NaCl, 5 mM MgCl2, and 1 mM THP) in 96-well V-bottom plates. The compound titrations were performed in a separate dilution plate by serially diluting the compounds in DMSO to make a 100× stock. Buffer A (89 μL) containing 33 nM of NAMPT protein was added to 1 μL of 100× compound plate containing controls (e.g. DMSO or blank). The compound and enzyme mixture was incubated for 15 min at room temperature, then 10 μL of 10× substrate and co-factors in Buffer A were added to the test well to make a final concentration of 1 μM NAM, 100 μM 5-Phospho-D-ribose 1-diphosphate (PRPP), and 2.5 mM Adenosine 5′-triphosphate (ATP). The reaction was allowed to proceed for 30 min at room temperature, then was quenched with the addition of 11 μL of a solution of formic acid and L-Cystathionine to make a final concentration of 1% formic acid and 10 μM L-Cystathionine. Background and signal strength was determined by addition (or non-addition) of a serial dilution of NMN to a pre-quenched enzyme and cofactor mix.Quantification of NMN. A mass spectrometry-based assay was used to measure the NAMPT reaction product, β-nicotinamide mononucleotide (NMN), and the internal control (L-Cystathionine). NMN and L-Cystathionine were detected using the services of Biocius Lifesciences with the RapidFire system. In short, the NMN and L-Cystathionine were bound to a graphitic carbon cartridge in 0.1% formic acid, eluted in 30% acetonitrile buffer, and injected into a Sciex 4000 mass spectrometer. The components of the sample were ionized with electrospray ionization and the positive ions were detected. The Q1 (parent ion) and Q3 (fragment ion) masses of NMN were 334.2 and 123.2, respectively. The Q1 and Q3 for L-Cystathionine were 223.1 and 134.1, respectively. The fragments are quantified and the analyzed by the following methodDetermination of IC50 Values. First, the NMN signal was normalized to the L-Cystathionine signal by dividing the NMN signal by the L-Cystathionine signal for each well. The signal from the background wells were averaged and subtracted from the test plates. The compound treated cells were then assayed for percent inhibition by using this formula:% Inh=100−100*x/ywherein x denotes the average signal of the compound treated wells and y denotes the average signal of the DMSO treated wells.IC50 values were then determined using the following formula:IC 50=10{circumflex over ( )}(LOG10(X)+(((50-%Inh at Cmpd Concentration 1)/(XX−YY)*(LOG10(X)−LOG10(Y))))wherein X denotes the compound concentration 1, Y denotes the compound concentration 2, XX denotes the % inhibition at compound concentration 1 (X), and YY denotes the % inhibition at compound concentration 2 (Y).
- LSD1 Inhibitory Activity Assay Experimental steps and a method: In this experiment, the in vitro inhibitory activity of the compounds of the present disclosure against LSD1 on an enzyme level was tested by using an AlphaScreen method. The experimental steps are described as follows:a) preparation of a 1× buffer:preparing a 1× buffer (improved trihydroxymethylaminomethane buffer);b) continuous dilution of the compounds:transferring the compounds of the present disclosure to a porous plate by using Echo at a final DMSO concentration of 1%;c) preparation of an enzyme solution:preparing an enzyme solution in the 1× buffer;d) preparation of a substrate solution:adding polypeptide to the 1× buffer to prepare a substrate solution;e) transferring 5 μL of the enzyme solution or the 1× buffer to the porous plate;f) conducting incubation at room temperature for 15 min;g) adding 5 μL of the substrate solution to each well to induce a reaction;h) conducting incubation at room temperature for 40 min;i) preparing a 1× Alphalisa buffer;j) preparation of a 1× Alphalisa buffer solution of receptors and donors:adding 15 μL of a receptor and donor solution in dark light environment, and conducting incubation at room temperature for 60 min;k) reading an endpoint in an EnSpire Alpha mode; andl) data processing:calculating an inhibitory value according to an equation 1:Inh %=(Max−Signal)/(Max−Min)*100; and equation 1:calculating an IC50 value by using XL-Fit according to an equation 2:Y=Bottom+(Top-Bottom)/(1+(IC50/X)*HillSlope), equation 2:where Y indicates the inhibitory rate, and X indicates the concentration of a compound.
- Radioligand Binding Assay A second A2A adenosine receptor radioligand binding assay protocol was used. The protocol used adenosine A2a (human) membrane (PerkinElmer RBHA2AM400UA) at a concentration of 5 μg/well/100 μl and the radioligand [3H] CGS-21680 (Cat No. PerkinElmer-NET1021250UC) at a final concentration of 6 nM. Testing compounds were diluted with DMSO to make 8-point 4-fold serial dilution, starting at 0.2 mM. CGS-15943 was the reference compound. 1 μl of compounds/high control/low control was transferred to the assay plate according to a plate map, followed by 100 μl of membrane stocks and 100 μl of radioligand, in assay buffer (50 mM Tris-HCl, 10 mM MgCl2, 1 mM EDTA, pH 7.4). The plate was sealed and incubated at RT for 2 hours. Unifilter-96 GF/C filter plates (Perkin Elmer Cat #6005174) were soaked with 50 μl of 0.3% PEI per well for at least 0.5 hour at room temperature. When the binding assays were completed, the reaction mixtures were filtered through GF/C plates using Perkin Elmer Filtermate Harvester, and each plate washed 4 times with cold wash buffer (50 mM Tris-HCl, 154 mM NaCl, pH 7.4). The filter plates were dried for 1 hour at 50 degrees. After drying, the bottom of the filter plate wells was sealed, 50 μl of Perkin Elmer Microscint 20 cocktail was added, and the top of the filter plate was sealed. 3H trapped on the filter was counted using Perkin Elmer MicroBeta2 Reader. The data were analyzed with GraphPad Prism 5 to obtain binding IC50 values. The Inhibition [% Control] was calculated using the equation: % Inh=(1−Background subtracted Assay value/Background subtracted HC value)*100, where HC is high control.
- In Vitro Histone Deacetylase Assay II The measurement of HD AC 11 deacetylase activity was performed using an electrophoretic mobility shift assay by Nanosyn (Santa Clara, Calif.). Full length human recombinant HD AC 11 protein was expressed in baculoviral system and purified by affinity chromatography. The enzymatic reactions were assembled in 384 well plates in a total volume of 25 μL in a reaction buffer composing: 100 mM HEPES, pH 7.5, 25 mM KCl, 0.1% bovine serum albumin, 0.01% Triton X-100, 1% DMSO (from compounds), 2 μM of the fluorescently labeled peptide substrate and enzyme. The enzyme was added at a final concentration of 10 nM. The peptide substrate FAM-RHKK(tri-fluor-Ac) NH2 was used. The compounds were tested at 12 concentrations spaced by 3× dilution intervals. Negative control samples (0%-inhibition in the absence of inhibitor) and positive control samples (100%-inhibition) were assembled in replicates of four in each assay plate. The reactions were incubated at 25° C. and quenched by the addition of 45 μL of termination buffer (100 mM HEPES, pH 7.5, 0.01% Triton X-100, 0.05% SDS).The terminated assay plates were analyzed on LabChip 3000 microfluidic electrophoresis instrument (Perkin Elmer/Caliper Life Sciences). The fluorescence intensity of the electrophoretically separated de-acetylated product and substrate peptide was measured. Activity in each sample was determined as the product to sum ratio (PSR): P/(S+P), where P is the peak height of the product peptide and S is the peak height of the substrate peptide. Percent inhibition (Pinh) is determined using the following equation:P inh=(PSR0%−PSRinh)/(PSR0%−PSR100%)*100,where PSRinh, is the product sum ratio in the presence of inhibitor, PSR0% is the average product sum ration in the absence of inhibitor and PSR100% is the average product sum ratio in 100%-inhibition control samples. The IC50 values of inhibitors were determined by fitting the percent inhibition curves with 4 parameter dose-response model using XLfit 4 software.
- In-vitro Enzymatic Activity Assay Experimental Reagents: Reagent Vendor Cat No.Recombinant Human His6-USP1/His6-UAF1 R&D E-568-050Complex ProteinUbiquitin Rhodamine 110 Protein, CF (Ub-Rho) R&D U-555-050Experimentalcomsumables:Consumables Vendor Cat No.384-Well plate Perkin Elmer 6007279First Experimental Method: 1. Compound Dilution1) The compounds of the present disclosure were prepared to 10 mM with DMSO, and used as test stock solutions.2) The stock solutions of the compounds of the present disclosure were diluted in a 4-fold gradient for 10 concentrations, with a maximum concentration of 10 mM.3) The diluted compounds of the present disclosure were respectively transferred to 384-well plates (diluted by 1,000 folds) by Echo550, 2 multiple wells were set for each concentration, and a final concentration of DMSO was 1%.4) The final concentrations of test compounds were 10,000 nM, 2,500 nM, 625 nM, 156 nM, 39 nM, 9.8 nM, 2.4 nM, 0.61 nM, 0.15 nM and 0.038 nM.2. Enzyme Reaction Experiment1) An enzyme solution was prepared in 1 test buffer.2) Ubiquitin Rhodamine 110 protein, CF (UB-Rho), was added into 1 determination buffer to prepare a substrate solution.3) 10 μL of enzyme solution and 1 reaction buffer were transferred to a 384-well plate, and4) incubated at room temperature for 15 minutes.5) 10 μL of substrate solution was added into each well to start the reaction, centrifuged for 30 seconds, and shaken for 30 seconds.3. Result Detection1) Plate reading was carried out on SpectraMax Paradigm for 30 minutes, with an excitation wavelength of 480 nm and an emission wavelength of 540 nm.2) Data on SpectraMax Paradigm were collected.4. Data analysisAn inhibition (% inh) was calculated by the following formula:inhibition(%)=100% Max-SignalMax-Minwherein, Max represented: a luminous signal intensity of a positive control well without adding the compound;Min represented: a luminous signal intensity of a negative control well without adding the enzyme; andSignal represented: a luminous signal intensity of the compound of the test sample.IC50 was Calculated by the Following Formula:𝑌=Bottom+Top-Bottom1+(IC50 𝑋) HillSlopewherein, Y represented: % inhibition; andX represented: the concentration of the compound.
- Inhibitory Activity Against KHK Kinase In Vitro 1) The present compounds and the control drug were formulated in DMSO to 10 mM as stock solutions for test.2) The stock solutions of the compounds of the present invention and the control drug were diluted by 10-fold to 1 mM, and then further diluted in a 3-fold gradient to 11 concentrations, with the highest concentration being 1 mM.3) 0.1 μL of the compounds of the present invention and the control drug as diluted was transferred with Echo550 to a 384-well plate, in duplicate per concentration, and centrifuged at 1000 rpm for 1 min.2. Enzyme Reaction Test1) 5 μL of KHK-C kinase working solution was added to the 384-well plate, centrifuged at 1000 rpm for 1 min, and incubated at room temperature of 25° C. for 15 min.2) 5 μL of the substrate working solution was added to the 384-well plate to initiate the kinase reaction, centrifuged at 1000 rpm for 1 min, and incubated at room temperature of 25° C. for 60 min.3) The final concentrations of the KHK-C kinase reaction were 1 nM for KHK-C, 100 μM for ATP, 200 μM for D-Fructose, 50 mM for HEPES, 10 mM for MgCl2, and 0.01% for Brij35, and the final concentration of DMSO was 1%.4) The final concentrations of the test compounds and the control drug were 10000 nM, 3333.33 nM, 1111.11 nM, 370.37 nM, 123.457 nM, 41.15 nM, 13.71 nM, 4.572 nM, 1.524 nM, 0.508 nM, and 0.169 nM, respectively.3. Reaction Termination and Detection1) The 384-well plate was added with 10 μL of the ADP Glo reagent, centrifuged at 1000 rpm for 1 min, and then incubated at room temperature of 25° C. for 40 min.2) The 384-well plate was added with 20 μL of the kinase detection reagent, centrifuged at 1000 rpm for 1 min, and then incubated at room temperature of 25° C. for 40 min.3) After the reaction was completed, the fluorescence value LUM was read on Envision.4. Data AnalysisThe following equation was used to calculate the inhibition (% inh):inhibition(%)=100%×LumHC-LumCPDLumHC-LumLCwherein,
- SMYD3 Biochemical Assay The assays were all performed in a buffer consisting of 25 mM Tris-Cl pH 8.0, 1 mM TCEP, 0.005% BSG, and 0.005% Tween 20, prepared on the day of use. Compounds in 100% DMSO (1 ul) were spotted into a 384-well white opaque OptiPlate using a Bravo automated liquid handling platform outfitted with a 384-channel head (Agilent Technologies). DMSO (1 ul) was added to Columns 11, 12, 23, 24, rows A-H for the maximum signal control and 1 ul of SAH, a known product and inhibitor of SMYD3, was added to columns 11, 12, 23, 24, rows I-P for the minimum signal control. A cocktail (40 ul) containing the SMYD3 enzyme was added by Multidrop Combi (Thermo-Fisher). The compounds were allowed to incubate with SMYD3 for 30 min at room temperature, then a cocktail (10 ul) containing SAM and MEKK2 was added to initiate the reaction (final volume=51 ul). The final concentrations of the components were as follows: SMYD3 was 0.4 nM, 3H-SAM was 8 nM, MEKK2 was 12 nM, SAH in the minimum signal control wells was 1 mM, and the DMSO concentration was 2%. The assays were stopped by the addition of non-radiolabeled SAM (10 ul) to a final concentration of 100 uM, which dilutes the 3H-SAM to a level where its incorporation into MEKK2 is no longer detectable. Radiolabeled MEKK2 was detected using a scintillation proximity assay (SPA). 10 uL of a 10 mg/mL solution of SPA beads in 0.5 M citric acid was added and the plates centrifuged at 600 rpm for 1 min to precipitate the radiolabeled MEKK2 onto the SPA beads. The plates were then read in a PerkinElmer TopCount plate reader to measure the quantity of 3H-labeled MEKK2 as disintegrations per minute (dpm) or alternatively, referred to as counts per minute (cpm).% Inhibition Calculation% inh = 100 - ( dpm cmpd - dpm min dpm max - dpm min ) × 100Where dpm=disintegrations per minute, cmpd=signal in assay well, and min and max are the respective minimum and maximum signal controls.Four-Parameter IC50 FitY = Bottom + ( Top - Bottom ) ( 1 + ( X IC 50 ) Hill CoefficientWhere top and bottom are the normally allowed to float, but may be fixed at 100 or 0 respectively in a 3-parameter fit. The Hill Coefficient normally allowed to float but may also be fixed at 1 in a 3-parameter fit. Y is the % inhibition and X is the compound concentration.
- SMYD3 Enzyme Assays on MEKK2 Protein Substrate The assays were an performed in a buffer consisting of 25 mM Tris-Cl pH 8.0, 1 mM TCEP, 0.005% BSG, and 0.005% Tween 20, prepared on the day of use. Compounds in 100% DMSO (1 ul) were spotted into a 384-well white opaque OptiPlate using a Bravo automated liquid handling platform outfitted with a 384-channel head (Agilent Technologies), DMSO (1 ul) was added to Columns 11, 12, 23. 24, rows A-H for the maximum signal control and 1 ul of SAH, a known product and inhibitor of SMYD3, was added to columns 11, 12, 23, 24, rows I-P for the minimum signal control. A cocktail (40 ul) containing the SMYD3 enzyme was added by Multidrop Combi (Thermo-Fisher). The compounds were allowed to incubate with SMYD3 for 30 min at room temperature, then a cocktail (10 ul) containing SAM and MEKK2 was added to initiate the reaction (final volume=51 ul). The final concentrations of the components were as follows: SMYD3 was 0.4 nM, 3H-SAM was 8 nM, MEKK2 was 12 nM, SAH in the minimum signal control wells was 1 mM, and the DMSO concentration was 2%. The assays were stopped by the addition of non-radiolabeled SAM (10 ul) to a final concentration of 100 uM, which dilutes the 3H-SAM to a level where its incorporation into MEKK2 is no longer detectable. Radiolabeled MEKK2 was detected using a scintillation proximity assay (SPA). 10 uL of a 10 mg/mL solution of SPA beads in 0.5 M citric acid was added and the plates centrifuged at 600 rpm fort min to precipitate the radiolabeled MEKK2 onto the SPA beads. The plates were then read in a PerkinElmer TopCount plate reader to measure the quantity of 3H-labeled MEKK2 as disintegrations per minute (dpm) or alternatively, referred to as counts per minute (cpm).% inhibition calculation % inh = 100 - ( dpm cmpd - dpm min dpm max - dpm min ) × 100Where dpm=disintegrations per minute, cmpd=signal in assay well, and min and max are the respective minimum and maximum signal controls.Four - parameter IC 50 fit Y = Bottom + ( Top - Bottom ) ( 1 + ( X IC 50 ) Hill CoefficientWhere top and bottom are the normally allowed to float, but may be fixed at 100 or 0 respectively in a 3-parameter fit. The Hill Coefficient normally allowed to float but may also be fixed at 1 in a 3-parameter fit. Y is the % inhibition and X is the compound concentration.
- Wild-Type PRC2 Enzyme Assay eneral Procedure for Wild-Type PRC2 Enzyme Assay on Oligonucleosome Substrate. The assays was performed in a buffer consisting of 20 mM bicine (pH=7.6), 0.5 mM DTT, 0.005% BSG, 100 mM KCl and 0.002% Tween20, prepared on the day of use. Compounds in 100% DMSO (1 μL) were spotted into polypropylene 384-well V-bottom plates (Greiner) using a Platemate 2×3 outfitted with a 384-channel pipet head (Thermo). DMSO (1 μL) was added to columns 11, 12, 23, 24, rows A-H for the maximum signal control, and SAH, a known product and inhibitor of PRC2 (1 μL) was added to columns 11, 12, 23, 24, rows I-P for the minimum signal control. A cocktail (40 μL) containing the wild-type PRC2 enzyme and chicken erythrocyte oligonucleosome was added by Multidrop Combi (Thermo). The compounds were allowed to incubate with PRC2 for 30 min at 25° C., then a cocktail (10 μL) containing a mixture of non-radioactive and 3H-SAM was added to initiate the reaction (final volume=51 μL). The final concentrations were as follows: wild-type PRC2 enzyme was 4 nM, non-radioactive SAM was 430 nM, 3H-SAM was 120 nM, chicken erythrocyte olignonucleosome was 120 nM, SAH in the minimum signal control wells was 1 mM and the DMSO concentration was 1%. The assay was stopped by the addition of non-radioactive SAM (10 μL) to a final concentration of 600 μM, which dilutes the 3H-SAM to a level where its incorporation into the chicken erythrocyte olignonucleosome substrate is no longer detectable. 50 μL of the reaction in the 384-well polypropylene plate was then transferred to a 384-well Flashplate and the chicken erythrocyte nucleosomes were immobilized to the surface of the plate, which was then washed three times with 0.1% Tween20 in a Biotek ELx405 plate washer. The plates were then read in a PerkinElmer TopCount platereader to measure the quantity of 3H-labeled chicken erythrocyte oligonucleosome bound to the Flashplate surface, measured as disintegrations per minute (dpm) or alternatively, referred to as counts per minute (cpm).% Inhibition Calculation% inh = 100 - ( dpm cmpd - dpm min dpm max - dpm min ) × 100Where dpm=disintegrations per minute, cmpd=signal in assay well, and min and max are the respective minimum and maximum signal controls.Four-Parameter IC50 FitY = Bottom + ( Top - Bottom ) 1 + ( X IC 50 ) Hill CoefficientWhere top and bottom are the normally allowed to float, but may be fixed at 100 or 0 respectively in a 3-parameter fit. The Hill Coefficient normally allowed to float but may also be fixed at 1 in a 3-parameter fit. Y is the % inhibition and X is the compound concentration.