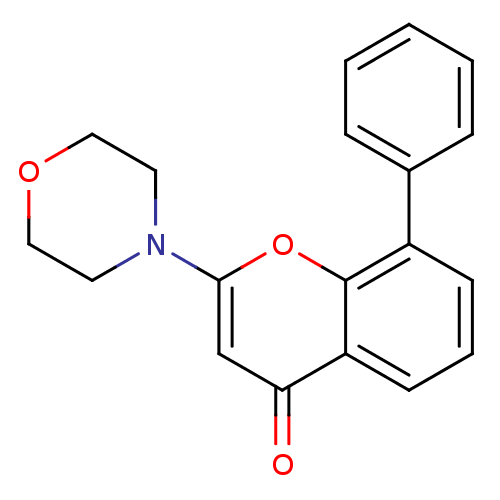
 BDBM12915 CHEMBL98350 US9505780, LY294002 2-(4-Morpholinyl)-8-phenyl-4H-1-benzopyran-4-one 2-(morpholin-4-yl)-8-phenyl-4H-chromen-4-one LY294002 US10308662, Compound LY294002
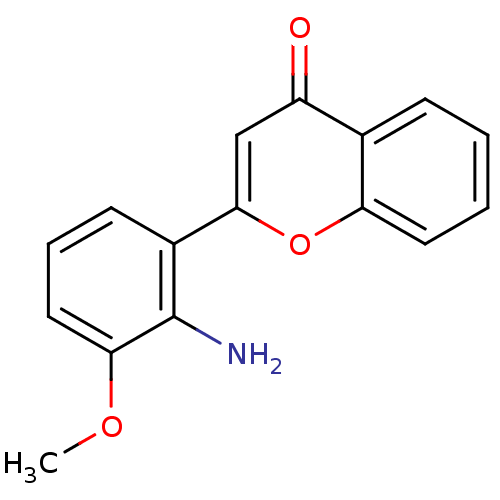 2-(2-amino-3-methoxyphenyl)-4H-chromen-4-one PD-98059 2-(2-Amino-3-methoxy-phenyl)-chromen-4-one(PD98059) BDBM50108771 2-(2-Amino-3-methoxy-phenyl)-chromen-4-one CHEMBL35482 2'-amino-3'-methoxyflavone
- Abbott, BM; Thompson, PE PDE2 inhibition by the PI3 kinase inhibitor LY294002 and analogues. Bioorg Med Chem Lett 14: 2847-51 (2004)
- Chiosis, G; Rosen, N; Sepp-Lorenzino, L LY294002-geldanamycin heterodimers as selective inhibitors of the PI3K and PI3K-related family. Bioorg Med Chem Lett 11: 909-13 (2001)
- Walker, EH; Pacold, ME; Perisic, O; Stephens, L; Hawkins, PT; Wymann, MP; Williams, RL Structural determinants of phosphoinositide 3-kinase inhibition by wortmannin, LY294002, quercetin, myricetin, and staurosporine. Mol Cell 6: 909-19 (2000)
- Jacobs, MD; Black, J; Futer, O; Swenson, L; Hare, B; Fleming, M; Saxena, K Pim-1 ligand-bound structures reveal the mechanism of serine/threonine kinase inhibition by LY294002. J Biol Chem 280: 13728-34 (2005)
- ChEMBL_1634412 (CHEMBL3877204) Inhibition of immobilized N-LY294002 bead binding to PI3Kalpha (unknown origin) expressed in HEK293T cells incubated for 1 hr by LC-MS/MS analysis
- ChEMBL_1634413 (CHEMBL3877205) Inhibition of immobilized N-LY294002 bead binding to PI3Kbeta (unknown origin) expressed in HEK293T cells incubated for 1 hr by LC-MS/MS analysis
- ChEMBL_1634414 (CHEMBL3877206) Inhibition of immobilized N-LY294002 bead binding to PI3Kdelta (unknown origin) expressed in HEK293T cells incubated for 1 hr by LC-MS/MS analysis
- ChEMBL_1634410 (CHEMBL3877202) Inhibition of immobilized N-LY294002 bead binding to BRD2 (unknown origin) expressed in HEK293T cell nuclear extract incubated for 1 hr by LC-MS/MS analysis
- ChEMBL_1634411 (CHEMBL3877203) Inhibition of immobilized N-LY294002 bead binding to BRD3 (unknown origin) expressed in HEK293T cell nuclear extract incubated for 1 hr by LC-MS/MS analysis
- ChEMBL_1634379 (CHEMBL3877171) Inhibition of immobilized N-LY294002 bead binding to C-terminal Flag-tagged BRD4 (unknown origin) expressed in HEK293T cell nuclear extract incubated for 1 hr by LC-MS/MS analysis
- DNA-PK Enzyme Inhibitory Assay The assays of DNA-PK were performed by Reaction Biology Corporation, One Great Valley Parkway, Suite 2 Malvern, PA 19355 USA. All Compounds were dissolved in DMSO (negative control solvent) and tested for their ability to inhibit human DNA-PK enzyme activity. All synthesized compounds were tested in a 10-dose IC50 profile with 4-fold serial dilutions starting at concentration 100 μM. The control compound, LY294002 was tested in a 10-dose IC50 profile with 3-fold serial dilutions starting at 10 μM concentration. Reactions were carried out using 20 μM peptide substrate [EPPLSQEAFADLWKK], 10 μg/ml DNA and 10 μM ATP using the HTRF assay format.
- Inhibition of PI3K alpha Quantification of ATP to ADP conversion as a measure of PI3Kα activity. Active PI3Kα (Life Technologies), in the presence or absence of PI3Kα inhibitor, was reacted with PIP2:PS (Life Technologies), a substrate specifically optimized for use with Class I PI3 kinases, and ultrapure ATP (Promega). The conversion of ATP to ADP by PI3Kα was measured as luminescence signal via Promega ADP-Glo kinase activity assay. Assay was validated using published PI3Kα inhibitors LY294002, PI-103, BYL719, GDC0198 and also DMSO vehicle control.Compounds were prepared at 100× final concentration as a 12-point, 1:3 serial-dilution in DMSO series, with DMSO control as 12th point. Compound was then diluted in (25 mM HEPES pH 7.5, 1 mM EGTA, 0.3% CHAPS) prior to addition to PI3Kα. Active PI3Kα diluted to 0.24 ng/μL (1.1 nM) in (50 mM HEPES pH 7.5, 6 mM MgCl2, 1 mM EGTA, 200 mM NaCl, 0.03% CHAPS, 8 mM DTT) was incubated with compound for 0 hr and 3 hr prior to the start of the reaction. 25 μM PIP2:PS and 60 μM ATP were diluted from stock in (25 mM HEPES pH 7.5, 1 mM EGTA, 0.3% CHAPS) and added to initiate the PI3Kα reaction. Reaction time was 30 minutes. ATP to ADP conversion was measured in Luminescence Counts on DTX880 Plate Reader (Beckman Coulter). Compound IC50s were reported using GraphPad Prism software. Analytical method was non-linear regression, 4-parameter curve fit with bottom fit to validated PI3Kα inhibitor reference controls and no top fit (floating top).
- pAKT Protocol Inhibition of the PI3K-AKT-mTOR pathway was measured by quantifying the loss of (Ser-473) pAKT using AlphaScreen (Perkin Elmer). B103 (Rat Neuroblastoma) cells were seeded in serum containing medium (High Glucose DMEM (-Phenol Red)+10% FBS+2× Glutamax+1 mM Sodium Pyruvate+10 mM HEPES+1× Non-Essential Amino Acids+1× Pen/Strep) on a 96-well tissue culture treated plate and grown for 20 hours. Cells were then serum starved in serum free medium (High Glucose DMEM (-Phenol Red)+1× Glutamax+1 mM Sodium Pyruvate+1× Pen/Strep) for 6 hours prior to a 2-hour pretreatment with inhibitors of the pathway, including reference inhibitor LY294002. These inhibitors were prepared at a 200× final concentration as a 6-point, 1:3 serial dilution in DMSO series, with DMSO as the 7th point. The inhibitors were then diluted in experimental medium (High Glucose DMEM (-Phenol Red)+1× Glutamax+1 mM Sodium Pyruvate+1× Pen/Strep+25 mM HEPES+0.1% BSA) and combined with the cells at 1× final concentration in 0.5% DMSO. The cells were then stimulated for 20 minutes with (2.5 μg/mL) insulin, an activator of the PI3K-AKT-mTOR pathway and a demonstrated (Ser-473) pAKT agonist. Cells were promptly lysed using Perkin Elmer proprietary lysis buffer and the (Ser-473) pAKT and total AKT contained in the lysate was measured by AlphaScreen. In AlphaScreen, donor beads were coated with streptavidin to capture one of the antibodies, which is biotinylated. Acceptor beads were coated with Protein A to immobilize the other antibody. In the presence of target protein, the two antibodies bring the donor and acceptor beads close together, generating signal. The amount of light emission is directly proportional to the amount of target protein present in the sample. For each inhibitor tested: the ratio of measured (Ser-473) pAKT/totalAKT was plotted in GraphPad Prism as a 7-point, non-linear regression, 4-parameter curve with bottom constrained to reference control bottom and unconstrained top anchored to DMSO.