 BDBM713117 US12351648, Compound 2001 US12195427, Compound 2001
 BDBM253043 US9493447, 2001
 BDBM347091 US10202403, Compound 2001
 BDBM436158 US10590105, Example 2001
 BDBM50594947 VAFIDEMSTAT ORY-2001
 BDBM546320 US11286268, Compound 2001
 US10087167, Compound 2001 BDBM287985
 US10125111, Compound 2001 BDBM298498
 US10131645, Compound 2001 BDBM300782
 US10214534, Compound 2001 BDBM357819
 US10882844, Example 2001 BDBM477024
 US20250230153, Example 2001 BDBM758367
 US9096593, P-2001 BDBM174927
 US9718790, I-2001 BDBM265786
 US8889724, EF BDBM139537
 BDBM292784 US10106501, Example EF
 CAS_124756-23-6 BDBM82518 MDL 73005 EF
 Foscan Temoporfin Mthpc EF9 BDBM50542240 EF-9
 CHEMBL1088073 BDBM50313918 5-Methyl-4,5,6,7-tetrahydroindolo[4,3a,3-ef][3]benzazecine
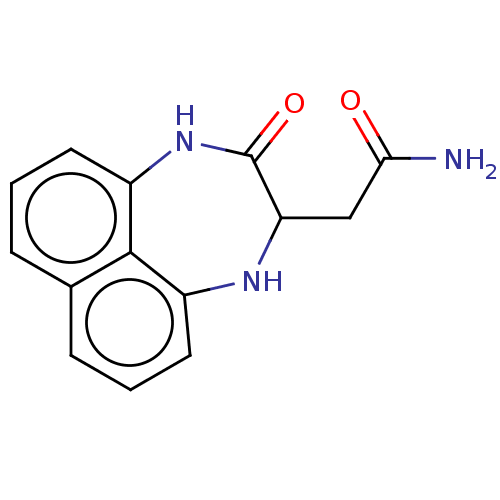 MLS000581924 SMR000200532 2-(3-oxo-1,2,3,4-tetrahydronaphtho[1,8-ef][1,4]diazepin-2-yl)acetamide cid_2963466 BDBM115116
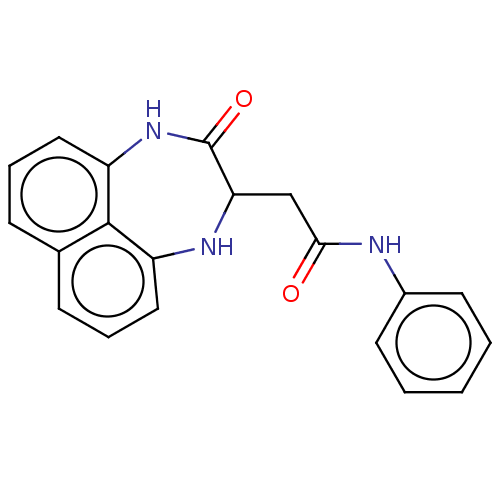 cid_2969438 SMR000201006 2-(3-oxo-1,2,3,4-tetrahydronaphtho[1,8-ef][1,4]diazepin-2-yl)-N-phenylacetamide BDBM54913 MLS000582977
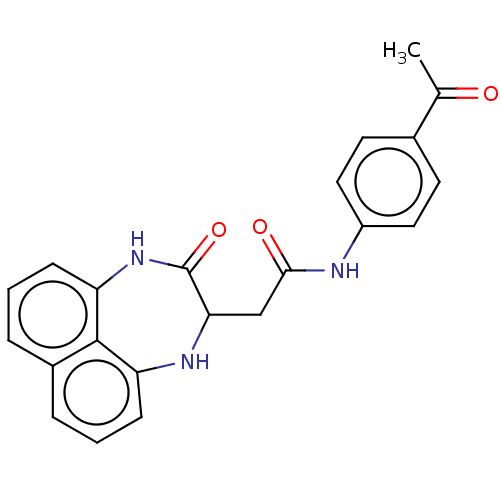 SMR000295212 BDBM50416 cid_2963469 N-(4-acetylphenyl)-2-(3-oxo-1,2,3,4-tetrahydronaphtho[1,8-ef][1,4]diazepin-2-yl)acetamide MLS000664114
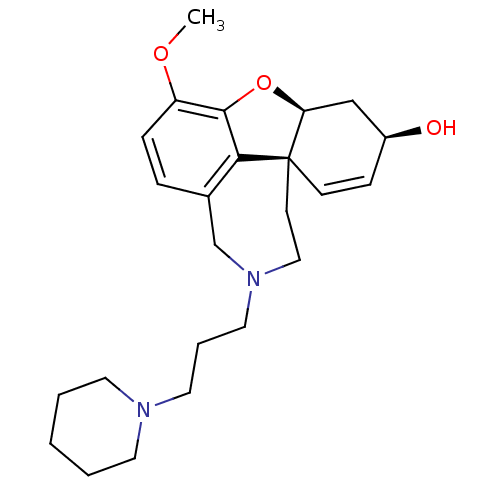 ((4aS,6R,8aS)-4a,5,9,10,11,12-hexahydro-3-methoxy-11-[3-(1-piperidinyl)propyl]-6Hbenzofuro[3a,3,2-ef][2]benzazepin-6-ol (4aS,6R,8aS)-3-methoxy-11-(3-piperidin-1-ylpropyl)-5,6,9,10,11,12-hexahydro-4aH-[1]benzofuro[3a,3,2-ef][2]benzazepin-6-ol CHEMBL569978 BDBM50303761
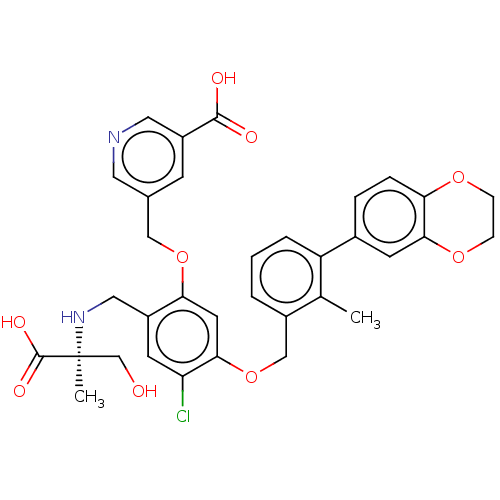 US9850225, Example 2001 BDBM363427 (S)-5-((2-(((2-carboxy-1-hydroxypropan-2-yl)amino)methyl)-4-chloro-5-((3-(2,3-dihydrobenzo[b][1,4]dioxin-6-yl)-2-methylbenzyl)oxy)phenoxy)methyl)nicotinic acid
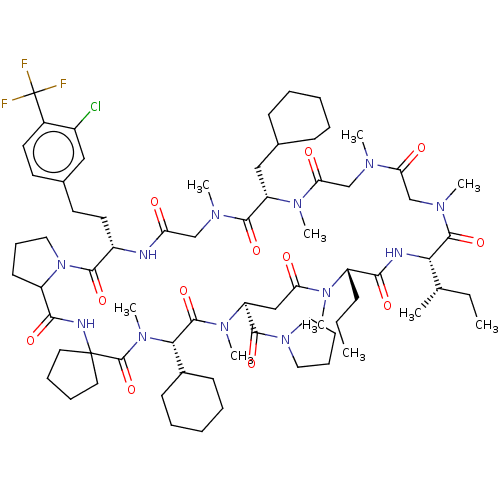 BDBM672674 US20240148821, Compound 2001 (3S,9S,18S,21S,25S,28S,34S)-3-[2-[3-chloro-4-(trifluoromethyl)phenyl]ethyl]-28-cyclohexyl-9-(cyclohexylmethyl)-7,10,13,16,22,26,29-heptamethyl-18-[(1S)-1-methylpropyl]-21-propyl-25-(pyrrolidine-1-carbonyl)spiro[1,4,7,10,13,16,19,22,26,29,32-undecazabicyclo[32.3.0]heptatriacontane-31,1'-cyclopentane]-2,5,8,11,14,17,20,23,27,30,33-undecone
 US9617267, Compound P-2007 US9617267, Compound P-2006 US9617267, Compound P-2008 US9617267, Compound P-2003 US9617267, Compound P-2002 US9617267, Compound P-2013 US9617267, Compound P-2005 BDBM317013 US9617267, Compound P-2004 US9617267, Compound P-2015 US9617267, Compound P-2001 US9617267, Compound P-2012
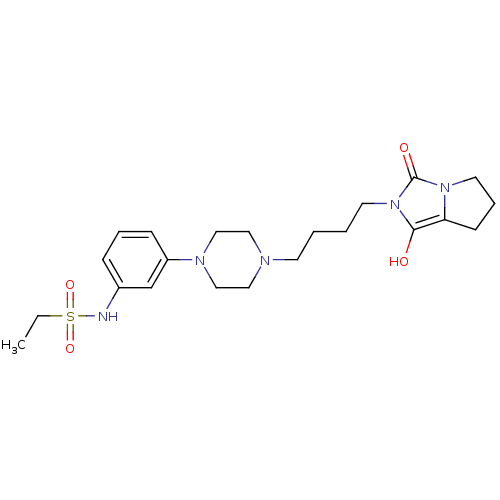 CHEMBL416266 Ethanesulfonic acid (3-{4-[4-(1,3-dioxo-tetrahydro-pyrrolo[1,2-c]imidazol-2-yl)-butyl]-piperazin-1-yl}-phenyl)-amide CHEMBL1204203 Ethanesulfonic acid (3-{4-[4-(1,3-dioxo-tetrahydro-pyrrolo[1,2-c]imidazol-2-yl)-butyl]-piperazin-1-yl}-phenyl)-amide (EF-7412) BDBM50078561
- Li, D; Yu, D; Li, Y; Yang, R A bibliometric analysis of PROTAC from 2001 to 2021. Eur J Med Chem 244: (2022)
- Ishchenko, AV; Shakhnovich, EI SMall Molecule Growth 2001 (SMoG2001): an improved knowledge-based scoring function for protein-ligand interactions. J Med Chem 45: 2770-80 (2002)
- Premkumar, L; Kurth, F; Duprez, W; Grøftehauge, MK; King, GJ; Halili, MA; Heras, B; Martin, JL Structure of the Acinetobacter baumannii dithiol oxidase DsbA bound to elongation factor EF-Tu reveals a novel protein interaction site. J Biol Chem 289: 19869-80 (2014)
- López-Rodríguez, ML; Morcillo, MJ; Fernández, E; Rosado, ML; Orensanz, L; Beneytez, ME; Manzanares, J; Fuentes, JA; Schaper, KJ Design and synthesis of 2-[4-[4-(m-(ethylsulfonamido)-phenyl) piperazin-1-yl]butyl]-1,3-dioxoperhydropyrrolo[1,2-c]imidazole (EF-7412) using neural networks. A selective derivative with mixed 5-HT1A/D2 antagonist properties. Bioorg Med Chem Lett 9: 1679-82 (1999)
- Snyder, SE; Aviles-Garay, FA; Chakraborti, R; Nichols, DE; Watts, VJ; Mailman, RB Synthesis and evaluation of 6,7-dihydroxy-2,3,4,8,9,13b-hexahydro-1H- benzo[6,7]cyclohepta[1,2,3-ef][3]benzazepine, 6,7-dihydroxy- 1,2,3,4,8,12b-hexahydroanthr[10,4a,4-cd]azepine, and 10-(aminomethyl)-9,10- dihydro-1,2-dihydroxyanthracene as conformationally restricted analogs of beta-phenyldopamin J Med Chem 38: 2395-409 (1995)
- Abdelhaleem, EF; Abdelhameid, MK; Kassab, AE; Kandeel, MM Eur J Med Chem 143: 1807-1825 (2018)
- Llano-Sotelo, B; Azucena, EF; Kotra, LP; Mobashery, S; Chow, CS Chem Biol 9: 455-63 (2002)
- Geris, R; Pinho, MA; Boffo, EF; Simpson, TJ J Nat Prod 85: 2236-2250 (2022)
- DiMauro, EF; Altmann, S; Berry, LM; Bregman, H; Chakka, N; Chu-Moyer, M; Bojic, EF; Foti, RS; Fremeau, R; Gao, H; Gunaydin, H; Guzman-Perez, A; Hall, BE; Huang, H; Jarosh, M; Kornecook, T; Lee, J; Ligutti, J; Liu, D; Moyer, BD; Ortuno, D; Rose, PE; Schenkel, LB; Taborn, K; Wang, J; Wang, Y; Yu, V; Weiss, MM J Med Chem 59: 7818-39 (2016)
- Truong, AP; Tóth, G; Probst, GD; Sealy, JM; Bowers, S; Wone, DW; Dressen, D; Hom, RK; Konradi, AW; Sham, HL; Wu, J; Peterson, BT; Ruslim, L; Bova, MP; Kholodenko, D; Motter, RN; Bard, F; Santiago, P; Ni, H; Chian, D; Soriano, F; Cole, T; Brigham, EF; Wong, K; Zmolek, W; Goldbach, E; Samant, B; Chen, L; Zhang, H; Nakamura, DF; Quinn, KP; Yednock, TA; Sauer, JM Bioorg Med Chem Lett 20: 6231-6 (2010)
- Sun, P; Wang, J; Khan, KS; Yang, W; Ng, BW; Ilment, N; Zessin, M; Bülbül, EF; Robaa, D; Erdmann, F; Schmidt, M; Romier, C; Schutkowski, M; Cheng, AS; Sippl, W J Med Chem 65: 16313-16337 (2022)
- Gould, AE; Adams, R; Adhikari, S; Aertgeerts, K; Afroze, R; Blackburn, C; Calderwood, EF; Chau, R; Chouitar, J; Duffey, MO; England, DB; Farrer, C; Forsyth, N; Garcia, K; Gaulin, J; Greenspan, PD; Guo, R; Harrison, SJ; Huang, SC; Iartchouk, N; Janowick, D; Kim, MS; Kulkarni, B; Langston, SP; Liu, JX; Ma, LT; Menon, S; Mizutani, H; Paske, E; Renou, CC; Rezaei, M; Rowland, RS; Sintchak, MD; Smith, MD; Stroud, SG; Tregay, M; Tian, Y; Veiby, OP; Vos, TJ; Vyskocil, S; Williams, J; Xu, T; Yang, JJ; Yano, J; Zeng, H; Zhang, DM; Zhang, Q; Galvin, KM J Med Chem 54: 1836-46 (2011)
- Wenglowsky, S; Ren, L; Ahrendt, KA; Laird, ER; Aliagas, I; Alicke, B; Buckmelter, AJ; Choo, EF; Dinkel, V; Feng, B; Gloor, SL; Gould, SE; Gross, S; Gunzner-Toste, J; Hansen, JD; Hatzivassiliou, G; Liu, B; Malesky, K; Mathieu, S; Newhouse, B; Raddatz, NJ; Ran, Y; Rana, S; Randolph, N; Risom, T; Rudolph, J; Savage, S; Selby, LT; Shrag, M; Song, K; Sturgis, HL; Voegtli, WC; Wen, Z; Willis, BS; Woessner, RD; Wu, WI; Young, WB; Grina, J ACS Med Chem Lett 2: 342-7 (2011)
- Braga, SF; Alves, ÉV; Ferreira, RS; Fradico, JR; Lage, PS; Duarte, MC; Ribeiro, TG; Júnior, PA; Romanha, AJ; Tonini, ML; Steindel, M; Coelho, EF; de Oliveira, RB Eur J Med Chem 71: 282-9 (2014)
- Duff, MR; Gabel, SA; Pedersen, LC; DeRose, EF; Krahn, JM; Howell, EE; London, RE J Med Chem 63: 8314-8324 (2020)
- Huang, H; Guzman-Perez, A; Acquaviva, L; Berry, V; Bregman, H; Dovey, J; Gunaydin, H; Huang, X; Huang, L; Saffran, D; Serafino, R; Schneider, S; Wilson, C; DiMauro, EF ACS Med Chem Lett 4: 1218-23 (2013)
- Weiss, M; Boezio, A; Boezio, C; Butler, JR; Chu-Moyer, MY; Dimauro, EF; Dineen, T; Graceffa, R; Guzman-Perez, A; Huang, H; Kreiman, C; La, D; Marx, IE; Milgrim, BC; Nguyen, HN; Peterson, E; Romero, K; Sparling, B US Patent US9212182 (2015)
- Kalir, A; Teomy, S; Amir, A; Fuchs, P; Lee, SA; Holsztynska, EJ; Rocki, W; Domino, EF J Med Chem 27: 1267-71 (1984)
- Elslager, EF; Hutt, MP; Jacob, P; Johnson, J; Temporelli, B; Werbel, LM; Worth, DF; Rane, L J Med Chem 22: 1247-57 (1979)
- El-Sayed, NF; El-Hussieny, M; Mansour, ST; Fouad, MA; Saad, MA; Ewies, EF Eur J Med Chem 276:
- Kudzma, LV; Evans, SM; Turnbull, SP; Severnak, SA; Ezell, EF Bioorg Med Chem Lett 5: 1177-1182 (1995)
- Arris, CE; Boyle, FT; Calvert, AH; Curtin, NJ; Endicott, JA; Garman, EF; Gibson, AE; Golding, BT; Grant, S; Griffin, RJ; Jewsbury, P; Johnson, LN; Lawrie, AM; Newell, DR; Noble, ME; Sausville, EA; Schultz, R; Yu, W J Med Chem 43: 2797-804 (2000)
- Bradner, JE; West, N; Grachan, ML; Greenberg, EF; Haggarty, SJ; Warnow, T; Mazitschek, R Nat Chem Biol 6: 238-243 (2010)
- Urbanczyk-Lipkowska, Z; Lipkowski, AW; Etter, MC; Hahn, EF; Pasternak, GW; Portoghese, PS J Med Chem 30: 1489-94 (1987)
- Janssen, BJ; Halff, EF; Lambris, JD; Gros, P J Biol Chem 282: 29241-7 (2007)
- Appelt, K; Bacquet, RJ; Bartlett, CA; Booth, CL; Freer, ST; Fuhry, MA; Gehring, MR; Herrmann, SM; Howland, EF; Janson, CA J Med Chem 34: 1925-34 (1991)
- Tang, YS; Zhang, C; Lo, CY; Jin, Z; Kong, BL; Xiao, MJ; Huang, EF; Hu, C; Shaw, PC Eur J Med Chem 260:
- Akritopoulou-Zanze, I; Wakefield, BD; Gasiecki, A; Kalvin, D; Johnson, EF; Kovar, P; Djuric, SW Bioorg Med Chem Lett 21: 1480-3 (2011)
- Tawfik, HO; Saleh, MM; Ammara, A; Khaleel, EF; Badi, R; Khater, YTT; Rasheed, RA; Attia, AA; Hefny, SM; Elkaeed, EB; Nocentini, A; Supuran, CT; Eldehna, WM; Shaldam, MA J Med Chem 67: 1611-1623
- Satoh, Y; Stanton, JL; Hutchison, AJ; Libby, AH; Kowalski, TJ; Lee, WH; White, DH; Kimble, EF J Med Chem 36: 3580-94 (1994)
- Chantigny, YA; Murray, JC; Kleinman, EF; Robinson, RP; Plotkin, MA; Reese, MR; Buckbinder, L; McNiff, PA; Millham, ML; Schaefer, JF; Abramov, YA; Bordner, J J Med Chem 58: 2658-77 (2015)
- Sleebs, BE; Kersten, WJ; Kulasegaram, S; Nikolakopoulos, G; Hatzis, E; Moss, RM; Parisot, JP; Yang, H; Czabotar, PE; Fairlie, WD; Lee, EF; Adams, JM; Chen, L; van Delft, MF; Lowes, KN; Wei, A; Huang, DC; Colman, PM; Street, IP; Baell, JB; Watson, K; Lessene, G J Med Chem 56: 5514-40 (2014)
- Neves, BJ; Dantas, RF; Senger, MR; Melo-Filho, CC; Valente, WC; de Almeida, AC; Rezende-Neto, JM; Lima, EF; Paveley, R; Furnham, N; Muratov, E; Kamentsky, L; Carpenter, AE; Braga, RC; Silva-Junior, FP; Andrade, CH J Med Chem 59: 7075-88 (2016)
- Stachel, SJ; Coburn, CA; Steele, TG; Jones, KG; Loutzenhiser, EF; Gregro, AR; Rajapakse, HA; Lai, MT; Crouthamel, MC; Xu, M; Tugusheva, K; Lineberger, JE; Pietrak, BL; Espeseth, AS; Shi, XP; Chen-Dodson, E; Holloway, MK; Munshi, S; Simon, AJ; Kuo, L; Vacca, JP J Med Chem 47: 6447-50 (2004)
- Marques, EF; Bueno, MA; Duarte, PD; Silva, LR; Martinelli, AM; dos Santos, CY; Severino, RP; Brömme, D; Vieira, PC; Corrêa, AG Eur J Med Chem 54: 10-21 (2012)
- Mathew, J; Ding, S; Kunz, KA; Stacy, EE; Butler, JH; Haney, RS; Merino, EF; Butschek, GJ; Rizopoulos, Z; Totrov, M; Cassera, MB; Carlier, PR ACS Med Chem Lett 13: 365-370 (2022)
- Ott, GR; Cheng, M; Learn, KS; Wagner, J; Gingrich, DE; Lisko, JG; Curry, M; Mesaros, EF; Ghose, AK; Quail, MR; Wan, W; Lu, L; Dobrzanski, P; Albom, MS; Angeles, TS; Wells-Knecht, K; Huang, Z; Aimone, LD; Bruckheimer, E; Anderson, N; Friedman, J; Fernandez, SV; Ator, MA; Ruggeri, BA; Dorsey, BD J Med Chem 59: 7478-96 (2016)
- Wang, S; Zhao, LJ; Zheng, YC; Shen, DD; Miao, EF; Qiao, XP; Zhao, LJ; Liu, Y; Huang, R; Yu, B; Liu, HM Eur J Med Chem 125: 940-951 (2017)
- Lim, J; Altman, MD; Baker, J; Brubaker, JD; Chen, H; Chen, Y; Kleinschek, MA; Li, C; Liu, D; Maclean, JK; Mulrooney, EF; Presland, J; Rakhilina, L; Smith, GF; Yang, R Bioorg Med Chem Lett 25: 5384-8 (2015)
- Howard, S; Berdini, V; Boulstridge, JA; Carr, MG; Cross, DM; Curry, J; Devine, LA; Early, TR; Fazal, L; Gill, AL; Heathcote, M; Maman, S; Matthews, JE; McMenamin, RL; Navarro, EF; Oamppound39Brien, MA; Oamppound39Reilly, M; Rees, DC; Reule, M; Tisi, D; Williams, G; Vinković, M; Wyatt, PG J Med Chem 52: 379-88 (2009)
- Marquis, RW; Lago, AM; Callahan, JF; Rahman, A; Dong, X; Stroup, GB; Hoffman, S; Gowen, M; DelMar, EG; Van Wagenen, BC; Logan, S; Shimizu, S; Fox, J; Nemeth, EF; Roethke, T; Smith, BR; Ward, KW; Bhatnagar, P J Med Chem 52: 6599-605 (2009)
- Renes, J; de Vries, EG; Nienhuis, EF; Jansen, PL; Müller, M Br J Pharmacol 126: 681-8 (1999)
- Bello, AM; Konforte, D; Poduch, E; Furlonger, C; Wei, L; Liu, Y; Lewis, M; Pai, EF; Paige, CJ; Kotra, LP J Med Chem 52: 1648-58 (2009)
- Stilz, HU; Jablonka, B; Just, M; Knolle, J; Paulus, EF; Zoller, G J Med Chem 39: 2118-22 (1996)
- Almeida, LE; Pereira, EF; Camara, AL; Maelicke, A; Albuquerque, EX Bioorg Med Chem Lett 14: 1879-87 (2004)
- Queiroz, MM; Queiroz, EF; Zeraik, ML; Ebrahimi, SN; Marcourt, L; Cuendet, M; Castro-Gamboa, I; Hamburger, M; da Silva Bolzani, V; Wolfender, JL J Nat Prod 77: 650-6 (2014)
- Hao, J; Dehlinger, V; Fivush, AM; Rudyk, HC; Britton, TC; Hollinshead, SP; Vokits, BP; Clark, BP; Henry, SS; Massey, SM; Peng, L; Dressman, BA; Heinz, BA; Roberts, EF; Bracey-Walker, MR; Swanson, S; Catlow, JT; Love, PL; Tepool, AD; Peters, SC; Simmons, RM; Iyengar, S; McKinzie, DL; Monn, JA Bioorg Med Chem Lett 23: 1249-52 (2013)
- Graham, DW; Ashton, WT; Barash, L; Brown, JE; Brown, RD; Canning, LF; Chen, A; Springer, JP; Rogers, EF J Med Chem 30: 1074-90 (1987)
- Yang, Z; Nantermet, PG; Kreatsoulas, C; Moore, KP; Shalen, EF US Patent US9193697 (2015)
- Takeuchi, Y; Shands, EF; Beusen, DD; Marshall, GR J Med Chem 41: 3609-23 (1998)
- Averina, EB; Vasilenko, DA; Gracheva, YA; Grishin, YK; Radchenko, EV; Burmistrov, VV; Butov, GM; Neganova, ME; Serkova, TP; Redkozubova, OM; Shevtsova, EF; Milaeva, ER; Kuznetsova, TS; Zefirov, NS Bioorg Med Chem 24: 712-20 (2016)
- Mantell, SJ; Stephenson, PT; Monaghan, SM; Maw, GN; Trevethick, MA; Yeadon, M; Walker, DK; Selby, MD; Batchelor, DV; Rozze, S; Chavaroche, H; Lemaitre, A; Wright, KN; Whitlock, L; Stuart, EF; Wright, PA; Macintyre, F Bioorg Med Chem Lett 19: 4471-5 (2009)
- Jin, J; Budzik, B; Wang, Y; Shi, D; Wang, F; Xie, H; Wan, Z; Zhu, C; Foley, JJ; Webb, EF; Berlanga, M; Burman, M; Sarau, HM; Morrow, DM; Moore, ML; Rivero, RA; Palovich, M; Salmon, M; Belmonte, KE; Lainé, DI J Med Chem 51: 5915-8 (2008)
- Ali, FE; Chang, HL; Huffman, WF; Heckman, G; Kinter, LB; Weidley, EF; Edwards, R; Schmidt, D; Ashton-Shue, D; Stassen, FL J Med Chem 30: 2291-4 (1987)
- Zimmermann, SC; Wolf, EF; Luu, A; Thomas, AG; Stathis, M; Poore, B; Nguyen, C; Le, A; Rojas, C; Slusher, BS; Tsukamoto, T ACS Med Chem Lett 7: 520-4 (2016)
- Mohamed, FAM; Alakilli, SYM; El Azab, EF; Baawad, FAM; Shaaban, EIA; Alrub, HA; Hendawy, O; Gomaa, HAM; Bakr, AG; Abdelrahman, MH; Trembleau, L; Mohammed, AF; Youssif, BGM RSC Med Chem 14: 734-744 (2023)
- Silva-Júnior, EF; Silva, EPS; França, PHB; Silva, JPN; Barreto, EO; Silva, EB; Ferreira, RS; Gatto, CC; Moreira, DRM; Siqueira-Neto, JL; Mendonça-Júnior, FJB; Lima, MCA; Bortoluzzi, JH; Scotti, MT; Scotti, L; Meneghetti, MR; Aquino, TM; Araújo-Júnior, JX Bioorg Med Chem 24: 4228-4240 (2016)
- Dayal, N; Mikek, CG; Hernandez, D; Naclerio, GA; Yin Chu, EF; Carter-Cooper, BA; Lapidus, RG; Sintim, HO Eur J Med Chem 180: 449-456 (2019)
- Antunes, JE; Freitas, MP; da Cunha, EF; Ramalho, TC; Rittner, R Bioorg Med Chem 16: 7599-606 (2008)
- Carvalho, SA; Feitosa, LO; Soares, M; Costa, TE; Henriques, MG; Salomão, K; de Castro, SL; Kaiser, M; Brun, R; Wardell, JL; Wardell, SM; Trossini, GH; Andricopulo, AD; da Silva, EF; Fraga, CA Eur J Med Chem 54: 512-21 (2012)
- da Silva-Júnior, EF; de Araújo-Júnior, JX Bioorg Med Chem 27: 3963-3978 (2019)
- Pharmacological Assay Gamma-secretase activity was determined as described by Zhang et al. (Biochemistry, 40(16), 5049-5055, 2001).
- ChEMBL_675038 (CHEMBL1272772) Inhibition of Influenza A virus (A/chicken/Korea/01310/2001 (H9N2)) neuraminidase after 30 mins by spectrofluorimetric analysis
- FLIPR Ca2+ Flux Assay Assay methodology using FLIPR Ca2+ Flux Assay (Okumura et al., Biochem. Biophys. Res. Comm. 280:976-981, 2001).
- ChEMBL_1743512 (CHEMBL4178022) Inhibition of Cryptosporidium parvum calcium/calmodulin dependent protein kinase with a kinase domain and 4 calmodulin like EF hands
- ChEMBL_1743510 (CHEMBL4178020) Inhibition of Cryptosporidium parvum Iowa II calcium/calmodulin-dependent protein kinase with a kinase domain and 4 calmodulin like EF hands
- ChEMBL_1743513 (CHEMBL4178023) Inhibition of Cryptosporidium parvum Iowa II calcium/calmodulin-dependent protein kinase with a kinase domain and 2 calmodulin-like EF hands
- ChEMBL_1710931 (CHEMBL4120980) Inhibition of Influenza B virus (B/Perth/211/2001) neuraminidase activity using 4-MUNANA as substrate measured every min for 60 mins by fluorescence assay
- ChEMBL_935174 (CHEMBL2317336) Inhibition of influenza A virus (A/Guangdong/376/2001(H1N1)) neuraminidase infected in chick embryo using MUNANA as substrate after 1 hr by spectrophotometric analysis
- ChEMBL_1710933 (CHEMBL4120982) Inhibition of Influenza B virus (B/Perth/211/2001) neuraminidase D197E mutant activity using 4-MUNANA as substrate measured every min for 60 mins by fluorescence assay
- ChEMBL_1710932 (CHEMBL4120981) Inhibition of Influenza B virus (B/Perth/211/2001) neuraminidase activity using 4-MUNANA as substrate preincubated for 60 mins followed by substrate addition measured every min for 60 mins by fluorescence assay
- ChEMBL_1710934 (CHEMBL4120983) Inhibition of Influenza B virus (B/Perth/211/2001) neuraminidase D197E mutant activity using 4-MUNANA as substrate preincubated for 60 mins followed by substrate addition measured every min for 60 mins by fluorescence assay
- ligand sensing assay (LiSA) As used herein, reference to the activity of an LXR agonist at LXRα and LXRβ refer to the activity as measured using the ligand sensing assay (LiSA) described in Spencer et al. Journal of Medicinal Chemistry 2001, 44, 886-897, incorporated herein by reference.
- Receptor Selection and Amplification Technology R-SAT assays were performed as described previously (Weiner et al., 2001), with the following modifications. In brief, NIH-3T3 cells were grown to 80% confluence in Dulbecco s modified Eagle s medium (DMEM) supplemented with 10% bovine calf serum (Hyclone Laboratories, Logan, UT) and 1% penicillin/streptomycin/glutamine (Invitrogen, Carlsbad, CA).
- Isothermal Titration Calorimetry (ITC) Synthetic peptides were purchased from Genicbio Ltd. Peptides were dissolved in 25 mM HEPES, pH 7.4, 100 mM NaCl (ITC buffer) to obtain 4 mM stock solutions, which were flash-frozen and stored at −80 °C. The isothermal titration experiments were performed using either a MicrocalTm ITC200 or an autoITC200 (GE Healthcare). The syringe was loaded with titrant peptide at concentrations of 2 or 4 mM (DsbB P2 peptide) or 200 μM (EF-Tu switch I peptide). The sample cell was loaded with oxidized AbDsbA with concentrations of 100 μM (for titrations with DsbB P2 peptide) or oxidized/reduced/mixed AbDsbA of 10 μM (for titrations with EF-Tu switch I peptide) in ITC buffer. To assess whether EF-Tu switch I peptide competes for the DsbB P2 peptide binding site, 100 μM oxidized AbDsbA was incubated with 125 μM EF-Tu switch I peptide for 60 min in ITC buffer before titration with DsbB P2 peptide at 2 mM concentration as described above. Titrations were executed at 25 °C using 19 titrations of 2 μl each separated by 180 s and at a constant stirring speed of 1000 rpm. A pre-injection of 0.5 μl was performed to limit slow diffusion of titrant into the cell before the titration, and the corresponding data point was removed from subsequent analysis.
- Inhibition Assay NSC-87877 ranked among top 10% (175th) of the compounds with the best GLIDE scores for the docking to the human Shp2 PTP domain in our virtual screening of 2368 3D structures derived from the NCI Diversity Set. Computer docking of NSC-87877 (FIG. 2) suggested that the B-ring sulfonic acid group forms hydrogen bond with the backbone NH group of Arg-465. Arg-465 is a conserved residue in the PTP signature motif (motif 9) VHCSXGXGR[T/S]G located at the base of the PTP catalytic cleft (Andersen et al., 2001). The A-ring sulfonic acid forms hydrogen bonds with the side-chain NH3 group of Lys-280 and the side-chain NH2 group of Asn-281. Lys-280/Asn-281 are non-conserved PTP residues located adjacent to the phosphotyrosine recognition loop (motif 1) (Andersen et al., 2001). The interaction between aromatic rings of the compound and the protein contributes to the binding through hydrophobic stabilization.
- In Vitro Electrophysiological Analysis of the Human TASK-1 and TASK-3 Channels Via Two-Electrode Voltage Clamp Technique in Xenopus laevis Oocytes Xenopus laevis oocytes were selected as described elsewhere by way of illustration [Decher et al., FEBS Lett. 492, 84-89 (2001)]. Subsequently, the oocytes were injected with 0.5-5 ng of a cRNA solution coding for TASK-1 or TASK-3. For the electrophysiological analysis of the channel proteins expressed in the oocytes, the two-electrode voltage clamp technique [St hmer, Methods Enzymol. 207, 319-339 (1992)] was used. The measurements were conducted as described [Decher et al., FEBS Lett. 492, 84-89 (2001)] at room temperature (21-22° C.) using a Turbo TEC 10CD amplifier (NPI), recorded at 2 kHz and filtered with 0.4 kHz. Substance administration was performed using a gravitation-driven perfusion system. Here, the oocyte is located in a measuring chamber and exposed to the solvent stream of 10 ml/min. The level in the measuring chamber is monitored and regulated by sucking off the solution using a peristaltic pump.
- In Vitro Electrophysiological Assay Table 1: In Vitro Electrophysiological Analysis of the Human TASK-1 and TASK-3 Channels Via Two-Electrode Voltage Clamp Technique in Xenopus laevis Oocytes. Xenopus laevis oocytes were selected as described elsewhere by way of illustration [Decher et al., FEBS Lett. 492, 84-89 (2001)]. Subsequently, the oocytes were injected with 0.5-5 ng of a cRNA solution coding for TASK-1 or TASK-3. For the electrophysiological analysis of the channel proteins expressed in the oocytes, the two-electrode voltage clamp technique [St hmer, Methods Enzymol. 207, 319-339 (1992)] was used. The measurements were conducted as described [Decher et al., FEBS Lett. 492, 84-89 (2001)] at room temperature (21-22° C.) using a Turbo TEC 10CD amplifier (NPI), recorded at 2 kHz and filtered with 0.4 kHz. Substance administration was performed using a gravitation-driven perfusion system. Here, the oocyte is located in a measuring chamber and exposed to the solution stream of 10 ml/min. The level in the measuring chamber is monitored and regulated by sucking off the solution using a peristaltic pump.
- Binding Assay The ability of a test compound to bind to the P2Y12 receptor was evaluated in a recombinant cell membrane binding assay. In this competitive binding assay, the test compound competed against a radiolabeled agonist for binding to the P2Y12 receptor, expressed on the cell membrane. Inhibition of binding of the labeled material was measured and correlated to the amount and potency of the test compound. This binding assay is a modification of the procedure described by Takasaki, J. et. al, Mol. Pharmacol., 2001, Vol. 60, pg. 432.
- In Vitro Binding Assay Compounds were evaluated for binding to the human ether-a-go-go potassium channel (hERG) expressed in HEK293 cells by displacement of 3[H]-astemizole according to the methods by Finlayson et al. (K. Finlayson., L. Turnbull, C. T. January, J. Sharkey, J. S. Kelly; [3H]Dofetilide binding to HERG transfected membranes: a potential high throughput preclinical screen. Eur. J. Pharmacol. 2001, 430, 147-148). Compounds were incubated at 1 or 10 μM final concentration, in duplicate, and the amount of displaced 3[H]-astemizole determined by liquid scintillation spectroscopy. In some cases, a seven concentration (each concentration in duplicate) displacement curve was generated to determine an IC50.
- Binding Assay Methods for performing in vitro dopamine receptor binding studies are described in Huang et al. J. Med. Chem. 44:1815-1826 (2001) and Luedtke et al. Synapse 38:438-439 (2000). These papers describe radioactively labeled dopamine receptor selective ligands binding with picomolar affinity and nonselectivity to D2 and D3 dopamine receptors expressed in Sf9 and HEK 293 cells. 125I-IABN binds with 7- to 10-fold lower affinity to human D4.4 dopamine receptors expressed in HEK 293 cells. Dissociation constants (Kd) calculated from kinetic experiments were found to be in agreement with equilibrium Kd values obtained from saturation binding studies. Saturation plots of the binding of 125I-IABN with rat caudate membrane preparations were monophasic and exhibited low nonspecific binding.
- Binding Assay SSTR5 binding assays can be performed by labeling somatostatin and determining the ability of a compound to inhibit somatostatin binding. (Poitout et al., J. Med. Chem. 44:29900-3000, (2001); Hocart et al., J. Med. Chem. 41:1146-1154, (1998); J. Med. Chem. 50, 6292-6295 (2007) and J. Med. Chem. 50, 6295-6298 (2007)). Binding assays were performed using (3-125I-Tyr11)-SRIF-14 or (3-125I-Tyr11)-SRIF-28 as the radioligand (used at 0.1 nM) and The Packard Unifilter assay plate. The assay buffer consisted of 50 mM TrisHCl (pH 7.8) with 1 mM EGTA, 5 in M MgCl2, leupeptin (10 μg/mL), pepstatin (10 μg/mL), bacitracin (200 μg/mL), and aprotinin (0.5 μg/mL).
- Fluorescence Based Assay ThermoFluor is a fluorescence based assay that estimates ligand binding affinities by measuring the effect of a ligand on protein thermal stability (Pantoliano, M. W., Petrella, E. C., Kwasnoski, J. D., Lobanov, V. S., Myslik, J., Graf, E., Carver, T., Asel, E., Springer, B. A., Lane, P., and Salemme, F. R. (2001) High-density miniaturized thermal shift assays as a general strategy for drug discovery. J Biomol Screen 6, 429-40, and Matulis, D., Kranz, J. K., Salemme, F. R., and Todd, M. J. (2005) Thermodynamic stability of carbonic anhydrase: measurements of binding affinity and stoichiometry using ThermoFluor. Biochemistry 44, 5258-66). This approach is applicable to a wide variety of systems, and rigorous in theoretical interpretation through quantitation of equilibrium binding constants (KD).
- Fluorescence Polarization Assay Fluorescence polarization experiments were conducted on a Photon Technology International instrument using a 0.3 cm path length cuvette. Spectra were measured at 25 deg C using 10.0 nm slit widths. Excitation at 495 nm was used for the fluorescein-containing peptide Fl-Bak and the emission maximum at 535 nm was monitored. Polarization measurements were recorded upon titration of inhibitors at varying concentrations into a solution of Fl-Bak and Bcl-xL. Regression analysis was carried out using SigmaPlot 2001 (Systat Co.) ligand binding macro module. Experimental data were fitted to determine the IC50 values, which can be related to the known affinity of the 16-mer Bak peptide (Kd =120 nM) to acquire the inhibitory constant Ki.
- NMR Spectroscopy Assay NMR spectroscopy validation of lead compounds. In embodiments of the present invention, and during development thereof, NMR spectroscopy: saturation transfer difference (STD), competition STD, and WaterLOGSY experiments to validate binding of compounds to menin. STD provides a reliable method, based on principles vastly different form fluorescence that is commonly used for drug screening (e.g. by pharmaceutical companies). The principle of the STD experiment is based on the transfer of magnetization from a protein to a small molecule. Such a transfer occurs only when the ligand-protein contact is direct, and can be detected when the ligand is in fast exchange between bound and unbound state (Mayer & Meyer. J Am Chem Soc., 2001. 123(25): p. 6108-17., herein incorporated by reference in its entirety). The difference spectrum of the ligand recorded with and without protein saturation is analyzed.
- ELISA Assay Streptavidin-coated 96-well plates are used to immobilise a biotin-tagged IP3 p53-derived peptide (MPRFMDYWEGLN). This is a peptide analogue derived from the p53 binding site for MDM2 (QETFSDLWKLLP). IP3 has a higher affinity for MDM2 than the native peptide and has been used elsewhere to identify antagonists of the binding between MDM2 and p53 (Stoll et al 2001). Aliquots of MDM2 generated by in vitro translation are pre-incubated for 20 minutes at room temperature (i.e. 20-25C.) with test compounds and controls, before transfer into the IP3-coated 96-well plates. Following a further incubation period of 90 minutes at 4C., the plates are washed to remove unbound MDM2 and the residual bound MDM2 is detected using a primary monoclonal antibody (MDM2 Ab-1, clone IF2, Oncogene Research Products) and HRP-conjugated secondary antibody (Goat anti-mouse, Dako PO447).
- BACE Enzyme Assay (Ex.434) Inhibitory activity of compounds was assessed by a fluorescence quench assay of BACE activity using commercially available substrate HiLyte Fluor 488-Glu-Val-Asn-Leu-Asp-Ala-Glu-Phe-Lys-(QXLT 520)-OH (AnaSpec, San Jose, Calif.) and truncated human beta-secretase (residues 1-458, His6-tagged at the C-terminus) expressed in insect cells D. melanogaster S2 using a baculovirus expression system (Mallender et al., Characterization of recombinant, soluble beta-secretase from an insect cell expression system., Mol Pharmacol 59:619-26, 2001). The assay was performed at room temperature in 96-well white opaque Optiplates aque Optiplates (PerkinElmer, Waltham, Mass.) in a total volume of 200 ul of the incubation mixture containing 50 mM sodium acetate buffer, pH 4.5, 0.4 uM FRET substrate, 2.4 nM enzyme, 5% DMSO, and 0.05% Brij-35. The tested compounds were serially diluted in DMSO and pre-incubated with the substrate. The reaction was started by addition of enzyme.
- Dose respone, multiplexed high-throughput screen for small molecule regulators of RGS family protein interactions, specifically RGS16-Galphao. University of New Mexico Assay Overview: Assay Support: NIH R21NS057014 HTS to identify small molecule regulators of RGS family protein interactions PI: Richard Neubig, Ph.D. Assay Implementation: Yang Wu Ph.D., Mark Haynes Ph.D., Anna Waller Ph.D., Mark Carter MS Target Team Leader for the Center: Larry Sklar, Ph.D., (lsklar@salud.unm.edu) Assay Background and Significance: Regulators of G protein signaling (RGS) proteins are a diverse set of intracellular proteins that modulate G protein-coupled receptor (GPCR) signaling [Neitzel and Hepler, 2006]. Their diversity is a result of their localized tissue distribution as well as their preferential regulation of a particular subunit of G protein (Galpha) [Zhong and Neubig, 2001; Neubig and Siderovski, 2002]. Following activation by ligand-bound GPCRs, the Galpha subunit undergoes rapid GTP - GDP exchange, and subsequently dissociates from both the GPCR and the G protein beta-gamma subunit (Gbg). Active GTP-bound Galpha (Galpha-GTP)
- Dose respone, multiplexed high-throughput screen for small molecule regulators of RGS family protein interactions, specifically RGS8-Galphao. University of New Mexico Assay Overview: Assay Support: NIH R21NS057014 HTS to identify small molecule regulators of RGS family protein interactions PI: Richard Neubig, Ph.D. Assay Implementation: Yang Wu Ph.D., Mark Haynes Ph.D., Anna Waller Ph.D., Mark Carter MS Target Team Leader for the Center: Larry Sklar, Ph.D., (lsklar@salud.unm.edu) Assay Background and Significance: Regulators of G protein signaling (RGS) proteins are a diverse set of intracellular proteins that modulate G protein-coupled receptor (GPCR) signaling [Neitzel and Hepler, 2006]. Their diversity is a result of their localized tissue distribution as well as their preferential regulation of a particular subunit of G protein (Galpha) [Zhong and Neubig, 2001; Neubig and Siderovski, 2002]. Following activation by ligand-bound GPCRs, the Galpha subunit undergoes rapid GTP - GDP exchange, and subsequently dissociates from both the GPCR and the G protein beta-gamma subunit (Gbg). Active GTP-bound Galpha (Galpha-GTP)
- Dose response, multiplexed high-throughput screen for small molecule regulators of RGS family protein interactions, specifically RGS19-Galphao. University of New Mexico Assay Overview: Assay Support: NIH R21NS057014 HTS to identify small molecule regulators of RGS family protein interactions PI: Richard Neubig, Ph.D. Assay Implementation: Yang Wu Ph.D., Mark Haynes Ph.D., Anna Waller Ph.D., Mark Carter MS Target Team Leader for the Center: Larry Sklar, Ph.D., (lsklar@salud.unm.edu) Assay Background and Significance: Regulators of G protein signaling (RGS) proteins are a diverse set of intracellular proteins that modulate G protein-coupled receptor (GPCR) signaling [Neitzel and Hepler, 2006]. Their diversity is a result of their localized tissue distribution as well as their preferential regulation of a particular subunit of G protein (Galpha) [Zhong and Neubig, 2001; Neubig and Siderovski, 2002]. Following activation by ligand-bound GPCRs, the Galpha subunit undergoes rapid GTP - GDP exchange, and subsequently dissociates from both the GPCR and the G protein beta-gamma subunit (Gbg). Active GTP-bound Galpha (Galpha-GTP)
- Dose response, multiplexed high-throughput screen for small molecule regulators of RGS family protein interactions, specifically RGS4-Galphao. University of New Mexico Assay Overview: Assay Support: NIH R21NS057014 HTS to identify small molecule regulators of RGS family protein interactions PI: Richard Neubig, Ph.D. Assay Implementation: Yang Wu Ph.D., Mark Haynes Ph.D., Anna Waller Ph.D., Mark Carter MS Target Team Leader for the Center: Larry Sklar, Ph.D., (lsklar@salud.unm.edu) Assay Background and Significance: Regulators of G protein signaling (RGS) proteins are a diverse set of intracellular proteins that modulate G protein-coupled receptor (GPCR) signaling [Neitzel and Hepler, 2006]. Their diversity is a result of their localized tissue distribution as well as their preferential regulation of a particular subunit of G protein (Galpha) [Zhong and Neubig, 2001; Neubig and Siderovski, 2002]. Following activation by ligand-bound GPCRs, the Galpha subunit undergoes rapid GTP - GDP exchange, and subsequently dissociates from both the GPCR and the G protein beta-gamma subunit (Gbg). Active GTP-bound Galpha (Galpha-GTP)
- Dose response, multiplexed high-throughput screen for small molecule regulators of RGS family protein interactions, specifically RGS7-Galphao. University of New Mexico Assay Overview: Assay Support: NIH R21NS057014 HTS to identify small molecule regulators of RGS family protein interactions PI: Richard Neubig, Ph.D. Assay Implementation: Yang Wu Ph.D., Mark Haynes Ph.D., Anna Waller Ph.D., Mark Carter MS Target Team Leader for the Center: Larry Sklar, Ph.D., (lsklar@salud.unm.edu) Assay Background and Significance: Regulators of G protein signaling (RGS) proteins are a diverse set of intracellular proteins that modulate G protein-coupled receptor (GPCR) signaling [Neitzel and Hepler, 2006]. Their diversity is a result of their localized tissue distribution as well as their preferential regulation of a particular subunit of G protein (Galpha) [Zhong and Neubig, 2001; Neubig and Siderovski, 2002]. Following activation by ligand-bound GPCRs, the Galpha subunit undergoes rapid GTP - GDP exchange, and subsequently dissociates from both the GPCR and the G protein beta-gamma subunit (Gbg). Active GTP-bound Galpha (Galpha-GTP)
- Enzyme Inhibition Assay For enzymology studies of these compounds, recombinant guinea pig liver TGase was expressed in Escherichia coli and effectively purified (Gillet, S. M. F. G. et al J. N., Prot. Exp. & Purif. 2004, 33, 256). In addition to being easy to obtain in excellent yield and solubility, guinea pig liver TGase was chosen because it shows 80% homology with human tissue TGase (Aeschlimann, D.; Paulsson, M., Throm. Haemost. 1994, 71, 402) and may thus serve as a model for the evaluation of inhibitors of potential therapeutic utility.The IC50 values of synthetic analogues 14a-38a were determined from inhibition of the reaction of 54.4 mM of the chromogenic TGase substrate N-Cbz-Glu( -p-nitrophenyl ester)Gly with 0.010 U of recombinant guinea pig liver TGase as previously reported (Leblanc, A.; Gravel, C.; Labelle, J.; Keillor, J. W. Biochemistry 2001, 40, 8335) and described in detail in the Materials section below. The mode of inhibition was determined for the representative lead compound.
- FLIPR Ca2+ Flux Assay The utility of the compounds in accordance with the present invention as orexin receptor OX1R and/or OX2R antagonists may be readily determined without undue experimentation by methodology well known in the art, including the FLIPR Ca2+ Flux Assay (Okumura et al., Biochem. Biophys. Res. Comm. 280:976-981, 2001). In a typical experiment the OX1 and OX2 receptor antagonistic activity of the compounds of the present invention was determined in accordance with the following experimental method. For intracellular calcium measurements, Chinese hamster ovary (CHO) cells expressing the rat orexin-1 receptor or the human orexin-2 receptor, are grown in Iscove's modified DMEM containing 2 mM L-glutamine, 0.5 g/ml G418, 1% hypoxanthine-thymidine supplement, 100 U/ml penicillin, 100 ug/ml streptomycin and 10% heat-inactivated fetal calf serum (FCS). The cells are seeded at 20,000 cells/well into Becton-Dickinson black 384-well clear bottom sterile plates coated with poly-D-lysine.
- Fluorescence Quench Assay Inhibitory activity of compounds was assessed by a fluorescence quench assay of BACE activity using commercially available substrate HiLyte Fluor.TM.488-Glu-Val-Asn-Leu-Asp-Ala-Glu-Phe-Lys-(QXL.TM. 520)-OH (AnaSpec, San Jose, Calif.) and truncated human beta-secretase (residues 1-458, His.sub.6-tagged at the C-terminus) expressed in insect cells D. melanogaster S2 using a baculovirus expression system (Mallender et al., Characterization of recombinant, soluble beta-secretase from an insect cell expression system., Mol Pharmacol 59:619-26, 2001). The assay was performed at room temperature in 96-well white opaque Optiplates aque Optiplates (PerkinElmer, Waltham, Mass.) in a total volume of 200 .mu.l of the incubation mixture containing 50 mM sodium acetate buffer, pH 4.5, 0.4 .mu.M FRET substrate, 2.4 nM enzyme, 5% DMSO, and 0.05% Brij-35. The tested compounds were serially diluted in DMSO and pre-incubated with the substrate. The reaction was started by addition of enzyme.
- Formylpeptide Receptor (FPR) Ligand Structure Activity Relationship (SAR) Analysis : Dose Response Assay University of New Mexico Assay Overview: Assay Support: NIH 1R03MH076381-01 Assay for Formylpeptide Receptor Family Ligands PI: Bruce S. Edwards, Ph.D. Assay Background and Significance Formyl peptide receptors. The G-protein coupled formylpeptide receptor (FPR) was one of the originating members of the chemoattractant receptor superfamily (Le et al., 2002a; Oppenheim et al., 1991). N-formylated peptides such as fMLF are high affinity FPR ligands that trigger a variety of biologic activities in myeloid cells, including chemokinesis, chemotaxis, cytokine production and superoxide generation (He et al., 2003; Le et al., 2001b; Murphy, 1994; Murphy, 1996; Tiffany et al., 2001). Since such peptides are derived from bacterial or mitochondrial proteins (Carp, 1982; Marasco et al., 1984; Schiffmann et al., 1975a; Schiffmann et al., 1975b), it has been proposed that a primary FPR function is to promote trafficking of phagocytic myeloid cells to sites of infection and tissue damage whe
- Formylpeptide Receptor (FPRL1) Ligand Structure Activity Relationship (SAR) Analysis : Dose Response Assay University of New Mexico Assay Overview: Assay Support: NIH 1R03MH076381-01 Assay for Formylpeptide Receptor Family Ligands PI: Bruce S. Edwards, Ph.D. Assay Background and Significance Formyl peptide receptors. The G-protein coupled formylpeptide receptor (FPR) was one of the originating members of the chemoattractant receptor superfamily (Le et al., 2002a; Oppenheim et al., 1991). N-formylated peptides such as fMLF are high affinity FPR ligands that trigger a variety of biologic activities in myeloid cells, including chemokinesis, chemotaxis, cytokine production and superoxide generation (He et al., 2003; Le et al., 2001b; Murphy, 1994; Murphy, 1996; Tiffany et al., 2001). Since such peptides are derived from bacterial or mitochondrial proteins (Carp, 1982; Marasco et al., 1984; Schiffmann et al., 1975a; Schiffmann et al., 1975b), it has been proposed that a primary FPR function is to promote trafficking of phagocytic myeloid cells to sites of infection and tissue damage where
- Formylpeptide Receptor (FPRL1) Ligand Structure Activity Relationship (SAR) Analysis : FPR Dose Response Counterscreen Assay University of New Mexico Assay Overview: Assay Support: NIH 1R03MH076381-01 Assay for Formylpeptide Receptor Family Ligands PI: Bruce S. Edwards, Ph.D. Assay Background and Significance Formyl peptide receptors. The G-protein coupled formylpeptide receptor (FPR) was one of the originating members of the chemoattractant receptor superfamily (Le et al., 2002a; Oppenheim et al., 1991). N-formylated peptides such as fMLF are high affinity FPR ligands that trigger a variety of biologic activities in myeloid cells, including chemokinesis, chemotaxis, cytokine production and superoxide generation (He et al., 2003; Le et al., 2001b; Murphy, 1994; Murphy, 1996; Tiffany et al., 2001). Since such peptides are derived from bacterial or mitochondrial proteins (Carp, 1982; Marasco et al., 1984; Schiffmann et al., 1975a; Schiffmann et al., 1975b), it has been proposed that a primary FPR function is to promote trafficking of phagocytic myeloid cells to sites of infection and tissue damage where
- Functional Assay Functional [35S]GTPgammaS binding assays were conducted as follows. kippa opioid receptor membrane solution was prepared by sequentially adding final concentrations of 0.026 ug/ul kippa membrane protein (in-house), 10 ug/mL saponin, 3 uM GDP and 0.20 nM [35S]GTPgammaS to binding buffer (100 mM NaCl, 10 mM MgCl2, 20 mM HEPES, pH 7.4) on ice. The prepared membrane solution (190 ul/well) was transferred to 96-shallow well polypropylene plates containing 10 ul of 20x concentrated stock solutions of agonist prepared in DMSO. Plates were incubated for 30 min at a temperature of about 25° C. with shaking. Reactions were terminated by rapid filtration onto 96-well Unifilter GF/B filter plates (Perkin Elmer, Shelton, Conn.) using a 96-well tissue harvester (Packard) and followed by three filtration washes with 2001 ice-cold binding buffer (10 mM NaH2PO4, 10 mM Na2HPO4, pH 7.4). Filter plates were subsequently dried at 50° C. for 2-3 hours.
- Functional Assay [35S]GTPgammaS functional assays were conducted using freshly thawed u-receptor membranes (Perkin Elmer, Shelton, Conn.). Assay reactions were prepared by sequentially adding the following reagents to binding buffer (100 mM NaCl, 10 mM MgCl2, 20 mM HEPES, pH 7.4) on ice (final concentrations indicated): membrane protein (0.026 mg/mL), saponin (10 mg/mL), GDP (3 mM) and [35S]GTPgammaS (0.20 nM; Perkin Elmer, Shelton, Conn.). The prepared membrane solution (190 ul/well) was transferred to 96-shallow well polypropylene plates containing 10 ul of 20x concentrated stock solutions of the agonist [D-Ala2, N-methyl-Phe4 Gly-ol5]-enkephalin (DAMGO) prepared in dimethyl sulfoxide (DMSO). Plates were incubated for 30 min at about 25° C. with shaking. Reactions were terminated by rapid filtration onto 96-well Unifilter GF/B filter plates (Perkin Elmer, Shelton, Conn.) using a 96-well tissue harvester (Perkin Elmer, Shelton, Conn.) followed by three filtration washes with 2001 of ice-cold binding buffer.
- Inhibition of Recombinant TASK-1 and TASK-3 In Vitro The investigations on the inhibition of the recombinant TASK-1 and TASK-3 channels were conducted using stably transfected CHO cells. The compounds according to the invention were tested in this case by application of 40 mM potassium chloride in the presence of a voltage-sensitive dye according to the method described in detail in the following references [Whiteaker et al., Validation of FLIPR membrane potential dye for high-throughput screening of potassium channel modulators, J. Biomol. Screen. 6 (5), 305-312 (2001); Molecular Devices FLIPR Application Note: Measuring membrane potential using the FLIPR membrane potential assay kit on Fluorometric Imaging Plate Reader (FLIPR ) systems, http://www.moleculardevices.com/reagents-supplies/assay-kits/ion-channels/flipr-membrane-potential-assay-kits]. The activity of the test substances was determined as their ability to inhibit a depolarization induced in the recombinant cells by 40 mM potassium chloride. The concentration which can block half of this depolarization is referred to as IC50.
- Inhibition of Recombinant TASK-1 and TASK-3 In Vitro The investigations on the inhibition of the recombinant TASK-1 and TASK-3 channels were conducted using stably transfected CHO cells. The compounds of the invention were tested here with administration of 40 mM of potassium chloride in the presence of a voltage-sensitive dye using the method described in detail in the following references [Whiteaker et al., Validation of FLIPR membrane potential dye for high-throughput screening of potassium channel modulators, J. Biomol. Screen. 6 (5), 305-312 (2001); Molecular Devices FLIPR Application Note: Measuring membrane potential using the FLIPR membrane potential assay kit on Fluorometric Imaging Plate Reader (FLIPR ) systems, http://www.moleculardevices.com/reagents-supplies/assay-kits/ion-channels/flipr-membrane-potential-assay-kits]. The activity of the test substances was determined as their ability to inhibit a depolarization induced in the recombinant cells by 40 mM potassium chloride. The concentration which can block half of this depolarization is referred to as IC50.
- Multiplex dose response to identify specific small molecule inhibitors of Ras and Ras-related GTPases specifically Cdc42 activated mutant University of New Mexico Assay Overview: Assay Support: NIH I RO3 MH081231-01 HTS to identify specific small molecule inhibitors of Ras and Ras-related GTPases PI: Angela Wandinger-Ness, Ph.D. Co-PI: Larry Sklar, Ph.D. Assay Development: Zurab Surviladze, Ph.D. Assay Implementation: Zurab Surviladze, Danuta Wlodek, Terry Foutz, Mark Carter, Anna Waller Target Team Leader for the Center: Larry Sklar (lsklar@salud.unm.edu) Dose Response Assay Background and Significance: Ras and related small molecular weight GTPases function in the regulation of signaling and cell growth, and collectively serve to control cell proliferation, differentiation and apoptosis [Tekai et al. 2001; Wennerberg et al. 2005]. The Ras-related GTPases are divided into four subfamilies with the Rab proteins regulating membrane transport, Rho proteins (including Rac and Cdc 42) regulating cytoskeletal rearrangements and responses to signaling, Arf/Sar proteins regulating membrane and microtubule dynamics as well
- Multiplex dose response to identify specific small molecule inhibitors of Ras and Ras-related GTPases specifically Rab2 wildtype University of New Mexico Assay Overview: Assay Support: NIH I RO3 MH081231-01 HTS to identify specific small molecule inhibitors of Ras and Ras-related GTPases PI: Angela Wandinger-Ness, Ph.D. Co-PI: Larry Sklar, Ph.D. Assay Development: Zurab Surviladze, Ph.D. Assay Implementation: Zurab Surviladze, Danuta Wlodek, Terry Foutz, Mark Carter, Anna Waller Target Team Leader for the Center: Larry Sklar (lsklar@salud.unm.edu) Dose Response Assay Background and Significance: Ras and related small molecular weight GTPases function in the regulation of signaling and cell growth, and collectively serve to control cell proliferation, differentiation and apoptosis [Takai et al. 2001; Wennerberg et al. 2005]. The Ras-related GTPases are divided into four subfamilies with the Rab proteins regulating membrane transport, Rho proteins (including Rac and Cdc 42) regulating cytoskeletal rearrangements and responses to signaling, Arf/Sar proteins regulating membrane and microtubule dynamics as well
- Multiplex dose response to identify specific small molecule inhibitors of Ras and Ras-related GTPases specifically Rac activated mutant University of New Mexico Assay Overview: Assay Support: NIH I RO3 MH081231-01 HTS to identify specific small molecule inhibitors of Ras and Ras-related GTPases PI: Angela Wandinger-Ness, Ph.D. Co-PI: Larry Sklar, Ph.D. Assay Development: Zurab Surviladze, Ph.D. Assay Implementation: Zurab Surviladze, Danuta Wlodek, Terry Foutz, Mark Carter, Anna Waller Target Team Leader for the Center: Larry Sklar (lsklar@salud.unm.edu) Dose Response Assay Background and Significance: Ras and related small molecular weight GTPases function in the regulation of signaling and cell growth, and collectively serve to control cell proliferation, differentiation and apoptosis [Takai et al. 2001; Wennerberg et al. 2005]. The Ras-related GTPases are divided into four subfamilies with the Rab proteins regulating membrane transport, Rho proteins (including Rac and Cdc 42) regulating cytoskeletal rearrangements and responses to signaling, Arf/Sar proteins regulating membrane and microtubule dynamics as well
- Multiplexed dose response to identify specific small molecule inhibitors of Ras and Ras-related GTPases specifically Rac wildtype University of New Mexico Assay Overview: Assay Support: NIH I RO3 MH081231-01 HTS to identify specific small molecule inhibitors of Ras and Ras-related GTPases PI: Angela Wandinger-Ness, Ph.D. Co-PI: Larry Sklar, Ph.D. Assay Development: Zurab Surviladze, Ph.D. Assay Implementation: Zurab Surviladze, Danuta Wlodek, Terry Foutz, Mark Carter, Anna Waller Target Team Leader for the Center: Larry Sklar (lsklar@salud.unm.edu) Dose Response Assay Background and Significance: Ras and related small molecular weight GTPases function in the regulation of signaling and cell growth, and collectively serve to control cell proliferation, differentiation and apoptosis [Takai et al. 2001; Wennerberg et al. 2005]. The Ras-related GTPases are divided into four subfamilies with the Rab proteins regulating membrane transport, Rho proteins (including Rac and Cdc 42) regulating cytoskeletal rearrangements and responses to signaling, Arf/Sar proteins regulating membrane and microtubule dynamics as well
- Multiplexed dose response to identify specific small molecule inhibitors of Ras and Ras-related GTPases specifically Ras wildtype University of New Mexico Assay Overview: Assay Support: NIH I RO3 MH081231-01 HTS to identify specific small molecule inhibitors of Ras and Ras-related GTPases PI: Angela Wandinger-Ness, Ph.D. Co-PI: Larry Sklar, Ph.D. Assay Development: Zurab Surviladze, Ph.D. Assay Implementation: Zurab Surviladze, Danuta Wlodek, Terry Foutz, Mark Carter, Anna Waller Target Team Leader for the Center: Larry Sklar (lsklar@salud.unm.edu) Dose Response Assay Background and Significance: Ras and related small molecular weight GTPases function in the regulation of signaling and cell growth, and collectively serve to control cell proliferation, differentiation and apoptosis [Tekai et al. 2001; Wennerberg et al. 2005]. The Ras-related GTPases are divided into four subfamilies with the Rab proteins regulating membrane transport, Rho proteins (including Rac and Cdc 42) regulating cytoskeletal rearrangements and responses to signaling, Arf/Sar proteins regulating membrane and microtubule dynamics as well
- Oxadiazole SAR compounds tested by Multiplex dose response to identify specific small molecule inhibitors of Ras and Ras-related GTPases specifically Cdc42 activated mutant University of New Mexico Assay Overview: Assay Support: NIH I RO3 MH081231-01 HTS to identify specific small molecule inhibitors of Ras and Ras-related GTPases PI: Angela Wandinger-Ness, Ph.D. Co-PI: Larry Sklar, Ph.D. Assay Development: Zurab Surviladze, Ph.D. Assay Implementation: Zurab Surviladze, Danuta Wlodek, Terry Foutz, Mark Carter, Anna Waller Target Team Leader for the Center: Larry Sklar (lsklar@salud.unm.edu) Chemistry: University of Kansas Specialized Chemistry Center Target Team Leader for Chemistry: Jennifer Golden Dose Response Assay Background and Significance: Ras and related small molecular weight GTPases function in the regulation of signaling and cell growth, and collectively serve to control cell proliferation, differentiation and apoptosis [Tekai et al. 2001; Wennerberg et al. 2005]. The Ras-related GTPases are divided into four subfamilies with the Rab proteins regulating membrane transport, Rho proteins (including Rac and Cdc 42) regulating cytoskeletal r
- PFKFB4 Assay 6-phosphofructo-2-kinase/fructose-2,6-bisphosphatase (PFK-2/BPase-2) is a bi-functional enzyme that catalyses the formation and degradation of fructose-2,6-bisphosphate (F-2,6-P2) (For reviews see e.g. Pilkis et al., (1995) Annu Rev. Biochem. 64, 799-835; and Okar et al., (2001) Trends Biochem. Sci. 26, 30-5). The relative kinase (formation) and phosphatase (degradation) activities of the bi-functional enzymes PFKFB3 and PFKFB4 control the intracellular levels of this regulator (F-2,6-P2), which acts as an allosteric activator of glycolysis. Both the relative activities as well as the kinase to phosphatase ratios differ between the iso forms of the bi-functional enzymes, referred to as PFKFB1, PFKFB2, PFKFB3 and PFKFB4. Intracellular F-2,6-P2 levels are consequently controlled by variable tissue expression of these isoforms, including splice variants or post-translational modifications (see e.g. Rider et al. (2007) Biochem J. 381, 561-579).
- Radioligand Dose-Displacement Binding Assay Radioligand dose displacement assays used 0.4 nM [3H]-U69,593 (GE Healthcare, Piscataway, N.J.; 40 Ci/mmole) with 15 μg membrane protein (recombinant κ opioid receptor expressed in HEK 293 cells; in-house prep) in a final volume of 200 μl binding buffer (5% DMSO, 50 mM Trizma base, pH 7.4). Non-specific binding was determined in the presence of 10 μM unlabeled naloxone or U69,593. All reactions were performed in 96-well polypropylene plates for 1 hr at a temperature of about 25° C. Binding reactions were terminated by rapid filtration onto 96-well Unifilter GF/C filter plates (Perkin Elmer, Shelton, Conn.) presoaked in 0.5% polyethylenimine (Sigma). Harvesting was performed using a 96-well tissue harvester (Perkin Elmer, Shelton, Conn.) followed by five filtration washes with 2001 ice-cold binding buffer. Filter plates were subsequently dried at 50° C. for 1-2 hours.
- Biological Assay The compounds of the invention inhibit RORgammaT activity. Activation of RORgammaT activity can be measured using, e.g., a biochemical TR-FRET assay. In such an assay, interaction of cofactor-derived peptides with human RORgammaT-Ligand Binding Domain (LBD) can be measured. The TR-FRET technique is a sensitive biochemical proximity assay that will give information concerning the interaction of a ligand with the LBD, in the presence of cofactor-derived peptides (Zhou et al., Methods 25:54-61, 2001).To identify novel antagonists of RORgammaT, an assay was developed which employs the interaction of RORgammaT with its co-activator peptide SRC1_2. This peptide mimics the recruitment of co-activators to RORgammaT through its interaction with the LXXLL (SEQ ID NO:1) (e.g., NR box) motifs (Xie et al., J. Immunol. 175: 3800-09, 2005; Kurebayashi et al., Biochem. Biophys. Res. Commun. 315: 919-27, 2004; Jin et al., Mol. Endocrinology 24:923-29, 2010). The RORγ-Ligand Binding Domain TR-FRET Assay was run according to the following protocol.
- Dose Response Assay for Formylpeptide Receptor (FPR) Ligands and Dose Response Counter-Screen Assay for Formylpeptide-Like-1 (FPRL1) Ligands University of New Mexico Assay Overview: Assay Support: NIH 1R03MH076381-01 Assay for Formylpeptide Receptor Family Ligands PI: Bruce S. Edwards, Ph.D. Assay Background and Significance Formyl peptide receptors. The G-protein coupled formylpeptide receptor (FPR) was one of the originating members of the chemoattractant receptor superfamily (Le et al., 2002a; Oppenheim et al., 1991). N-formylated peptides such as fMLF are high affinity FPR ligands that trigger a variety of biologic activities in myeloid cells, including chemokinesis, chemotaxis, cytokine production and superoxide generation (He et al., 2003; Le et al., 2001b; Murphy, 1994; Murphy, 1996; Tiffany et al., 2001). Since such peptides are derived from bacterial or mitochondrial proteins (Carp, 1982; Marasco et al., 1984; Schiffmann et al., 1975a; Schiffmann et al., 1975b), it has been proposed that a primary FPR function is to promote trafficking of phagocytic myeloid cells to sites of infection and tissue damage where
- Dose Response Assay for Formylpeptide Receptor-Like-1 (FPRL1) Ligands and Dose Response Counter-Screen Assay for Formylpeptide Receptor (FPR) Ligands University of New Mexico Assay Overview Assay Support: NIH 1R03MH076381-01 Assay for Formylpeptide Receptor Family Ligands PI: Bruce S. Edwards, Ph.D. Assay Background and Significance Formyl peptide receptors. The G-protein coupled formylpeptide receptor (FPR) was one of the originating members of the chemoattractant receptor superfamily (Le et al., 2002a; Oppenheim et al., 1991). N-formylated peptides such as fMLF are high affinity FPR ligands that trigger a variety of biologic activities in myeloid cells, including chemokinesis, chemotaxis, cytokine production and superoxide generation (He et al., 2003; Le et al., 2001b; Murphy, 1994; Murphy, 1996; Tiffany et al., 2001). Since such peptides are derived from bacterial or mitochondrial proteins (Carp, 1982; Marasco et al., 1984; Schiffmann et al., 1975a; Schiffmann et al., 1975b), it has been proposed that a primary FPR function is to promote trafficking of phagocytic myeloid cells to sites of infection and tissue damage where t
- Dose response, multiplexed high-throughput screen for small molecule regulators of RGS family protein interactions, specifically RGS16-Galphao for SAR Compounds University of New Mexico Assay Overview: Assay Support: NIH R21NS057014 HTS to identify small molecule regulators of RGS family protein interactions PI: Richard Neubig, Ph.D. Assay Implementation: Yang Wu Ph.D., Mark Haynes Ph.D., Anna Waller Ph.D., Mark Carter MS Target Team Leader for the Center: Larry Sklar, Ph.D., (lsklar@salud.unm.edu) Assay Background and Significance: Regulators of G protein signaling (RGS) proteins are a diverse set of intracellular proteins that modulate G protein-coupled receptor (GPCR) signaling [Neitzel and Hepler, 2006]. Their diversity is a result of their localized tissue distribution as well as their preferential regulation of a particular subunit of G protein (Galpha) [Zhong and Neubig, 2001; Neubig and Siderovski, 2002]. Following activation by ligand-bound GPCRs, the Galpha subunit undergoes rapid GTP - GDP exchange, and subsequently dissociates from both the GPCR and the G protein beta-gamma subunit (Gbg). Active GTP-bound Galpha (Galpha-GTP)
- Dose response, multiplexed high-throughput screen for small molecule regulators of RGS family protein interactions, specifically RGS16-Galphao with additional round of SAR compounds University of New Mexico Assay Overview: Assay Support: NIH R21NS057014 HTS to identify small molecule regulators of RGS family protein interactions PI: Richard Neubig, Ph.D. Assay Implementation: Yang Wu Ph.D., Mark Haynes Ph.D., Anna Waller Ph.D., Mark Carter MS Target Team Leader for the Center: Larry Sklar, Ph.D., (lsklar@salud.unm.edu) Assay Background and Significance: Regulators of G protein signaling (RGS) proteins are a diverse set of intracellular proteins that modulate G protein-coupled receptor (GPCR) signaling [Neitzel and Hepler, 2006]. Their diversity is a result of their localized tissue distribution as well as their preferential regulation of a particular subunit of G protein (Galpha) [Zhong and Neubig, 2001; Neubig and Siderovski, 2002]. Following activation by ligand-bound GPCRs, the Galpha subunit undergoes rapid GTP - GDP exchange, and subsequently dissociates from both the GPCR and the G protein beta-gamma subunit (Gbg). Active GTP-bound Galpha (Galpha-GTP)
- Dose response, multiplexed high-throughput screen for small molecule regulators of RGS family protein interactions, specifically RGS19-Galphao for SAR Compounds University of New Mexico Assay Overview: Assay Support: NIH R21NS057014 HTS to identify small molecule regulators of RGS family protein interactions PI: Richard Neubig, Ph.D. Assay Implementation: Yang Wu Ph.D., Mark Haynes Ph.D., Anna Waller Ph.D., Mark Carter MS Target Team Leader for the Center: Larry Sklar, Ph.D., (lsklar@salud.unm.edu) Assay Background and Significance: Regulators of G protein signaling (RGS) proteins are a diverse set of intracellular proteins that modulate G protein-coupled receptor (GPCR) signaling [Neitzel and Hepler, 2006]. Their diversity is a result of their localized tissue distribution as well as their preferential regulation of a particular subunit of G protein (Galpha) [Zhong and Neubig, 2001; Neubig and Siderovski, 2002]. Following activation by ligand-bound GPCRs, the Galpha subunit undergoes rapid GTP - GDP exchange, and subsequently dissociates from both the GPCR and the G protein beta-gamma subunit (Gbg). Active GTP-bound Galpha (Galpha-GTP)
- Dose response, multiplexed high-throughput screen for small molecule regulators of RGS family protein interactions, specifically RGS4-Galphao for SAR compounds University of New Mexico Assay Overview: Assay Support: NIH R21NS057014 HTS to identify small molecule regulators of RGS family protein interactions PI: Richard Neubig, Ph.D. Assay Implementation: Yang Wu Ph.D., Mark Haynes Ph.D., Anna Waller Ph.D., Mark Carter MS Target Team Leader for the Center: Larry Sklar, Ph.D., (lsklar@salud.unm.edu) Assay Background and Significance: Regulators of G protein signaling (RGS) proteins are a diverse set of intracellular proteins that modulate G protein-coupled receptor (GPCR) signaling [Neitzel and Hepler, 2006]. Their diversity is a result of their localized tissue distribution as well as their preferential regulation of a particular subunit of G protein (Galpha) [Zhong and Neubig, 2001; Neubig and Siderovski, 2002]. Following activation by ligand-bound GPCRs, the Galpha subunit undergoes rapid GTP - GDP exchange, and subsequently dissociates from both the GPCR and the G protein beta-gamma subunit (Gbg). Active GTP-bound Galpha (Galpha-GTP)
- Dose response, multiplexed high-throughput screen for small molecule regulators of RGS family protein interactions, specifically RGS4-Galphao with additional round of SAR compounds. University of New Mexico Assay Overview: Assay Support: NIH R21NS057014 HTS to identify small molecule regulators of RGS family protein interactions PI: Richard Neubig, Ph.D. Assay Implementation: Yang Wu Ph.D., Mark Haynes Ph.D., Anna Waller Ph.D., Mark Carter MS Target Team Leader for the Center: Larry Sklar, Ph.D., (lsklar@salud.unm.edu) Assay Background and Significance: Regulators of G protein signaling (RGS) proteins are a diverse set of intracellular proteins that modulate G protein-coupled receptor (GPCR) signaling [Neitzel and Hepler, 2006]. Their diversity is a result of their localized tissue distribution as well as their preferential regulation of a particular subunit of G protein (Galpha) [Zhong and Neubig, 2001; Neubig and Siderovski, 2002]. Following activation by ligand-bound GPCRs, the Galpha subunit undergoes rapid GTP - GDP exchange, and subsequently dissociates from both the GPCR and the G protein beta-gamma subunit (Gbg). Active GTP-bound Galpha (Galpha-GTP)
- Dose response, multiplexed high-throughput screen for small molecule regulators of RGS family protein interactions, specifically RGS7-Galphao for SAR Compounds University of New Mexico Assay Overview: Assay Support: NIH R21NS057014 HTS to identify small molecule regulators of RGS family protein interactions PI: Richard Neubig, Ph.D. Assay Implementation: Yang Wu Ph.D., Mark Haynes Ph.D., Anna Waller Ph.D., Mark Carter MS Target Team Leader for the Center: Larry Sklar, Ph.D., (lsklar@salud.unm.edu) Assay Background and Significance: Regulators of G protein signaling (RGS) proteins are a diverse set of intracellular proteins that modulate G protein-coupled receptor (GPCR) signaling [Neitzel and Hepler, 2006]. Their diversity is a result of their localized tissue distribution as well as their preferential regulation of a particular subunit of G protein (Galpha) [Zhong and Neubig, 2001; Neubig and Siderovski, 2002]. Following activation by ligand-bound GPCRs, the Galpha subunit undergoes rapid GTP - GDP exchange, and subsequently dissociates from both the GPCR and the G protein beta-gamma subunit (Gbg). Active GTP-bound Galpha (Galpha-GTP)
- Dose response, multiplexed high-throughput screen for small molecule regulators of RGS family protein interactions, specifically RGS7-Galphao with additional round of SAR compounds. University of New Mexico Assay Overview: Assay Support: NIH R21NS057014 HTS to identify small molecule regulators of RGS family protein interactions PI: Richard Neubig, Ph.D. Assay Implementation: Yang Wu Ph.D., Mark Haynes Ph.D., Anna Waller Ph.D., Mark Carter MS Target Team Leader for the Center: Larry Sklar, Ph.D., (lsklar@salud.unm.edu) Assay Background and Significance: Regulators of G protein signaling (RGS) proteins are a diverse set of intracellular proteins that modulate G protein-coupled receptor (GPCR) signaling [Neitzel and Hepler, 2006]. Their diversity is a result of their localized tissue distribution as well as their preferential regulation of a particular subunit of G protein (Galpha) [Zhong and Neubig, 2001; Neubig and Siderovski, 2002]. Following activation by ligand-bound GPCRs, the Galpha subunit undergoes rapid GTP - GDP exchange, and subsequently dissociates from both the GPCR and the G protein beta-gamma subunit (Gbg). Active GTP-bound Galpha (Galpha-GTP)
- Dose response, multiplexed high-throughput screen for small molecule regulators of RGS family protein interactions, specifically RGS8-Galphao for SAR Compounds University of New Mexico Assay Overview: Assay Support: NIH R21NS057014 HTS to identify small molecule regulators of RGS family protein interactions PI: Richard Neubig, Ph.D. Assay Implementation: Yang Wu Ph.D., Mark Haynes Ph.D., Anna Waller Ph.D., Mark Carter MS Target Team Leader for the Center: Larry Sklar, Ph.D., (lsklar@salud.unm.edu) Assay Background and Significance: Regulators of G protein signaling (RGS) proteins are a diverse set of intracellular proteins that modulate G protein-coupled receptor (GPCR) signaling [Neitzel and Hepler, 2006]. Their diversity is a result of their localized tissue distribution as well as their preferential regulation of a particular subunit of G protein (Galpha) [Zhong and Neubig, 2001; Neubig and Siderovski, 2002]. Following activation by ligand-bound GPCRs, the Galpha subunit undergoes rapid GTP - GDP exchange, and subsequently dissociates from both the GPCR and the G protein beta-gamma subunit (Gbg). Active GTP-bound Galpha (Galpha-GTP)
- Dose response, multiplexed high-throughput screen for small molecule regulators of RGS family protein interactions, specifically RGS8-Galphao with additional round of SAR compounds University of New Mexico Assay Overview: Assay Support: NIH R21NS057014 HTS to identify small molecule regulators of RGS family protein interactions PI: Richard Neubig, Ph.D. Assay Implementation: Yang Wu Ph.D., Mark Haynes Ph.D., Anna Waller Ph.D., Mark Carter MS Target Team Leader for the Center: Larry Sklar, Ph.D., (lsklar@salud.unm.edu) Assay Background and Significance: Regulators of G protein signaling (RGS) proteins are a diverse set of intracellular proteins that modulate G protein-coupled receptor (GPCR) signaling [Neitzel and Hepler, 2006]. Their diversity is a result of their localized tissue distribution as well as their preferential regulation of a particular subunit of G protein (Galpha) [Zhong and Neubig, 2001; Neubig and Siderovski, 2002]. Following activation by ligand-bound GPCRs, the Galpha subunit undergoes rapid GTP - GDP exchange, and subsequently dissociates from both the GPCR and the G protein beta-gamma subunit (Gbg). Active GTP-bound Galpha (Galpha-GTP)
- Fluorescence Polarization (FP) Assay Measuring compound ligand binding to CRBN-DDB1 was carried out using an established sensitive and quantitative in vitro fluorescence polarization (FP) based binding assay. (See, I. J. Enyedy et al, J. Med. Chem., 44: 313-4324 [2001]). Compounds were dispensed from serially diluted DMSO stock into black 384-well compatible fluorescence polarization plates using an Echo acoustic dispenser. Compound binding to CRBN-DDB1 was measured by displacement of either a (−)-Thalidomide-Alexa Fluor or Pomalidomide-fluorescein conjugated probe dye. A 20 μL mixture containing 400 nM CRBN-DDB1 and 5 nM probe dye in 50 mM Hepes, pH 7.4, 200 mM NaCl, 1% DMSO and 0.1% pluronic acid-127 acid was added to wells containing compound and incubated at room temperature for 60 min. Matching control wells excluding CRBN-DDB1 were used to correct for background fluorescence. Plates were read on an Envision plate reader with appropriate FP filter sets. The corrected S (perpendicular) and P (parallel) values were used to calculate fluorescence polarization (FP) with the following equation: FP=1000x(S−GxP)/(S+GxP).
- Fluorescence Polarization (FP) Assay Measuring compound ligand binding to CRBN-DDB1 was carried out using an established sensitive and quantitative in vitro fluorescence polarization (FP) based binding assay. (See, I. J. Enyedy et al, J. Med. Chem., 44: 313-4324, 2001). Compounds were dispensed from serially diluted DMSO stock into black 384-well compatible fluorescence polarization plates using an Echo acoustic dispenser. Compound binding to CRBN-DDB1 was measured by displacement of either a (−)-Thalidomide-Alexa Fluor or Pomalidomide-fluorescein conjugated probe dye. A 20 μL mixture containing 400 nM CRBN-DDB1 and 5 nM probe dye in 50 mM Hepes, pH 7.4, 200 mM NaCl, 1% DMSO and 0.05% pluronic acid-127 acid was added to wells containing compound and incubated at room temperature for 60 min. Matching control wells excluding CRBN-DDB1 were used to correct for background fluorescence. Plates were read on an Envision plate reader with appropriate FP filter sets. The corrected S (perpendicular) and P (parallel) values were used to calculate fluorescence polarization (FP) with the following equation:FP=1000*(S−G*P)/(S+G*P).
- Formylpeptide Receptor (FPR) Ligand Structure Activity Relationship (SAR) Analysis : Dose Response Assay Counterscreen Against Formyl Peptide Receptor-Like-1 (FPRL1) University of New Mexico Assay Overview: Assay Support: NIH 1R03MH076381-01 Assay for Formylpeptide Receptor Family Ligands PI: Bruce S. Edwards, Ph.D. Assay Background and Significance Formyl peptide receptors. The G-protein coupled formylpeptide receptor (FPR) was one of the originating members of the chemoattractant receptor superfamily (Le et al., 2002a; Oppenheim et al., 1991). N-formylated peptides such as fMLF are high affinity FPR ligands that trigger a variety of biologic activities in myeloid cells, including chemokinesis, chemotaxis, cytokine production and superoxide generation (He et al., 2003; Le et al., 2001b; Murphy, 1994; Murphy, 1996; Tiffany et al., 2001). Since such peptides are derived from bacterial or mitochondrial proteins (Carp, 1982; Marasco et al., 1984; Schiffmann et al., 1975a; Schiffmann et al., 1975b), it has been proposed that a primary FPR function is to promote trafficking of phagocytic myeloid cells to sites of infection and tissue damage whe
- HumanCHIT1 Activity Assay An enzymatic assay with recombinant human CHIT1 was used in order to establish inhibitory activity of the compounds (Boot et al., 2001, JBC: 276). The assay was run in the 96-well plate format, each reaction in the total volume of 100 μL. 4-methylumbelliferyl β-D-N,N′,N″-triacetylchitotriose was used as a substrate for the enzyme. Upon hydrolysis by CHIT1, the substrate releases 4-methylumbelliferyl (4MU) that, when ionized in basic pH, emits fluorescence at 460 nm.Briefly, 40 μL of a substrate was added to each well, followed by 10 μL of compound dilution and 50 μL of CHIT1 recombinant enzyme solution. The reaction was carried out in citrate buffer, pH 5.2, in the dark, at 37° C. for 60 minutes with shaking. After that time the reaction was stopped by adding 195 μL of Stop Solution (pH 10.5) to each well. The fluorescence of the reaction product was measured in Perkin Elmer Envision fluorescent plate reader at an excitation wavelength of 355 nm.
- AMCase Activity Assay An enzymatic assay with recombinant human AMCase was used in order to establish inhibitory activity of the compounds (Boot et al., 2001, JBC:276). The assay was run in the 96-well plate format, each reaction in the total volume of 100 μL. 4-Methylumbelliferyl B-D-N,N′-diacetylchitobioside hydrate was used as a substrate for the enzyme. Upon hydrolysis by AMCase, the substrate releases 4-methylumbelliferyl (4MU) that, when ionized in basic pH, emits fluorescence at 460 nm. Briefly, 40 μL of a substrate was added to each well, followed by 10 μL of compound dilution and 50 μL of hAMCase recombinant enzyme solution. The reaction was carried out in citrate buffer, pH 5.2, in the dark, at 37° C. for 60 minutes with shaking. After that time the reaction was stopped by adding 195 μL of Stop Buffer (pH 10.5) to each well. The fluorescence of the reaction product was measured in Tecan Spark multimode plate reader at an excitation wavelength of 355 nm. The IC50 values were calculated using GraphPad Prism.
- CHIT1 Activity Assay An enzymatic assay with recombinant human CHIT1 was used in order to establish inhibitory activity of the compounds (Boot et al., 2001, JBC:276). The assay was run in the 96-well plate format, each reaction in the total volume of 100 μL. 4-methylumbelliferyl β-D-N,N′,N″-triacetylchitotriose was used as a substrate for the enzyme. Upon hydrolysis by CHIT1, the substrate releases 4-methylumbelliferyl (4MU) that, when ionized in basic pH, emits fluorescence at 460 nm. Briefly, 40 μL of a substrate was added to each well, followed by 10 μL of compound dilution and 50 μL of CHIT1 recombinant enzyme solution. The reaction was carried out in citrate buffer, pH 5.2, in the dark, at 37° C. for 60 minutes with shaking. After that time the reaction was stopped by adding 195 μL of Stop Solution (pH 10.5) to each well. The fluorescence of the reaction product was measured in Tecan Spark multimode plate reader at an excitation wavelength of 355 nm. The IC50 values were calculated using GraphPad Prism.
- FLIPR Ca2+ Flux Assay FLIPR Ca2+ Flux Assay (Okumura et al., Biochem. Biophys. Res. Comm. 280:976-981, 2001). In a typical experiment the OX1 and OX2 receptor antagonistic activity of the compounds of the present invention was determined in accordance with the following experimental method. For intracellular calcium measurements, Chinese hamster ovary (CHO) cells expressing the rat orexin-1 receptor or the human orexin-2 receptor, are grown in Iscove's modified DMEM containing 2 mM L-glutamine, 0.5 g/ml G418, 1% hypoxanthine-thymidine supplement, 100 U/ml penicillin, 100 μg/ml streptomycin and 10% heat-inactivated fetal calf serum (FCS). The cells are seeded at 20,000 cells/well into Becton-Dickinson black 384-well clear bottom sterile plates coated with poly-D-lysine. All reagents were from GIBCO-Invitrogen Corp. The seeded plates are incubated overnight at 37° C. and 5% CO2. Ala-6,12 human orexin-A as the agonist is prepared as a 1 mM stock solution in 1% bovine serum albumin (BSA) and diluted in assay buffer (HBSS containing 20 mM HEPES, 0.1% BSA and 2.5 mM probenecid, pH7.4) for use in the assay at a final concentration of 70 pM.
- Human AMCase Activity Assay An enzymatic assay with recombinant human AMCase was used in order to establish inhibitory activity of the compounds (Boot et al., 2001, JBC: 276). The assay was run in the 96-well plate format, each reaction in the total volume of 100 μL. 4-Methylumbelliferyl B-D-N,N′-diacetylchitobioside hydrate was used as a substrate for the enzyme. Upon hydrolysis by AMCase, the substrate releases 4-methylumbelliferyl (4MU) that, when ionized in basic pH, emits fluorescence at 460 nm.Briefly, 40 μL of a substrate was added to each well, followed by 10 μL of compound dilution and 50 μL of hAMCase recombinant enzyme solution. The reaction was carried out in citrate buffer, pH 5.2, in the dark, at 37° C. for 60 minutes with shaking. After that time the reaction was stopped by adding 195 μL of Stop Buffer (pH 10.5) to each well. The fluorescence of the reaction product was measured in Perkin Elmer Envision fluorescent plate reader at an excitation wavelength of 355 nm. The IC50 values were calculated using GraphPad Prism.
- Human CHIT1 Activity Assay An enzymatic assay with recombinant human CHIT1 was used in order to establish inhibitory activity of the compounds (Boot et al., 2001, JBC: 276). The assay was run in the 96-well plate format, each reaction in the total volume of 100 μL. 4-methylumbelliferyl β-D-N,N′,N″-triacetylchitotriose was used as a substrate for the enzyme. Upon hydrolysis by CHIT1, the substrate releases 4-methylumbelliferyl (4MU) that, when ionized in basic pH, emits fluorescence at 460 nm.Briefly, 40 μL of a substrate was added to each well, followed by 10 μL of compound dilution and 50 μL of CHIT1 recombinant enzyme solution. The reaction was carried out in citrate buffer, pH 5.2, in the dark, at 37° C. for 60 minutes with shaking. After that time the reaction was stopped by adding 195 μL of Stop Solution (pH 10.5) to each well. The fluorescence of the reaction product was measured in Perkin Elmer Envision fluorescent plate reader at an excitation wavelength of 355 nm. The IC50 values were calculated using GraphPad Prism.
- ThermoFluor Assay ThermoFluor is a fluorescence based assay that estimates ligand binding affinities by measuring the effect of a ligand on protein thermal stability (Pantoliano, M. W., Petrella, E. C., Kwasnoski, J. D., Lobanov, V. S., Myslik, J., Graf, E., Carver, T., Asel, E., Springer, B. A., Lane, P., and Salemme, F. R. (2001) High-density miniaturized thermal shift assays as a general strategy for drug discovery. J Biomol Screen 6, 429-40, and Matulis, D., Kranz, J. K., Salemme, F. R., and Todd, M. J. (2005) Thermodynamic stability of carbonic anhydrase: measurements of binding affinity and stoichiometry using ThermoFluor. Biochemistry 44, 5258-66). This approach is applicable to a wide variety of systems, and rigorous in theoretical interpretation through quantitation of equilibrium binding constants (KD).In a ThermoFluor experiment where protein stability is monitored as the temperature is steadily increased, an equilibrium binding ligand causes the midpoint of an unfolding transition (Tm) to occur at a higher temperature. The shift in the melting point described as a ΔTm is proportional to the concentration and affinity of the ligand. The compound potency may be compared as a rank order of either ΔTm values at a single compound concentration or in terms of KD values, estimated from concentration response curves.
- CRBN-DDB1 Fluorescence Polarization (FP) Assay Measuring compound ligand binding to CRBN-DDB1 was carried out using an established sensitive and quantitative in vitro fluorescence polarization (FP) based binding assay. (See, I. J. Enyedy et al, J. Med. Chem., 44: 313-4324 [2001]). Compounds were dispensed from serially diluted DMSO stock into black 384-well compatible fluorescence polarization plates using an Echo acoustic dispenser. Compound binding to CRBN-DDB1 was measured by displacement of either a (+)Thalidomide-Alexa Fluor® or Pomalidomide-fluorescein conjugated probe dye. A 20 μL mixture containing 400 nM CRBN-DDB1 and 5 nM probe dye in 50 mM Hepes, pH 7.4, 200 mM NaCl, 1% DMSO and 0.1% pluronic acid-127 acid was added to wells containing compound and incubated at room temperature for 60 min. Matching control wells excluding CRBN-DDB1 were used to correct for background fluorescence. Plates were read on an Envision plate reader with appropriate FP filter sets. The corrected S (perpendicular) and P(parallel) values were used to calculate fluorescence polarization (FP) with the following equation: FP=1000*(S−G*P)/(S+G*P). The fractional amount of bound probe (FB) to CRBN-DDB1 as a function of compound concentration was fitted according to Wang; FEBS Letters 360, (1995), 111-114 to obtain fits for parameter offsets and binding constant (KA) of competitor compound.
- Fluorescence Polarization (FP) Assay Measuring compound ligand binding to CRBN-DDB1 was carried out using an established sensitive and quantitative in vitro fluorescence polarization (FP) based binding assay. (See, I. J. Enyedy et al, J. Med. Chem., 44: 313-4324 [2001]). Compounds were dispensed from serially diluted DMSO stock into black 384-well compatible fluorescence polarization plates using an Echo acoustic dispenser. Compound binding to CRBN-DDB1 was measured by displacement of either a (−)-Thalidomide-Alexa Fluor or Pomalidomide-fluorescein conjugated probe dye. A 20 μL mixture containing 400 nM CRBN-DDB 1 and 5 nM probe dye in 50 mM Hepes, pH 7.4, 200 mM NaCl, 1% DMSO and 0.1% pluronic acid-127 acid was added to wells containing compound and incubated at room temperature for 60 min. Matching control wells excluding CRBN-DDB1 were used to correct for background fluorescence. Plates were read on an Envision plate reader with appropriate FP filter sets. The corrected S (perpendicular) and P (parallel) values were used to calculate fluorescence polarization (FP) with the following equation: FP=1000*(S−G*P)/(S+G*P). The fractional amount of bound probe (FB) to CRBN-DDB1 as a function of compound concentration was fitted according to Wang; FEBS Letters 360, (1995), 111-114 to obtain fits for parameter offsets and binding constant (KA) of competitor compound.
- Fluorescence Polarization (FP) Assay for Screening Compound Ligand Binders of CRBN-DDM Measuring compound ligand binding to CRBN-DDB1 was carried out using an established sensitive and quantitative in vitro fluorescence polarization (FP) based binding assay. (See, I. J. Enyedy et al, J. Med. Chem., 44: 3134324, 2001). Compounds were dispensed from serially diluted DMSO stock into black 384-well compatible fluorescence polarization plates using an Echo acoustic dispenser. Compound binding to CRBN-DDB1 was measured by displacement of either a (−)-Thalidomide-Alexa Fluor or Pornalidomide-fluorescein conjugated probe dye. A 20 μL mixture containing 400 nM CRBN-DDB1 and 5 nM probe dye in 50 mM Hepes, pH 7.4, 200 mM NaCl, 1% DMSO and 0.05% pluronic acid-127 acid was added to wells containing compound and incubated at room temperature for 60 min. Matching control wells excluding CRBN-DDB1 were used to correct for background fluorescence. Plates were read on an Envision plate reader with appropriate FP filter sets. The corrected S (perpendicular) and P (parallel) values were used to calculate fluorescence polarization (FP) with the following equation: FP=1000*(S−G*P)/(S+G*P).The fractional amount of bound probe (FB) to CRBN-DDB1 as a function of compound concentration was fitted according to Wang; FEBS Letters 360, (1995), 111-114 to obtain fits for parameter offsets and binding constant (KA) of competitor compound.
- TdF (Temperature Dependence Fluorescence) Assay The SAR (Structure Activity Relationship) for ERK ligands covered by this invention was interrogated using the TdF (Temperature Dependence Fluorescence) assay or best known as thermal shift assay. (M. W. Pantoliano, et al., "High-density miniaturized thermal shift assays as a general strategy for drug discovery," J. Biomol. Screen 6 (2001) 429-440) The TdF assay was mainly conducted in the 96-well based CHROMO-4 real time fluorescence plate reader (BioRad). The Sypro Orange (Sigma-Aldrich), environmentally sensitive fluorescence dye, was used to monitor the protein folding-unfolding transition. Protein-ligand binding was gauged by the change (or shift) in the unfolding transition temperature (ΔTm) acquired at protein alone with respect to protein in the presence of ligand of interest.Compound of interest was first prepared in DMSO stock (typical concentration: 10 mM). Sample of 20 μt was then added into the 96-well PCR plate, where it consisted of 3 μM ERK protein and 15, 50 or 100 μM compound (depending on compound's solubility) in buffer (25 mM HEPES, 150 mM NaCl, pH-7.5 and 1 mM DTT) incorporated with Sypro Orange dye (5x final concentration). Final percentage of DMSO resided in the sample was 2%. The sample plate was heated from 30° C. to 90° C. with thermal ramping rate of 1° C./min.
- ligand sensing assay (LiSA) As used herein, reference to the activity of an LXR agonist at LXRα and LXRβ refer to the activity as measured using the ligand sensing assay (LiSA) described in Spencer et al. Journal of Medicinal Chemistry 2001, 44, 886-897, incorporated herein by reference. In some embodiments, the LXR agonist has an EC50 of less than 1 μM in the ligand sensing assay (e.g., 0.5 nm to 500 nM, 10 nM to 100 nM). For example, the methods of the invention can be performed using an LXRβ agonist having activity for LXRβ that is at least 3-fold greater than the activity of the agonist for LXRα, or having activity for LXRβ that is at least 10-fold greater than the activity of the agonist for LXRα, or having activity for LXRβ that is at least 100-fold greater than the activity of said agonist for LXRα, or having activity for LXRβ that is at least within 3-fold of the activity of the agonist for LXRα. The term greater activity in the LiSA assay assay refers to a lower EC50. For example, GW3965 2 has approximately 6-fold greater activity for LXRβ (EC50=30) compared to LXRα (EC50=190).
- Biological Assays To each well of a 384-well plate, 1 μL of test compounds in DMSO (final concentration ranging from 0.3 nM to 10 uM) were added into 20 μl of assay buffer (50 mM Tris pH 7.4/0.01% Tween-20/0.1 mg/ml bovine serum albumin/10 μM ferrous sulfate/1 mM sodium ascorbate/20 μg/ml catalase) containing 0.15 μg/ml FLAG-tagged full length PHD2 expressed in and purified from baculovirus-infected Sf9 cells. After a 5 min preincubation at room temperature, the enzymatic reactions were initiated by the addition of 4 μL of substrates {final concentrations of 0.2 μM 2-oxoglutarate and 0.5 μM HIF-1α peptide biotinyl-DLDLEMLAPYIPMDDDFQL (SEQ ID NO:1)}. After incubation for 45 minutes at room temperature, the reactions were terminated by the addition of a 25 μL quench/detection mix to a final concentration of 1 mM ortho-phenanthroline, 0.1 mM EDTA, 0.5 nM anti-(His)6 LANCE reagent (Perkin-Elmer Life Sciences), 100 nM AF647-labeled streptavidin (Invitrogen), and 2 μg/ml (His)6-VHL complex {S. Tan Protein Expr. Purif. 21, 224-234 (2001)} and the signals were developed for 30 minutes at room temperature. The ratio of time resolved fluorescence signals at 665 and 620 nm was determined, and percent inhibition was calculated relative to the high control samples (DMSO treated) run in parallel, after background subtraction.
- Transactivation Assay PC-3 cells (Kaighn et al., Invest. Urol. 17: 16-23, 1979) were plated out at a density of 10000 cells per well of a 96-well cell culture plate in RMPI 1640 medium (F1235, Biochrom AG, Berlin, Germany), which contained activated charcoal-treated calf serum (FCS Serum Gold, PAA Laboratories) at a concentration of 5% (v/v). On the next day the cells were transiently transfected with the pSG5-vector (#216201 Stratagene), which contained the sequence of the androgen receptor mutant W741C (Haapala et al., Lab Invest. 81(12): 1647-51, 2001), and with a reporter plasmid based on pGL4.14 (#E6691, Promega) with the luciferase-gene (from Photinus pyralis) under the control of the MMTV promoter (Cato et al., EMBO J. 6: 363-8, 1987). The cells were treated with the test substances in concentrations from 1×10^−8 to 1×10^−10 M in the presence of 1×10^−10 M R1881 and were incubated overnight at 37° C. and 5% CO2. After 24 hours, 100 μl of Steady Glo Lysis and Detection reagent (E2550, Promega) was added per well and the luminescence was read in a Victor3 Luminometer (PerkinElmer) for 1 second per well. The luminescence values obtained were normalized, wherein 100% corresponded to the effect of the unstimulated control (without R1881), and 0% corresponded to the effect of the stimulated control (R1881 plus DMSO instead of test substance).
- Antagonistic Activity Assay The antagonistic activities of the test compounds on human orexin-1 receptor (hOX1R) and orexin-2 receptor (hOX2R) were measured by modifying from the method described in literature (Toshikatsu Okumura et al., Biochemical and Biophysical Research Communications 280, 976-981, 2001). Chinese hamster ovary (CHO) cells forcibly expressing the hOX1R and hOX2R were seeded into a 96 well Black clear bottom plate (Nunc) at 20,000 cells per well, which were cultured in Ham's F-12 medium containing 0.1 mM MEM non-essential amino acids, 0.5 mg/ml G418, 10% fetal bovine serum (all by Invitrogen) for 16 hours under the conditions of 37° C., 5% CO2. After removing the medium, 100 uL of 0.5 uM Fluo-4AM ester (Dojin) in an assay buffer (25 mM HEPES (Dojin), Hank's balanced salt solution (Invitrogen), 0.1% bovine serum albumin, 2.5 mM probenecid, 200 ug/ml Amaranth (all by Sigma-Aldrich), pH 7.4) was added and the cells were incubated for 60 minutes at 37° C., 5% CO2. After removing the medium, 100 uL of 0.5 uM Fluo-4AM ester (Dojin) in an assay buffer (25 mM HEPES (Dojin), Hank's balanced salt solution (Invitrogen), 0.1% bovine serum albumin, 2.5 mM probenecid, 200 ug/ml Amaranth (all by Sigma-Aldrich), pH 7.4) was added and the cells were incubated for 60 minutes at 37° C., 5% CO2. After removing the assay buffer containing fluo-3AM ester, the test compound was dissolved in dimethyl sulfoxide to be 10 mM and diluted with the assay buffer, 150 uL of which was added and incubated for 30 minutes.
- Biological Assay The compounds of the invention inhibit RORgammaT activity. Activation of RORgammaT activity can be measured using, e.g., biochemical TR-FRET assay. In such an assay, interaction of cofactor-derived peptides with human RORgammaT-Ligand Binding Domain (LBD) can be measured. The TR-FRET technique is a sensitive biochemical proximity assay that will give information concerning the interaction of a ligand with the LBD, in the presence of cofactor-derived peptides (Zhou et al., Methods 25:54-61, 2001).To identify novel antagonists of RORgammaT, an assay was developed which employs the interaction of RORgammaT with its co-activator peptide SRC1_2. This peptide mimics the recruitment of co-activators to RORgammaT through its interaction with the LXXLL (SEQ ID NO:1) (e.g., NR box) motifs (Xie et al., J. Immunol. 175: 3800-09, 2005; Kurebayashi et al., Biochem. Biophys. Res. Commun. 315: 919-27, 2004; Jin et al., Mol. Endocrinology 24:923-29, 2010). The RORγ-Ligand Binding Domain TR-FRET Assay was run according to the following protocol.HIS-tagged RORγ-LBD protein was expressed in SF9 cells using a baculovirus expression system. The RORγ-LBD protein was purified by glutathione sepharose chromatography. Separately, SF9 cells not expressing any recombinant protein were lysed and the lysate was added to the purified RORγ-LBD at 0.25 μl lysate (from 10,000 SF9 cells)/nM purified protein. The mixture was then diluted in assay buffer (50 mM Tris pH 7.0, 50 mM KCl, 1 mM EDTA, 0.1 mM DTT) to obtain RORγ-LBD final concentration of 3 nM in 384-well assay plate.
- CFTR-YFP Assay Fisher Rat Thyroid (FRT) cells stably expressing both human F508del CFTR and a halide-sensitive yellow fluorescent protein (YFP-H148Q/I152L 25,22) (Galietta et al., Am. J. Physiol Cell Physiol 281(5), C1734, 2001) were cultured on plastic surface in Coon's modified Ham's F12 medium supplemented with FBS 10%, L-glutamine 2 mM, penicillin 100 U/ml, and streptomycin 100 μg/ml. G418 (0.75-1.0 mg/ml) and zeocin (3.2 ug/ml) were used for selection of FRT cells expressing F508del CFTR and YFP. For primary screening, FRT cells were plated into 384-well black wall, transparent bottom microtiter plates (Costar; Corning Inc.) at a cell density of 20,000-40,000 per well. Cells were incubated in a cell culture incubator at 37° C. with 5% CO2 for 24-26 h. Assay plates were washed with DPBS media (Thermo, cat #SH30028.02) to remove unbound cells. Test compound was applied to the cells at varying concentrations ranging from 2 nM-40 μM in either a 2-fold or 3-fold dilution series in DPBS and stimulated with 20 μM Forskolin (final concentration) in Hams F-12 coon's modified media. Plates were incubated at room temperature for 60-120 min. 25 μL of HEPES-PBS-I buffer (10 mM HEPES, 1 mM MgCl2, 3 mM KCl, 1 mM CaCl2, 150 mM NaI) was then added and fluorescence quench curves (Excitation 500 nm/Emission 540 nm; exposure 136 ms) were immediately recorded on an FDSS-6000 plate reader (Hamamatsu). Quench rates were derived from least squares fitting of the data as described by Sui et al (2010).
- Assay for Dopamine Reuptake Inhibition Uptake inhibition assay for the dopamine transporter was conducted in rat brain synaptosomes as described elsewhere with minor modifications (Rothman et al., Synapse 39, 32-41 (2001)). Freshly removed caudate was homogenized in 10% ice-cold sucrose with 12 strokes of a hand-held Potter-Elvehjem homogenizer followed by centrifugation at 1000×g for 10 min. The supernatants were saved on ice and used immediately. Transporter activity was assessed using 5 nM [3H]dopamine. The assay buffer was Krebs-phosphate buffer containing 154.4 mM NaCl, 2.9 mM KCl, 1.1 mM CaCl2, 0.83 mM MgCl2, 5 mM glucose, 1 mg/mL ascorbic acid, and 50 μM pargyline. The selectivity of the uptake assay for DAT was optimized by including 100 nM citalopram and 100 nM desipramine as blockers of SERT and NET in the sucrose solution and assay buffer. Uptake inhibition assays were conducted at 25° C. and were initiated by adding 100 μl of tissue to 900 μL assay buffer containing test drug and [3H]dopamine. Test drugs were diluted in assay buffer containing 1 mg/mL bovine serum albumin. Nonspecific uptake was measured by incubating in the presence of 10 μM indatraline. The reactions were stopped after 15 minutes by rapid vacuum filtration with a cell harvester (BRANDEL) over GF/B filters (Whatman) presoaked in wash buffer maintained at 25° C. (10 mM Tris-HCl, pH 7.4/150 mM NaCl). Filters were rinsed with 6 mL wash buffer and retained tritium was quantified by a MicroBeta liquid scintillation counter (PerkinElmer) after overnight extraction in 0.6 mL of liquid scintillation cocktail (Cytoscint, ICN). The data from three experiments were pooled and fit to a dose-response curve equation (using Kaleidagraph), to yield an Emax and EC50 value.
- Biochemical TR-FRET assay The compounds of the invention inhibit RORgammaT activity. Activation of RORgammaT activity can be measured using, e.g., a biochemical TR-FRET assay. In such an assay, interaction of cofactor-derived peptides with human RORgammaT-Ligand Binding Domain (LBD) can be measured. The TR-FRET technique is a sensitive biochemical proximity assay that will give information concerning the interaction of a ligand with the LBD, in the presence of cofactor-derived peptides (Zhou et al., Methods 25:54-61, 2001).To identify novel antagonists of RORgammaT, an assay was developed which employs the interaction of RORgammaT with its co-activator peptide SRC1_2. This peptide mimics the recruitment of co-activators to RORgammaT through its interaction with the LXXLL (SEQ ID NO:1) (e.g., NR box) motifs (Xie et al., J. Immunol. 175: 3800-09, 2005; Kurebayashi et al., Biochem. Biophys. Res. Commun. 315: 919-27, 2004; Jin et al., Mol. Endocrinology 24:923-29, 2010). The RORγ-Ligand Binding Domain TR-FRET Assay was run according to the following protocol.HIS-tagged RORγ-LBD protein was recombinantly expressed in Escherichia coli. The RORγ-LBD protein was purified by Ni2+-affinity resin. Purified protein was then diluted in assay buffer (50 mM Tris pH 7.0, 50 mM KCl, 1 mM EDTA, 0.1 mM DTT, 100 μg/mL bovine serum albumin, delipidated) to obtain a RORγ-LBD final concentration of 3 nM. Europium tagged anti-HIS antibody was also added to this solution (1.25 nM). Separately, SF9 cells not expressing any recombinant protein were lysed (32,000 cells per μl in 25 mM Tris, 50 mM NaCl) and the previously frozen lysate was added to the diluted RORγ-LBD solution at a ratio of 0.75 μl SF9 lysate per 15 μl of diluted RORγ-LBD.
- Enzyme Inhibition Assay Measurements were performed using a modification of the scintillation proximity assay platform described previously by Georgopapadakou, N. H. et al. (22nd International Congress on Chemotherapy, 2001, Abstract P16.001). Compounds were solubilised in DMSO at a top concentration of 10 mM and serially diluted in half log steps to achieve a range of final assay concentrations of 100 uM to 1 nM. Compound at each concentration (100-fold final) was added to white 384 well plates in a volume of 0.5 ml. Human, A. fumigatus, T. brucei or L. major N-myristoyl transferase enzyme, dissolved to a working concentration of 10 nM in assay buffer (30 mM Tris/HCl pH 7.4, 0.5 mM EGTA, 0.5 mM EDTA, 1.25 mM DTT, 0.1% Triton X-100), was then added to columns 1 to 11 and 13 to 23 of the plates in a volume of 20 ml. To columns 12 and 24, 20 ml assay buffer was added to provide a no enzyme control. Following a 5 minute incubation at room temperature the substrates (GCGGSKVKPQPPQAK(Biotin)-Amide and myristoyl coenzyme A), dissolved in assay buffer, were added to all wells in a volume of 20 ml to start the reaction. The final concentrations of peptide and 3H-myristoyl coenzyme A were 0.5 mM and 125 nM respectively and the specific activity of the radiolabel was 8 Ci/mmol. Plates were then incubated at room temperature for up to 50 minutes (dependant upon the period of linearity for the different enzyme species) before SPA beads, suspended to 1 mg/ml in a stop solution (200 mM Phosphoric Acid/NaOH pH 4, 750 mM MgCl2), were added in a volume of 40 ml.
- Inhibition Assay The procedure for measuring the 11β-HSD1-inhibitory activity is as follows. The enzyme reaction and the measurement were carried out using a 384-well plate. The enzyme was prepared in accordance with Journal of Biological Chemistry, 2001, Vol. 276, p. 21343-21350. The reaction was carried out by adding a test compound at various concentrations to a reaction liquid consisting of a 5 mM phosphate buffer (pH 6.6), 200 nM cortisone, 40 μM reduced nicotinamide adenine dinucleotide phosphate (NADPH), and rat recombinant 11β-HSD1, followed by incubating at room temperature for one hour (10 μl/well). The test compound was prepared by dissolving in dimethyl sulfoxide (DMSO) such that a DMSO concentration reached 1% in the reaction liquid. After the enzyme reaction was completed, the enzyme inhibitory action was measured by detecting cortisol using a homogeneous time-resolved fluorescence (HTRF) method. Each of a d2-labeled cortisol containing 400 μM carbenoxolone and a cryptate-labeled cortisol antibody (CIS Bio International Co., Ltd.) was added at 5 μl/well, followed by incubating at room temperature for 2 hours, and then the fluorescence intensity was measured using a fluorophotometer (trade name: ARVO HTS 1420, Perkin Elmer/Wallac), and the enzyme inhibitory activity was calculated from the fluorescence intensity ratio of two wavelengths (665 nm/620 nm).The measurement results were calculated by averaging the values of 3 wells of the same condition. The ratio when DMSO was added instead of the test compound was taken as 0% and the ratio when 11β-HSD1 was not added was taken as 100%, thereby calculating the 50% inhibition concentration of the test compound as IC50 of the compound inhibitory activity.
- Selectivity Screening (AMPK) Candidates for inhibitor selectivity characterization were chosen based on an initial single-timepoint commercial kinome profiling screen performed with inhibitor 17 (MELK-In-7) (KinomeScan, DiscoveRx, San Diego, Calif.), primary sequence relation to MELK, and laboratory availability. CHK1 and NUAK1 were purchased from SignalChem (Vancouver, BC). The NUAK2, CHK, and SAMS peptides were purchased from BioSyn (Lewisville, Tex.). The sequence of CHK and NUAK2 peptides are described elsewhere (Sanchez Y, et al. Science (New York, N.Y.). 1997; 277(5331):1497-1501; Scott J W, et al. Sci Rep. 2015; 5:14436). ERK2, AMPK, CAMKK2, and Ets1 were produced in house as previously described (Waas W F, Dalby K N. The Journal of biological chemistry. 2002; 277(15):12532-12540; Neumann D, et al. Protein Expr Purif. 2003; 30(2):230-237; Waas W F, Dalby K N. Protein Expr Purif. 2001; 23(1):191-197). Apparent KM values for ATP under specific assay conditions were determined using respective experimental conditions in Table 8 with varied ATP (0-1.28 mM). All selectivity dose-response assays were performed in kinase assay buffer (see Inhibitor Library Screen) with 2 mM DTT and 100 μM γ-32P-ATP with additional conditions listed in Table 8. IC50 and KM ATP values were subsequently used to calculate Ki (Equation 4). Relative selectivity was determined by comparing Ki Enzyme/Ki MELK (termed φ in Table 7). All IC50 and/or Ki data were fit using Prism (GraphPad) using equations 2, 3, and 4, as appropriate. Standard error from linear regression data was propagated internally in Prism and taken into account in nonlinear regression to determine IC50 or Ki. 10 nM AMPK, 100 μM SAMS, 50 μM AMP 0.25-2 min 98 ± 8.4.
- Selectivity Screening (CAMKK2) Candidates for inhibitor selectivity characterization were chosen based on an initial single-timepoint commercial kinome profiling screen performed with inhibitor 17 (MELK-In-7) (KinomeScan, DiscoveRx, San Diego, Calif.), primary sequence relation to MELK, and laboratory availability. CHK1 and NUAK1 were purchased from SignalChem (Vancouver, BC). The NUAK2, CHK, and SAMS peptides were purchased from BioSyn (Lewisville, Tex.). The sequence of CHK and NUAK2 peptides are described elsewhere (Sanchez Y, et al. Science (New York, N.Y.). 1997; 277(5331):1497-1501; Scott J W, et al. Sci Rep. 2015; 5:14436). ERK2, AMPK, CAMKK2, and Ets1 were produced in house as previously described (Waas W F, Dalby K N. The Journal of biological chemistry. 2002; 277(15):12532-12540; Neumann D, et al. Protein Expr Purif. 2003; 30(2):230-237; Waas W F, Dalby K N. Protein Expr Purif. 2001; 23(1):191-197). Apparent KM values for ATP under specific assay conditions were determined using respective experimental conditions in Table 8 with varied ATP (0-1.28 mM). All selectivity dose-response assays were performed in kinase assay buffer (see Inhibitor Library Screen) with 2 mM DTT and 100 μM γ-32P-ATP with additional conditions listed in Table 8. IC50 and KM ATP values were subsequently used to calculate Ki (Equation 4). Relative selectivity was determined by comparing Ki Enzyme/Ki MELK (termed φ in Table 7). All IC50 and/or Ki data were fit using Prism (GraphPad) using equations 2, 3, and 4, as appropriate. Standard error from linear regression data was propagated internally in Prism and taken into account in nonlinear regression to determine IC50 or Ki. 50 nM CAMKK2, 200 μM, NUAK2 peptide, 150 μM total Ca2+, 1 μM calmodulin 0.5-6 min 265 ± 25.
- Selectivity Screening (CHK1) Candidates for inhibitor selectivity characterization were chosen based on an initial single-timepoint commercial kinome profiling screen performed with inhibitor 17 (MELK-In-7) (KinomeScan, DiscoveRx, San Diego, Calif.), primary sequence relation to MELK, and laboratory availability. CHK1 and NUAK1 were purchased from SignalChem (Vancouver, BC). The NUAK2, CHK, and SAMS peptides were purchased from BioSyn (Lewisville, Tex.). The sequence of CHK and NUAK2 peptides are described elsewhere (Sanchez Y, et al. Science (New York, N.Y.). 1997; 277(5331):1497-1501; Scott J W, et al. Sci Rep. 2015; 5:14436). ERK2, AMPK, CAMKK2, and Ets1 were produced in house as previously described (Waas W F, Dalby K N. The Journal of biological chemistry. 2002; 277(15):12532-12540; Neumann D, et al. Protein Expr Purif. 2003; 30(2):230-237; Waas W F, Dalby K N. Protein Expr Purif. 2001; 23(1):191-197). Apparent KM values for ATP under specific assay conditions were determined using respective experimental conditions in Table 8 with varied ATP (0-1.28 mM). All selectivity dose-response assays were performed in kinase assay buffer (see Inhibitor Library Screen) with 2 mM DTT and 100 μM γ-32P-ATP with additional conditions listed in Table 8. IC50 and KM ATP values were subsequently used to calculate Ki (Equation 4). Relative selectivity was determined by comparing Ki Enzyme/Ki MELK (termed φ in Table 7). All IC50 and/or Ki data were fit using Prism (GraphPad) using equations 2, 3, and 4, as appropriate. Standard error from linear regression data was propagated internally in Prism and taken into account in nonlinear regression to determine IC50 or Ki. 5 nM CHK1, 100 μM CHK peptide 0.25-4 min 125 ± 2.5.
- Selectivity Screening (ERK2) Candidates for inhibitor selectivity characterization were chosen based on an initial single-timepoint commercial kinome profiling screen performed with inhibitor 17 (MELK-In-7) (KinomeScan, DiscoveRx, San Diego, Calif.), primary sequence relation to MELK, and laboratory availability. CHK1 and NUAK1 were purchased from SignalChem (Vancouver, BC). The NUAK2, CHK, and SAMS peptides were purchased from BioSyn (Lewisville, Tex.). The sequence of CHK and NUAK2 peptides are described elsewhere (Sanchez Y, et al. Science (New York, N.Y.). 1997; 277(5331):1497-1501; Scott J W, et al. Sci Rep. 2015; 5:14436). ERK2, AMPK, CAMKK2, and Ets1 were produced in house as previously described (Waas W F, Dalby K N. The Journal of biological chemistry. 2002; 277(15):12532-12540; Neumann D, et al. Protein Expr Purif. 2003; 30(2):230-237; Waas W F, Dalby K N. Protein Expr Purif. 2001; 23(1):191-197). Apparent KM values for ATP under specific assay conditions were determined using respective experimental conditions in Table 8 with varied ATP (0-1.28 mM). All selectivity dose-response assays were performed in kinase assay buffer (see Inhibitor Library Screen) with 2 mM DTT and 100 μM γ-32P-ATP with additional conditions listed in Table 8. IC50 and KM ATP values were subsequently used to calculate Ki (Equation 4). Relative selectivity was determined by comparing Ki Enzyme/Ki MELK (termed φ in Table 7). All IC50 and/or Ki data were fit using Prism (GraphPad) using equations 2, 3, and 4, as appropriate. Standard error from linear regression data was propagated internally in Prism and taken into account in nonlinear regression to determine IC50 or Ki. 1 nM ERK2, 20 μM Ets-1 0.25-4 min 98 ± 14
- Selectivity Screening (NUAK1) Candidates for inhibitor selectivity characterization were chosen based on an initial single-timepoint commercial kinome profiling screen performed with inhibitor 17 (MELK-In-7) (KinomeScan, DiscoveRx, San Diego, Calif.), primary sequence relation to MELK, and laboratory availability. CHK1 and NUAK1 were purchased from SignalChem (Vancouver, BC). The NUAK2, CHK, and SAMS peptides were purchased from BioSyn (Lewisville, Tex.). The sequence of CHK and NUAK2 peptides are described elsewhere (Sanchez Y, et al. Science (New York, N.Y.). 1997; 277(5331):1497-1501; Scott J W, et al. Sci Rep. 2015; 5:14436). ERK2, AMPK, CAMKK2, and Ets1 were produced in house as previously described (Waas W F, Dalby K N. The Journal of biological chemistry. 2002; 277(15):12532-12540; Neumann D, et al. Protein Expr Purif. 2003; 30(2):230-237; Waas W F, Dalby K N. Protein Expr Purif. 2001; 23(1):191-197). Apparent KM values for ATP under specific assay conditions were determined using respective experimental conditions in Table 8 with varied ATP (0-1.28 mM). All selectivity dose-response assays were performed in kinase assay buffer (see Inhibitor Library Screen) with 2 mM DTT and 100 μM γ-32P-ATP with additional conditions listed in Table 8. IC50 and KM ATP values were subsequently used to calculate Ki (Equation 4). Relative selectivity was determined by comparing Ki Enzyme/Ki MELK (termed φ in Table 7). All IC50 and/or Ki data were fit using Prism (GraphPad) using equations 2, 3, and 4, as appropriate. Standard error from linear regression data was propagated internally in Prism and taken into account in nonlinear regression to determine IC50 or Ki. 10 nM NUAK1, 100 μM CHK peptide 0.25-4 min 60 ± 3.6.
- ThermoFluor (Tf) assay The ThermoFluor is a fluorescence based assay (Tf) that estimates ligand binding affinities by measuring the effect of a ligand on protein thermal stability (Pantoliano, M. W., et al., J. Biomol. Screen 2001, 6, 429-40.). This approach is applicable to a wide variety of systems, and rigorous in theoretical interpretation through quantitation of equilibrium binding constants (KD).In a ThermoFluor experiment where protein stability is monitored as the temperature is steadily increased, an equilibrium binding ligand causes the midpoint of an unfolding transition (Tm) to occur at a higher temperature. The shift in the melting point described as a ΔTm is proportional to the concentration and affinity of the ligand. The compound potency may be compared as a rank order of either ΔTm values at a single compound concentration or in terms of KD values, estimated from concentration response curves.The details of the KEAP1 KELCH ThermoFluor Assay Construct are as follows: Kelch domain of human KEAP1 (321-624 aa) was used in the assay. The protein was expressed in E. coli with 6His tag that was cleaved prior to receipt for use.ThermoFluor experiments were carried out using instruments owned by Janssen Research and Discovery, L.L.C. through its acquisition of 3-Dimensional Pharmaceuticals, Inc. 1,8-ANS (Invitrogen) was used as a fluorescent dye. Protein (KEAP Kelch) and compound solutions were dispensed into black 384-well polypropylene PCR microplates (Abgene) and overlayed with silicone oil (1 μL, Fluka, type DC 200) to prevent evaporation.Reference wells contained KEAP Kelch without compounds, and the assay conditions were as follows: 1.1 μM (0.037 mg/mL) KEAP Kelch, 80 μM 1,8-ANS, 25 mM PIPES, pH 7.0, 100 mM NaCl, 0.002% Tween-20.The binding affinity was estimated as described previously (Matulis, D. et al., Biochemistry 2005, 44, 5258-66) using thermodynamic parameters of protein unfolding listed below.
- 3H]-Spiperone Binding Assay CHO cells stably expressing human dopamine receptor type 2, long variant (hD2L), coupled to Gα16 protein (CHO-Gα16-hD2L) were re-suspended in 20 mM HEPES, 2 mM EDTA (pH 7.4), homogenised and centrifuged at 40,000 g (20 min, 4° C.). After re-suspension, homogenization and centrifugation as above, the final pellet was re-suspended in 20 mM HEPES, 100 mM NaCl, 10 mM MgCl2, 1 mM EDTA (pH 7.4) and aliquots were kept at −80° C. [3H]-Spiperone Binding experiments were performed in 96 deep-well polypropylene plates in 50 mM Tris/HCl, 120 mM NaCl, 5 mM KCl, 5 mM MgCl2 (pH 7.4). Compounds of invention were serially diluted in DMSO at 100 fold final concentrations in the assay (1% DMSO final in the assay). Displacement was performed in the presence of 0.08 nM [3H]-Spiperone. The reaction was initiated by the addition of membrane suspension (2 μg of protein for CHO-hD2 membranes) and lasted for 120 min at 23° C. in a final volume of 1000 μl. Non specific binding (NSB) was determined in the presence of 0.1 μM Spiperone. The binding reaction was stopped by rapid filtration through GF/B filterplates pre-soaked in 0.5% polyetylenimmine (PEI) using a Packard cell harvester. After washing with ice-cold 0.9% NaCl, the plate was left to dry before the addition of Microscint 20 (50 μl/well, PerkinElmer). Radioactivity was counted with a TopCount (PerkinElmer). Data were analysed by non-linear regression analysis using GraphPad Prism 5.0 (GraphPad Software) or XLfit Version 5.2.0.0 (Copyright 2006-2009 ID Business Solutions Ltd). Saturation binding experiments were performed similar to the competition binding experiments using a radioligand concentrations ranging from 0.011 to 3.0 nM. Ref: Durcan M. J. et al. (1995). Is Clozapine selective for the dopamine D4 receptor? Life Sciences, 57: 275-283. Petrus J. et al. (2001).
- Ba/F3 cell model generation and proliferation assays Ba/F3 cells were ordered from DSMZ (ACC300, Lot17) and grown in RPMI-1640 (ATCC 30-2001) + 10 % FCS + 10 ng/ml IL-3 at 37 °C in 5 % CO2 atmosphere. Plasmids containing EGFR mutants were obtained from GeneScript. To generate EGFR-dependent Ba/F3 models, Ba/F3 cells were transduced with retroviruses containing vectors that harbor EGFR isoforms. Platinum-E cells (Cell Biolabs) were used for retrovirus packaging. Retrovirus was added to Ba/F3 cells. To ensure infection, 4 μg/mL polybrene was added and cells were spinfected. Infection efficiency was confirmed by measuring GFP-positive cells using a cell analyzer. Cells with an infection efficiency of 10 % to 20 % were further cultivated and puromycin selection with 1 μg/mL was initiated. As a control, parental Ba/F3 cells were used to show selection status. Selection was considered successful when parental Ba/F3 cells cultures died. To evaluate the transforming potential of EGFR mutations, the growth medium was no longer supplemented with IL-3. Ba/F3 cells harboring the empty vector were used as a control. A switch from IL-3 to EGF was performed for Ba/F3 cells with the wildtype EGFR known for its dependency on EGF ligand. Approximately ten days before conducting the experiments, puromycin was left out. For proliferation assays (data in table 13), Ba/F3 cells were seeded into 96-well plates at 5 x 10³ cells / 100 μL in growth media. Compounds were added by using a HP D3000 Digital Dispenser. All treatments were performed in technical triplicates. Treated cells were incubated for 72 h at 37 °C with 5 % CO2. CellTiter-Glo Luminescent Cell Viability Assay (Promega) was performed and chemoluminescence was measured by using the multilabel Plate Reader VICTOR X4. The raw data were imported into and analyzed with the Boehringer Ingelheim proprietary software MegaLab (curve fitting based on the program PRISM, GraphPad Inc.).
- FLIPR Ca2+ Flux Assay FLIPR Ca2+ Flux Assay- (Okumura et al., Biochem. Biophys. Res. Comm. 280:976-981, 2001). In a typical experiment the OX1 and OX2 receptor antagonistic activity of the compounds of the present invention was determined in accordance with the following experimental method. For intracellular calcium measurements, Chinese hamster ovary (CHO) cells expressing the rat orexin-1 receptor or the human orexin-2 receptor, are grown in Iscove's modified DMEM containing 2 mM L-glutamine, 0.5 g/ml G418, 1% hypoxanthine-thymidine supplement, 100 U/ml penicillin, 100 μg/ml streptomycin and 10% heat-inactivated fetal calf serum (FCS). The cells are seeded at 20,000 cells/well into Becton-Dickinson black 384-well clear bottom sterile plates coated with poly-D-lysine. All reagents were from GIBCO-Invitrogen Corp. The seeded plates are incubated overnight at 37° CO2. and 5% CO2. Ala-6,12 human orexin-A as the agonist is prepared as a 1 mM stock solution in 1% bovine serum albumin (BSA) and diluted in assay buffer (HBSS containing 20 mM HEPES, 0.1% BSA and 2.5 mM probenecid, pH7.4) for use in the assay at a final concentration of 70 pM. Test compounds are prepared as 10 mM stock solution in DMSO, then diluted in 384-well plates, first in DMSO, then assay buffer. On the day of the assay, cells are washed 3 times with 100 μl assay buffer and then incubated for 60 min (37° C., 5% CO2) in 60 μl assay buffer containing 1 μM Fluo-4AM ester, 0.02% pluronic acid, and 1% BSA. The dye loading solution is then aspirated and cells are washed 3 times with 100 μl assay buffer. 30 μl of that same buffer is left in each well. Within the Fluorescent Imaging Plate Reader (FLIPR, Molecular Devices), test compounds are added to the plate in a volume of 25 μl, incubated for 5 min and finally 25 μl of agonist is added.
- FLIPR assay The FLIPR assay is an exemplary in vitro assay for measuring the activity of the PAR4 antagonists of the present invention. In this assay, intracellular calcium mobilization is induced in PAR4 expressing cells by a PAR4 agonist and calcium mobilization is monitored. See, e.g., Example A.AYPGKF is a known PAR4 agonist. An alternative PAR4 agonist is H-Ala-Phe(4-F)-Pro-Gly-Trp-Leu-Val-Lys-Asn-Gly-NH2. H-Ala-Phe(4-F)-Pro-Gly-Trp-Leu-Val-Lys-Asn-Gly-NH2 has improved agonist activity as compared to AYPGKF with an EC50 that is 10 fold lower than the EC50 for AYPGKF in the FLIPR assay. H-Ala-Phe(4-F)-Pro-Gly-Trp-Leu-Val-Lys-Asn-Gly-NH2 can be synthesized using methods well known to those of skill in the art.The FLIPR assay can also be used as a counterscreen to test agonist activity or PAR1 antagonist activity in a cell line that expresses both PAR1 and PAR4. The PAR1 antagonist activity can be tested by the ability of the compound to inhibit calcium mobilization induced by the PAR1 agonist peptide SFLLRN or other PAR1 agonist peptides.The compounds of the current invention can be tested in vitro for their ability to inhibit platelet aggregation induced by gamma-thrombin as shown in Example B. Gamma-thrombin, a proteolytic product of alpha-thrombin which no longer interacts with PAR1, selectively cleaves and activates PAR4 (Soslau, G. et al., Unique pathway of thrombin-induced platelet aggregation mediated by glycoprotein Ib , J. Biol. Chem., 276:21173-21183 (2001)). Platelet aggregation can be monitored in a 96-well microplate aggregation assay format or using standard platelet aggregometer. The aggregation assay can also be employed to test the selectivity of the compound for inhibiting platelet aggregation induced by PAR4 agonist peptides, PAR1 agonist peptide, ADP, or thromboxane analogue U46619.Example C is an alpha-thrombin-induced platelet aggregation assay. Alpha-thrombin activates both PAR1 and PAR4.
- In Vivo Inhibition of Beta-Secretase Several animal models, including mouse, rat, dog, and monkey, may be used to screen for inhibition of beta-secretase activity in vivo following administration of a test compound sample. Animals used in this invention can be wild type, transgenic, or gene knockout animals. For example, the Tg2576 mouse model, prepared and conducted as described in Hsiao et al., 1996, Science 274, 99-102, and other non-transgenic or gene knockout animals are useful to analyze in vivo inhibition of Amyloid beta peptide (Abeta) production in the presence of inhibitory test compounds. Generally, 2 to 18 month old Tg2576 mice, gene knockout mice or non-transgenic animals are administered test compounds formulated in vehicles, such as cyclodextran, phosphate buffers, hydroxypropyl methylcellulose or other suitable vehicles. One to twenty-four hours following the administration of compound, animals are sacrificed, and brains as well as cerebrospinal fluid (CSF) and plasma are removed for analysis of A-beta levels and drug or test compound concentrations (Dovey et al., 2001, Journal of Neurochemistry, 76, 173-181) Beginning at time 0, animals are administered by oral gavage, or other means of delivery such as intravenous injection, an inhibitory test compound of up to 100 mg/kg in a standard, conventional formulation, such as 2% hydroxypropyl methylcellulose, 1% Tween80. A separate group of animals receive 2% hydroxypropyl methylcellulose, 1% Tween80 alone, containing no test compound, and serve as a vehicle-control group. At the end of the test period, animals are sacrificed and brain tissues, plasma or cerebrospinal fluid are collected. Brains are either homogenized in 10 volumes (w/v) of 0.2% diethylamine (DEA) in 50 mM NaCl (Best et al., 2005, Journal of Pharmacology and Experimental Therapeutics, 313, 902-908), or in 10 volumes of 0.5% TritonX-100 in Tris-buffered saline (pH at about 7.6). Homogenates are centrifuged at 355,000 g, 4° C. for 30 minutes. CSF or brain supernatants are then analyzed for the presence of A-beta peptide by specific sandwich ELISA assays based on ECL (Electrochemiluminescence) technology.
- YFP-Halide Influx Assay YFP-Halide Influx Assay for the CFTR-ΔF508 Mutation and Suppressor mutants (I539T or G550E)The YFP halide influx assay measures the functionality of the Cystic Fibrosis Transmembrane Conductance regulator (CFTR) channels in the cystic fibrosis bronchial epithelium cell line CFBE4lo−. The fluorescence of the yellow fluorescent protein (YFP) variant YFP H148Q, I152L or variant YFP H148Q, I152L & F47L is substantially quenched by iodine, a halide that is efficiently transported by CFTR. The assay is thus used to evaluate the effect of corrector compounds on CFTR channel function by measuring the extent of YFP signal quenching. (Galietta et al. American Journal of Physiology Cell Physiology Vol. 281 no. 5, C1734-C1742, 2001; Nagai et al., Nat Biotechnol. 2002 January; 20(1):87-90.)For this purpose, HEK293 cells are transfected with plasmid DNA containing F508del CFTR, F508del/I539T CFTR or F508del/G550E CFTR and seeded in 96 well plates (70,000 HEK cells/well). The next day, cells are treated with test compounds.Cells are treated with test compounds for 24 h at 37° C. to allow trafficking of corrected CFTR to the membrane.The next day the CFTR channels are activated by treatment with the cAMP inducer forskolin (10.67 μM) and potentiator GLPG1837 (0.5 μM) in 1×D-PBS (from Gibco, Cat n#14090-091) for 20 minutes prior to addition of an I− solution (137 mM NaI, 2.7 mM KI, 1.76 mM KH2PO4, 10.1 mM Na2HPO4, 5 mM glucose). The I− induced quenching of fluorescence is recorded immediately after injection of for 7 seconds. The capacity of a compound to increase number of channels, and therefore overall halide influx is directly correlated with the decrease in fluorescence, and is expressed as (1−(fluorescence after 7 seconds (F)/fluorescence before injection (F0))) and an EC50 can be derived from a (1-F/F0) vs compound concentration plot.
- Biological Assay The compounds of the invention inhibit RORgammaT activity. Activation of RORgammaT activity can be measured using, e.g., biochemical TR-FRET assay. In such an assay, interaction of cofactor-derived peptides with human RORgammaT-Ligand Binding Domain (LBD) can be measured. The TR-FRET technique is a sensitive biochemical proximity assay that will give information concerning the interaction of a ligand with the LBD, in the presence of cofactor-derived peptides (Zhou et al., Methods 25:54-61, 2001).To identify novel antagonists of RORgammaT, an assay was developed which employs the interaction of RORgammaT with its co-activator peptide SRC1_2. This peptide mimics the recruitment of co-activators to RORgammaT through its interaction with the LXXLL (e.g., NR box) motifs (Xie et al., J. Immunol. 175: 3800-09, 2005; Kurebayashi et al., Biochem. Biophys. Res. Commun. 315: 919-27, 2004; Jin et al., Mol. Endocrinology 24:923-29, 2010). The RORγ-Ligand Binding Domain TR-FRET Assay was run according to the following protocol.HIS-tagged RORγ-LBD protein was recombinantly expressed in Escherichia coli. The RORγ-LBD protein was purified by Ni2+-affinity resin. Purified protein was then diluted in assay buffer (50 mM Tris pH 7.0, 50 mM KCl, 1 mM EDTA, 0.1 mM DTT, 100 mg/ml bovine serum albumin, delipidated) to obtain a RORγ-LBD final concentration of 3 nM. Europium tagged anti-HIS antibody was also added to this solution (1.25 nM). Separately, SF9 cells not expressing any recombinant protein were lysed (32,000 cells per ml in 25 mM Tris, 50 mM NaCl) and the previously frozen lysate was added to the diluted RORγ-LBD solution at a ratio of 0.75 ml SF9 lysate per 15 ml of diluted RORγ-LBD.Compounds to be tested were injected to the 384-well assay plate using Acoustic Droplet Ejection technology by Echo 550 liquid handler (Labcyte, CA).A stock of biotinylated-LXXLL peptide from coactivator SRC1 (Biotin-SPSSHSSLTERHKILHRLLQEGSP) (SEQ ID NO:1) and APC-conjugated streptavidin (final concentrations 100 nM and 8 nM respectively) were also added to each well.
- FLIPR Ca2+ Flux Assay The following table shows representative data for the compounds of the Examples as orexin receptor antagonists as determined by the FLIPR Ca2+ Flux Assay (Okumura et al., Biochem. Biophys. Res. Comm., 2001, 280:976-981). Chinese hamster ovary (CHO) cells expressing the human orexin-1 receptor (hOX1R) or the human orexin-2 receptor (hOX2R) were grown in Iscove's modified DMEM containing 2 mM L-glutamine, 0.5 g/ml G418, 1% hypoxanthine-thymidine supplement, 100 U/ml penicillin, 100 μg/ml streptomycin and 10% heat-inactivated fetal calf serum (FCS). The cells were seeded at 20,000 cells/well into Becton-Dickinson black 384-well clear bottom sterile plates coated with poly-D-lysine. All reagents were from GIBCO-Invitrogen Corp. The seeded plates were incubated overnight at 37° C. and 5% CO2. Ala-6,12 human orexin-A, used as the agonist, was prepared as a 1 mM stock solution in 1% bovine serum albumin (BSA) and diluted in assay buffer (HBSS containing 20 mM HEPES, 0.1% BSA and 2.5 mM probenecid, pH7.4) for use in the assay at a final concentration of 70 pM. Test compounds were prepared as 10 mM stock solution in DMSO, then diluted in 384-well plates, first in DMSO, then assay buffer.On the day of the assay, cells were washed 3× with 100 μl assay buffer and then incubated for 60 minutes (37° C., 5% CO2) in 60 μl assay buffer containing 1 μM Fluo-4AM ester, 0.02% pluronic acid, and 1% BSA. The dye loading solution was then aspirated and cells were washed 3× with 100 μl assay buffer. 30 μl of that same buffer was left in each well. Within the Fluorescent Imaging Plate Reader (FLIPR, Molecular Devices), test compounds were added to the plate in a volume of 25 μl, incubated for 5 minutes, and then 25 μl of agonist was added. Fluorescence was measured for each well at 1 second intervals for 5 minutes, and the height of each fluorescence peak was compared to the height of the fluorescence peak induced by 70 pM of Ala-6,12 orexin-A with buffer in place of test compound.
- [3H]-Spiperone Binding Assay at hD2 Recombinant Receptor CHO cells stably expressing human dopamine receptor type 2, long variant (hD2L), coupled to Gα16 protein (CHO-Gα16-hD2L) were re-suspended in 20 mM HEPES, 2 mM EDTA (pH 7.4), homogenised and centrifuged at 40,000 g (20 min, 4° C.). After re-suspension, homogenization and centrifugation as above, the final pellet was re-suspended in 20 mM HEPES, 100 mM NaCl, 10 mM MgCl2, 1 mM EDTA (pH 7.4) and aliquots were kept at −80° C. [3H]-Spiperone Binding experiments were performed in 96 deep-well polypropylene plates in 50 mM Tris/HCl, 120 mM NaCl, 5 mM KCl, 5 mM MgCl2 (pH 7.4). Compounds of invention were serially diluted in DMSO at 100 fold final concentrations in the assay (1% DMSO final in the assay). Displacement was performed in the presence of 0.08 nM [3H]-Spiperone. The reaction was initiated by the addition of membrane suspension (2 μg of protein for CHO-hD2 membranes) and lasted for 120 min at 23° C. in a final volume of 1000 μl. Non specific binding (NSB) was determined in the presence of 0.1 μM Spiperone. The binding reaction was stopped by rapid filtration through GF/B filterplates pre-soaked in 0.5% polyetylenimmine (PEI) using a Packard cell harvester. After washing with ice-cold 0.9% NaCl, the plate was left to dry before the addition of Microscint 20 (50 μl/well, PerkinElmer). Radioactivity was counted with a TopCount (PerkinElmer). Data were analysed by non-linear regression analysis using GraphPad Prism 5.0 (GraphPad Software) or XLfit Version 5.2.0.0 (Copyright 2006-2009 ID Business Solutions Ltd). Saturation binding experiments were performed similar to the competition binding experiments using a radioligand concentrations ranging from 0.011 to 3.0 nM. Ref: Durcan M. J. et al. (1995). Is Clozapine selective for the dopamine D4 receptor? Life Sciences, 57: 275-283. Petrus J. et al. (2001). Real-time analysis of dopamine: antagonist interactions at recombinant human D2long receptor upon modulation of its activation state. Brit. J. Pharmacol. 134, 88±97.
- [3H]-Spiperone Binding Assay at hD2 recombinant receptor CHO cells stably expressing human dopamine receptor type 2, long variant (hD2L), coupled to Gα16 protein (CHO-Gα16-hD2L) were re-suspended in 20 mM HEPES, 2 mM EDTA (pH 7.4), homogenised and centrifuged at 40,000 g (20 min, 4° C.). After re-suspension, homogenization and centrifugation as above, the final pellet was re-suspended in 20 mM HEPES, 100 mM NaCl, 10 mM MgCl2, 1 mM EDTA (pH 7.4) and aliquots were kept at −80° C. [3H]-Spiperone Binding experiments were performed in 96 deep-well polypropylene plates in 50 mM Tris/HCl, 120 mM NaCl, 5 mM KCl, 5 mM MgCl2 (pH 7.4). Compounds of invention were serially diluted in DMSO at 100 fold final concentrations in the assay (1% DMSO final in the assay). Displacement was performed in the presence of 0.08 nM [3H]-Spiperone. The reaction was initiated by the addition of membrane suspension (2 μg of protein for CHO-hD2 membranes) and lasted for 120 min at 23° C. in a final volume of 1000 μl. Non specific binding (NSB) was determined in the presence of 0.1 μM Spiperone. The binding reaction was stopped by rapid filtration through GF/B filterplates pre-soaked in 0.5% polyetylenimmine (PEI) using a Packard cell harvester. After washing with ice-cold 0.9% NaCl, the plate was left to dry before the addition of Microscint 20 (50 μl/well, PerkinElmer). Radioactivity was counted with a TopCount (PerkinElmer). Data were analysed by non-linear regression analysis using GraphPad Prism 5.0 (GraphPad Software) or XLfit Version 5.2.0.0 (Copyright 2006-2009 ID Business Solutions Ltd). Saturation binding experiments were performed similar to the competition binding experiments using a radioligand concentrations ranging from 0.011 to 3.0 nM. Ref: Durcan M. J. et al. (1995). Is Clozapine selective for the dopamine D4 receptor? Life Sciences, 57: 275-283. Petrus J. et al. (2001). Real-time analysis of dopamine: antagonist interactions at recombinant human D2long receptor upon modulation of its activation state. Brit. J. Pharmacol. 134, 88±97.
- pEGFR assay This assay quantifies the phosphorylation of EGFR at Tyr1068 and was used to measure the inhibitory effect of compounds on the transgenic EGFR del19 T790M C797S protein in Ba/F3 cells. Murine Ba/F3 cells were grown in RPMI-1640 (ATCC 30-2001) + 10 % FCS + 10 ng/mL IL-3 at 37 °C in 5 % CO2 atmosphere and transduced with a retroviral vector encoding EGFR del19 T790M C797S. Transduced cells were selected using puromycin. Following selection, IL-3 was withdrawn and IL-3 independent cells cultured. p-EGFR Tyr1068 was determined using the AlphaScreen Surefire pEGF Receptor (Tyr1068) Assay (PerkinElmer, TGRERS). For the assay, Ba/F3 EGFR del19 T790M C797S cells were seeded in DMEM medium with 10 % FCS.60 nL compound dilutions were added to each well of Greiner TC 384 plates using the Echo platform. Subsequently, 60.000 cells/well in 60 µL were added. Cells were incubated with compound for 4 h at 37 °C. Following centrifugation and removal of the medium supernatant, 20 µL of 1.6-fold lysis buffer from TGR/Perkin Elmer kit with protease inhibitors was added. The mixture was incubated at room temperature with shaking (700 rpm) for 20 min. After centrifugation, 4 µL of the lysate were transferred to Proxiplates. 5 µL of Acceptor Mix (Activation Buffer diluted 1:25 in combined Reaction Buffer 1 and Reaction Buffer 2 (TGRERS Assay Kit, PerkinElmer) plus 1:50 of Protein A Acceptor Beads 6760137) were added to each well. Plates were shaken for 1 min (1400 rpm) and incubated for 2 h at room temperature in the dark.3 µL of donor mix (AlphaScreen Streptavidin-coated Donor Beads (6760002, PerkinElmer) 1:50 diluted in Dilution Buffer (TGRERS Assay Kit, PerkinElmer) were added to each well. Plates were shaken for 1 min (1400 rpm) and incubated for 2 h at room temperature in the dark. Plates were subsequently analyzed using an Envision reader platform. Results were computed in the following way: The ratio of the value of the test compound and the value of the negative control (DMSO) was calculated. IC50 values are computed from these values in the MEGASTAR IC50 application using a 4 parametric logistic model.
- Measurement of Interferon Production in Human PBMC Activation of human TLR7 results in robust production of interferon by plasmacytoid dendritic cells present in human blood. The potential of compounds to induce interferon was evaluated by looking at the antiviral activity in the HCV replicon system upon incubation with conditioned media from peripheral blood mononuclear cells (PBMC). The HCV replicon assay is based on a bicistronic expression construct, as described by Lohmann et al. (Science (1999) 285: 110-113; Journal of Virology (2003) 77: 3007-15 3019) with modifications described by Krieger et al. (Journal of Virology (2001) 75: 4614-4624). The assay utilized the stably transfected cell line Huh-7 luc/neo harboring an RNA encoding a bicistronic expression construct comprising the wild type NS3-NS5B regions of HCV type 1b translated from an Internal Ribosome Entry Site (IRES) from encephalomyocarditis virus (EMCV), preceded by a reporter gene (Firefly-luciferase) and a selectable marker gene (neoR, neomycine phosphotransferase). The construct is flanked by 5′ and 3′ NTRs (non-translated regions) from HCV type 1b. Continued culture of the replicon cells in the presence of G418 (neoR) is dependent on the replication of the HCV RNA. The stably transfected replicon cells that replicate HCV RNA autonomously and to high levels, encoding inter alia luciferase, were used for profiling of the conditioned cell culture media. Briefly, PBMCs were prepared from buffy coats of at least two donors using a standard Ficoll centrifugation protocol. Isolated PBMCs were resuspended in RPMI medium supplemented with 10% human AB serum and 2×10⁵ cells/well were dispensed into 384-well plates containing compounds (70 μL total volume). After overnight incubation, μL of supernatant was transferred to 384-well plates containing 2.2×10³ replicon cells/well in 30 μL (plated the day before). Following 24 hours of incubation, replication was measured by assaying luciferase activity using 40 μL/well Steady Lite Plus substrate (Perkin Elmer) and measured with ViewLux ultraHTS microplate imager (Perkin Elmer). The inhibitory activity of each compound on the Huh7-luc/neo cells were reported as EC50 values, defined as the compound concentration applied to the PBMCs resulting in a 50% reduction of luciferase activity which in turn indicates the degree of replication of the replicon RNA on transfer of a defined amount of PBMC culture medium. Recombinant interferon α-2a (Roferon-A) was used as a standard control compound.
- Biological Assay The compounds of the invention inhibit RORgammaT activity. Activation of RORgammaT activity can be measured using, e.g., biochemical TR-FRET assay. In such an assay, interaction of cofactor-derived peptides with human RORgammaT-Ligand Binding Domain (LBD) can be measured. The TR-FRET technique is a sensitive biochemical proximity assay that will give information concerning the interaction of a ligand with the LBD, in the presence of cofactor-derived peptides (Zhou et al., Methods 25:54-61, 2001).To identify novel antagonists of RORgammaT, an assay was developed which employs the interaction of RORgammaT with its co-activator peptide SRC1_2. This peptide mimics the recruitment of co-activators to RORgammaT through its interaction with the LXXLL (SEQ ID NO:1) (e.g., NR box) motifs (Xie et al., J. Immunol. 175: 3800-09, 2005; Kurebayashi et al., Biochem. Biophys. Res. Commun. 315: 919-27, 2004; Jin et al., Mol. Endocrinology 24:923-29, 2010). The RORγ-Ligand Binding Domain TR-FRET Assay was run according to the following protocol.HIS-tagged RORγ-LBD protein was expressed in SF9 cells using a baculovirus expression system. The RORγ-LBD protein was purified by glutathione sepharose chromatography. Separately, SF9 cells not expressing any recombinant protein were lysed and the lysate was added to the purified RORγ-LBD at 0.25 μl lysate (from 10,000 SF9 cells)/nM purified protein. The mixture was then diluted in assay buffer (50 mM Tris pH 7.0, 50 mM KCl, 1 mM EDTA, 0.1 mM DTT) to obtain RORγ-LBD final concentration of 3 nM in 384-well assay plate.Compounds to be tested were injected to the assay plate using Acoustic Droplet Ejection technology by Echo 550 liquid handler (Labcyte, CA).A stock of biotinylated-LXXLL peptide from coactivator SRC1 (Biotin-CPSSHSSLTERHKILHRLLQEGSPS) (SEQ ID NO:2) was prepared in assay buffer and added to each well (100 nM final concentration). A solution of Europium tagged anti-HIS antibody (1.25 nM final concentration) and APC conjugated streptavidin (8 nM final concentration) were also added to each well.The final assay mixture was incubated overnight at 4° C., and the fluorescence signal was measured on an Envision plate reader: (Excitation filter=340 nm; APC emission=665 nm; Europium emission=615 nm; dichroic mirror=D400/D630; delay time=100 μs, integration time=200 μs). IC50 values for test compounds were calculated from the quotient of the fluorescence signal at 665 nm divided by the fluorescence signal at 615 nm.
- Biological Assay The compounds of the invention inhibit RORgammaT activity. Activation of RORgammaT activity can be measured using, e.g., biochemical TR-FRET assay. In such an assay, interaction of cofactor-derived peptides with human RORgammaT-Ligand Binding Domain (LBD) can be measured. The TR-FRET technique is a sensitive biochemical proximity assay that will give information concerning the interaction of a ligand with the LBD, in the presence of cofactor-derived peptides (Zhou et al., Methods 25:54-61, 2001).To identify novel antagonists of RORgammaT, an assay was developed which employs the interaction of RORgammaT with its co-activator peptide SRC1_2. This peptide mimics the recruitment of co-activators to RORgammaT through its interaction with the LXXLL (e.g., NR box) motifs (Xie et al., J. Immunol. 175: 3800-09, 2005; Kurebayashi et al., Biochem. Biophys. Res. Commun. 315: 919-27, 2004; Jin et al., Mol. Endocrinology 24:923-29, 2010). The RORγ-Ligand Binding Domain TR-FRET Assay was run according to the following protocol.HIS-tagged RORγ-LBD protein was recombinantly expressed in Escherichia coli. The RORγ-LBD protein was purified by Ni2+-affinity resin. Purified protein was then diluted in assay buffer (50 mM Tris pH 7.0, 50 mM KCl, 1 mM EDTA, 0.1 mM DTT, 100 mg/ml bovine serum albumin, delipidated) to obtain a RORγ-LBD final concentration of 3 nM. Europium tagged anti-HIS antibody was also added to this solution (1.25 nM). Separately, SF9 cells not expressing any recombinant protein were lysed (32,000 cells per ml in 25 mM Tris, 50 mM NaCl) and the previously frozen lysate was added to the diluted RORγ-LBD solution at a ratio of 0.75 ml SF9 lysate per 15 ml of diluted RORγ-LBD.Compounds to be tested were injected to the 384-well assay plate using Acoustic Droplet Ejection technology by Echo 550 liquid handler (Labcyte, Calif.).A stock of biotinylated-LXXLL peptide from coactivator SRC1 (Biotin-SPSSHSSLTERHKILHRLLQEGSP) (SEQ ID NO:1) and APC-conjugated streptavidin (final concentrations 100 nM and 8 nM respectively) were also added to each well.The final assay mixture was incubated overnight at 4° C., warmed to room temperature and the fluorescence signal was measured on an Envision plate reader: (Excitation filter=340 nm; APC emission=665 nm; Europium emission=615 nm; dichroic mirror=D400/D630; delay time=100 μs, integration time=200 μs). IC50 values for test compounds were calculated from the quotient of the fluorescence signal at 665 nm divided by the fluorescence signal at 615 nm.
- Biological Assay for RORgammaT Activity The compounds of the invention inhibit RORgammaT activity. Activation of RORgammaT activity can be measured using, e.g., biochemical TR-FRET assay. In such an assay, interaction of cofactor-derived peptides with human RORgammaT-Ligand Binding Domain (LBD) can be measured. The TR-FRET technique is a sensitive biochemical proximity assay that will give information concerning the interaction of a ligand with the LBD, in the presence of cofactor-derived peptides (Zhou et al., Methods 25:54-61, 2001).To identify novel antagonists of RORgammaT, an assay was developed which employs the interaction of RORgammaT with its co-activator peptide SRC1_2. This peptide mimics the recruitment of co-activators to RORgammaT through its interaction with the LXXLL (e.g., NR box) motifs (Xie et al., J. Immunol. 175: 3800-09, 2005; Kurebayashi et al., Biochem. Biophys. Res. Commun. 315: 919-27, 2004; Jin et al., Mol. Endocrinology 24:923-29, 2010). The RORγ-Ligand Binding Domain TR-FRET Assay was run according to the following protocol.HIS-tagged RORγ-LBD protein was recombinantly expressed in Escherichia coli. The RORγ-LBD protein was purified by Ni2+-affinity resin. Purified protein was then diluted in assay buffer (50 mM Tris pH 7.0, 50 mM KCl, 1 mM EDTA, 0.1 mM DTT, 100 mg/ml bovine serum albumin, delipidated) to obtain a RORγ-LBD final concentration of 3 nM. Europium tagged anti-HIS antibody was also added to this solution (1.25 nM). Separately, SF9 cells not expressing any recombinant protein were lysed (32,000 cells per ml in 25 mM Tris, 50 mM NaCl) and the previously frozen lysate was added to the diluted RORγ-LBD solution at a ratio of 0.75 ml SF9 lysate per 15 ml of diluted RORγ-LBD.Compounds to be tested were injected to the 384-well assay plate using Acoustic Droplet Ejection technology by Echo 550 liquid handler (Labcyte, Calif.).A stock of biotinylated-LXXLL peptide from coactivator SRC1 (Biotin-SPSSHSSLTERHKILHRLLQEGSP) (SEQ ID NO: 1) and APC-conjugated streptavidin (final concentrations 100 nM and 8 nM respectively) were also added to each well.The final assay mixture was incubated overnight at 4° C., warmed to room temperature and the fluorescence signal was measured on an Envision plate reader: (Excitation filter=340 nm; APC emission=665 nm; Europium emission=615 nm; dichroic mirror=D400/D630; delay time=100 μs, integration time=200 μs). IC50 values for test compounds were calculated from the quotient of the fluorescence signal at 665 nm divided by the fluorescence signal at 615 nm.
- Biological Assays The compounds of the invention inhibit RORgammaT activity. Activation of RORgammaT activity can be measured using, e.g., biochemical TR-FRET assay. In such an assay, interaction of cofactor-derived peptides with human RORgammaT-Ligand Binding Domain (LBD) can be measured. The TR-FRET technique is a sensitive biochemical proximity assay that will give information concerning the interaction of a ligand with the LBD, in the presence of cofactor-derived peptides (Zhou et al., Methods 25:54-61, 2001).To identify novel antagonists of RORgammaT, an assay was developed which employs the interaction of RORgammaT with its co-activator peptide SRC1_2. This peptide mimics the recruitment of co-activators to RORgammaT through its interaction with the LXXLL (SEQ ID NO:1) (e.g., NR box) motifs (Xie et al., J. Immunol. 175: 3800-09, 2005; Kurebayashi et al., Biochem. Biophys. Res. Commun. 315: 919-27, 2004; Jin et al., Mol. Endocrinology 24:923-29, 2010). The RORγ-Ligand Binding Domain TR-FRET Assay was run according to the following protocol.HIS-tagged RORγ-LBD protein was expressed in SF9 cells using a baculovirus expression system. The RORγ-LBD protein was purified by glutathione sepharose chromatography. Separately, SF9 cells not expressing any recombinant protein were lysed and the lysate was added to the purified RORγ-LBD at 0.25 μl lysate (from 10,000 SF9 cells)/nM purified protein. The mixture was then diluted in assay buffer (50 mM Tris pH 7.0, 50 mM KCl, 1 mM EDTA, 0.1 mM DTT) to obtain RORγ-LBD final concentration of 3 nM in 384-well assay plate.Compounds to be tested were injected to the assay plate using Acoustic Droplet Ejection technology by Echo 550 liquid handler (Labcyte, Calif.).A stock of biotinylated-LXXLL peptide from coactivator SRC1 (Biotin-CPSSHSSLTERHKILHRLLQEGSPS) (SEQ ID NO:2) was prepared in assay buffer and added to each well (100 nM final concentration). A solution of Europium tagged anti-HIS antibody (1.25 nM final concentration) and APC conjugated streptavidin (8 nM final concentration) were also added to each well.The final assay mixture was incubated overnight at 4° C., and the fluorescence signal was measured on an Envision plate reader: (Excitation filter=340 nm; APC emission=665 nm; Europium emission=615 nm; dichroic mirror=D400/D630; delay time=100 μs, integration time=200 μs). IC50 values for test compounds were calculated from the quotient of the fluorescence signal at 665 nm divided by the fluorescence signal at 615 nm.
- NATIVE RECEPTOR BINDING ASSA The binding of 125I-CGRP to receptors in SK-N-MC cell membranes was carried out essentially as described (Edvinsson et al. (2001) Eur. J. Pharmacol. 415, 39-44). Briefly, membranes (25 μg) were incubated in 1 mL of binding buffer [10 mM HEPES, pH 7.4, 5 mM MgCl2 and 0.2% bovine serum albumin (BSA)] containing 10 pM 125I-CGRP and antagonist. After incubation at room temperature for 3 h, the assay was terminated by filtration through GFB glass fibre filter plates (PerkinElmer) that had been blocked with 0.5% polyethyleneimine for 3 h. The filters were washed three times with ice-cold assay buffer (10 mM HEPES, pH 7.4 and 5 mM MgCl2), then the plates were air dried. Scintillation fluid (50 μL) was added and the radioactivity was counted on a Topcount (Packard Instrument). Data analysis was carried out by using Prism and the Ki was determined by using the Cheng-Prusoff equation (Cheng & Prusoff (1973) Biochem. Pharmacol. 22, 3099-3108).Cells expressing recombinant human CL receptor/RAMP1 were washed with PBS and harvested in harvest buffer containing 50 mM HEPES, 1 mM EDTA and Complete protease inhibitors (Roche). The cell suspension was disrupted with a laboratory homogenizer and centrifuged at 48,000 g to isolate membranes. The pellets were resuspended in harvest buffer plus 250 mM sucrose and stored at −70° C. For binding assays, 20 μg of membranes were incubated in 1 mL binding buffer (10 mM HEPES, pH 7.4, 5 mM MgCl2, and 0.2% BSA) for 3 h at room temperature containing 10 pM 125I-hCGRP (GE Healthcare) and antagonist. The assay was terminated by filtration through 96-well GFB glass fiber filter plates (PerkinElmer) that had been blocked with 0.05% polyethyleneimine. The filters were washed 3 times with ice-cold assay buffer (10 mM HEPES, pH 7.4, and 5 mM MgCl2). Scintillation fluid was added and the plates were counted on a Topcount (Packard). Non-specific binding was determined and the data analysis was carried out with the apparent dissociation constant (Ki) determined by using a non-linear least squares fitting the bound CPM data to the equation below:Y obsd = ( Y max - Y min ) ( % I max - % Imin / 100 ) + Y min + ( Y max - Y min ) ( 100 - % I max / 100 ) 1 + ( [ Drug ] / K i ( 1 + [ Radiolabel ] / K d ) nH Where Y is observed CPM bound, Ymax is total bound counts, Ymin is non specific bound counts, (Ymax−Ymin) is specific bound counts, % Imax is the maximum percent inhibition, % I min is the minimum percent inhibition, radiolabel is the probe, and the Kd is the apparent dissociation constant for the radioligand for the receptor as determined by hot saturation experiments.
- FLIPR Ca2+ Flux Assay The utility of the compounds in accordance with the present invention as orexin receptor OX1R and/or OX2R antagonists may be readily determined without undue experimentation by methodology well known in the art, including the FLIPR Ca2+ Flux Assay (Okumura et al., Biochem. Biophys. Res. Comm. 280:976-981, 2001). In a typical experiment the OX1 and OX2 receptor antagonistic activity of the compounds of the present invention was determined in accordance with the following experimental method. For intracellular calcium measurements, Chinese hamster ovary (CHO) cells expressing the rat orexin-1 receptor or the human orexin-2 receptor, are grown in Iscove's modified DMEM containing 2 mM L-glutamine, 0.5 g/ml G418, 1% hypoxanthine-thymidine supplement, 100 U/ml penicillin, 100 μg/ml streptomycin and 10% heat-inactivated fetal calf serum (FCS). The cells are seeded at 20,000 cells/well into Becton-Dickinson black 384-well clear bottom sterile plates coated with poly-D-lysine. All reagents were from GIBCO-Invitrogen Corp. The seeded plates are incubated overnight at 37° C. and 5% CO2. Ala-6,12 human orexin-A as the agonist is prepared as a 1 mM stock solution in 1% bovine serum albumin (BSA) and diluted in assay buffer (HBSS containing 20 mM HEPES, 0.1% BSA and 2.5 mM probenecid, pH7.4) for use in the assay at a final concentration of 70 pM. Test compounds are prepared as 10 mM stock solution in DMSO, then diluted in 384-well plates, first in DMSO, then assay buffer. On the day of the assay, cells are washed 3 times with 100 μl assay buffer and then incubated for 60 min (37° C., 5% CO2) in 60 μl assay buffer containing 1 μM Fluo-4AM ester, 0.02% pluronic acid, and 1% BSA. The dye loading solution is then aspirated and cells are washed 3 times with 100 μl assay buffer. 30 μl of that same buffer is left in each well. Within the Fluorescent Imaging Plate Reader (FLIPR, Molecular Devices), test compounds are added to the plate in a volume of 25 μl, incubated for 5 min and finally 25 μl of agonist is added. Fluorescence is measured for each well at 1 second intervals for 5 minutes and the height of each fluorescence peak is compared to the height of the fluorescence peak induced by 70 pM Ala-6,12 orexin-A with buffer in place of antagonist. For each antagonist, IC50 value (the concentration of compound needed to inhibit 50% of the agonist response) is determined. Alternatively, compound potency can be assessed by a radioligand binding assay (described in Bergman et. al. Bioorg. Med. Chem. Lett. 2008, 18, 1425-1430) in which the inhibition constant (Ki) is determined in membranes prepared from CHO cells expressing either the OX1 or OX2 receptor. The intrinsic orexin receptor antagonist activity of a compound which may be used in the present invention may be determined by these assays.
- FLIPR assay The utility of the compounds in accordance with the present invention as orexin receptor OX1R and/or OX2R antagonists may be readily determined without undue experimentation by methodology well known in the art, including the FLIPR Ca2+ Flux Assay (Okumura et al., Biochem. Biophys. Res. Comm. 280:976-981, 2001). In a typical experiment the OX1 and OX2 receptor antagonistic activity of the compounds of the present invention was determined in accordance with the following experimental method. For intracellular calcium measurements, Chinese hamster ovary (CHO) cells expressing the rat orexin-1 receptor or the human orexin-2 receptor, are grown in Iscove's modified DMEM containing 2 mM L-glutamine, 0.5 g/ml G418, 1% hypoxanthine-thymidine supplement, 100 U/ml penicillin, 100 μg/ml streptomycin and 10% heat-inactivated fetal calf serum (FCS). The cells are seeded at 20,000 cells/well into Becton-Dickinson black 384-well clear bottom sterile plates coated with poly-D-lysine. All reagents were from GIBCO-Invitrogen Corp. The seeded plates are incubated overnight at 37° C. and 5% CO2. Ala-6,12 human orexin-A as the agonist is prepared as a 1 mM stock solution in 1% bovine serum albumin (BSA) and diluted in assay buffer (HBSS containing 20 mM HEPES, 0.1% BSA and 2.5 mM probenecid, pH7.4) for use in the assay at a final concentration of 70 pM. Test compounds are prepared as 10 mM stock solution in DMSO, then diluted in 384-well plates, first in DMSO, then assay buffer. On the day of the assay, cells are washed 3 times with 100 μl assay buffer and then incubated for 60 min (37° C., 5% CO2) in 60 μl assay buffer containing 1 μM Fluo-4AM ester, 0.02% pluronic acid, and 1% BSA. The dye loading solution is then aspirated and cells are washed 3 times with 100 μl assay buffer. 30 μl of that same buffer is left in each well. Within the Fluorescent Imaging Plate Reader (FLIPR, Molecular Devices), test compounds are added to the plate in a volume of 25 μl, incubated for 5 min and finally 25 μl of agonist is added. Fluorescence is measured for each well at 1 second intervals for 5 minutes and the height of each fluorescence peak is compared to the height of the fluorescence peak induced by 70 μM Ala-6,12 orexin-A with buffer in place of antagonist. For each antagonist, IC50 value (the concentration of compound needed to inhibit 50% of the agonist response) is determined. Alternatively, compound potency can be assessed by a radioligand binding assay (described in Bergman et. al. Bioorg. Med. Chem. Lett. 2008, 18, 1425-1430) in which the inhibition constant (Ki) is determined in membranes prepared from CHO cells expressing either the OX1 or OX2 receptor. The intrinsic orexin receptor antagonist activity of a compound which may be used in the present invention may be determined by these assays.