Report error Found 85 Enz. Inhib. hit(s) with all data for entry = 13176
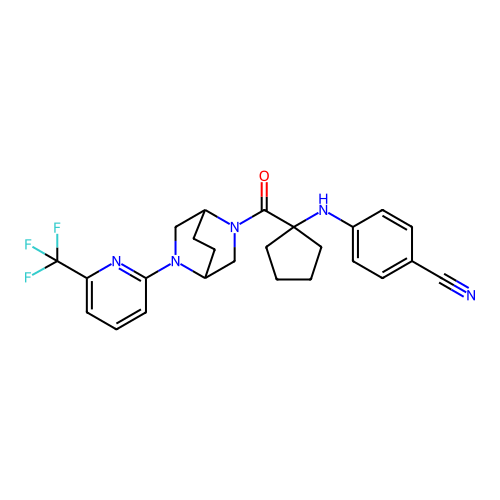
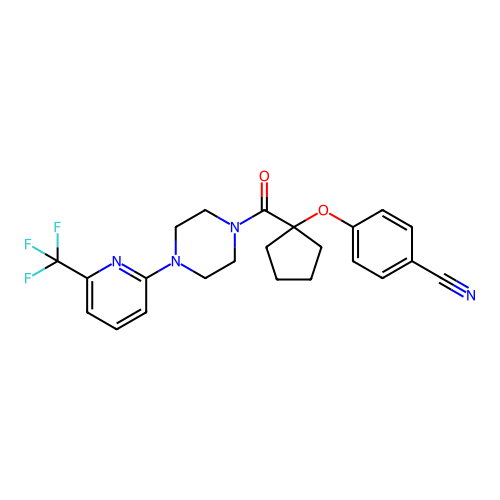
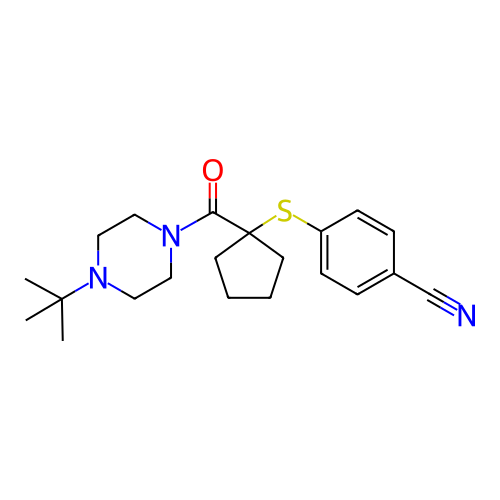
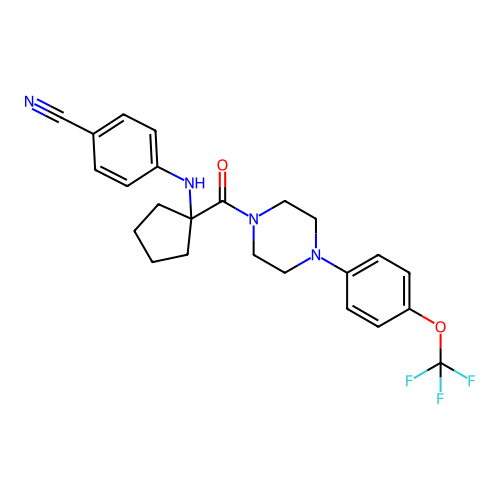
TargetTransient receptor potential cation channel subfamily A member 1(Human)
Hangzhou Westan Pharmaceutical Technology
US Patent
Hangzhou Westan Pharmaceutical Technology
US Patent
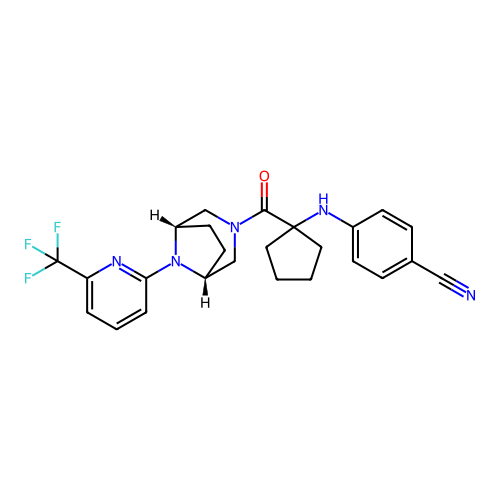
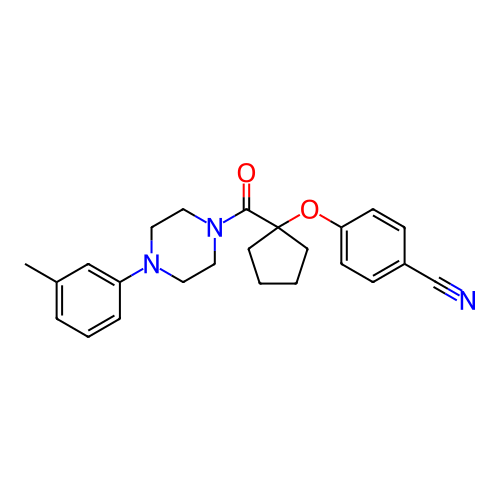
Affinity DataIC50: 15nMAssay Description:Table 3.1: The cell analysis plate was placed in an FLIPR instrument (Molecular Probes), and the compound in the compound plate was added to the corr...More data for this Ligand-Target Pair
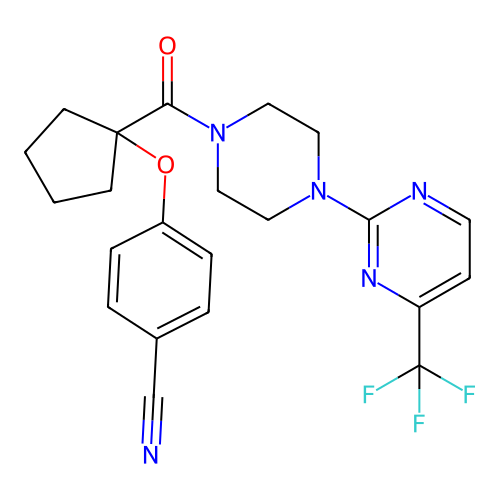
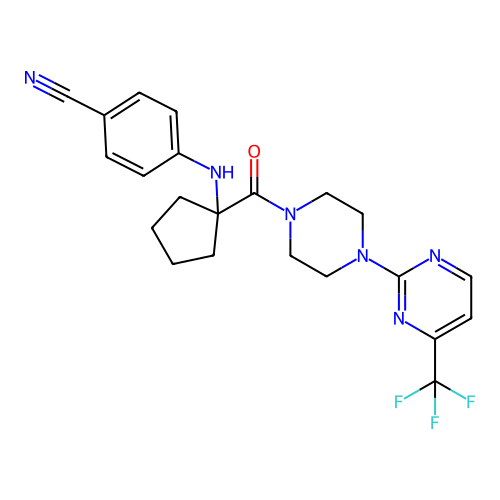
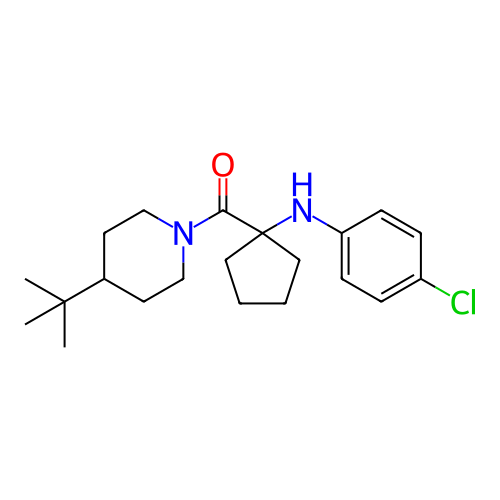
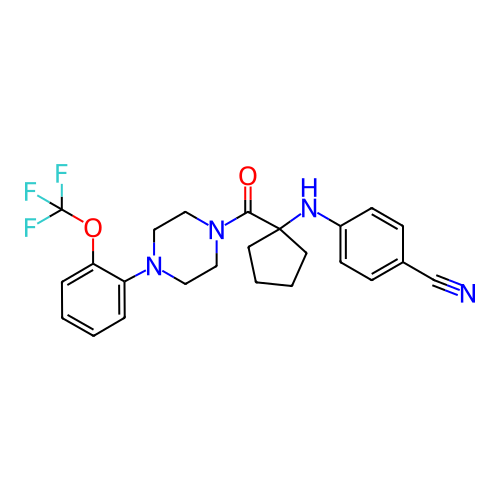
TargetTransient receptor potential cation channel subfamily A member 1(Human)
Hangzhou Westan Pharmaceutical Technology
US Patent
Hangzhou Westan Pharmaceutical Technology
US Patent
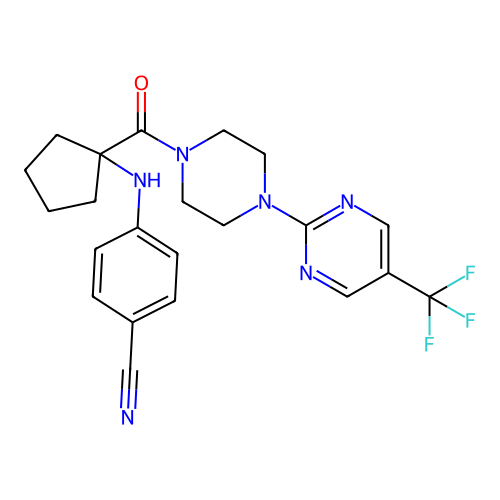
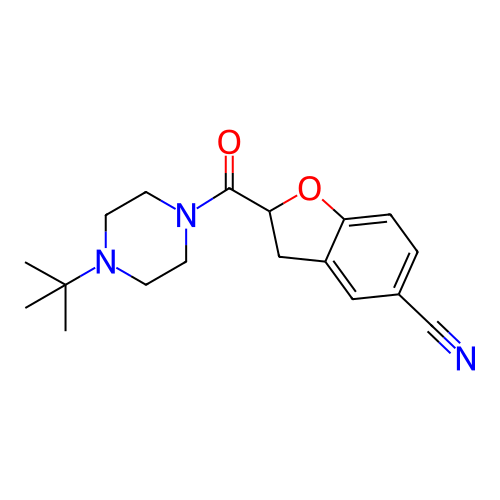
Affinity DataIC50: 18nMAssay Description:Table 3.1: The cell analysis plate was placed in an FLIPR instrument (Molecular Probes), and the compound in the compound plate was added to the corr...More data for this Ligand-Target Pair
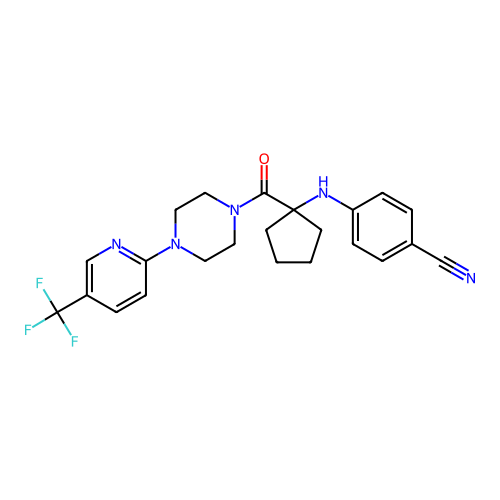
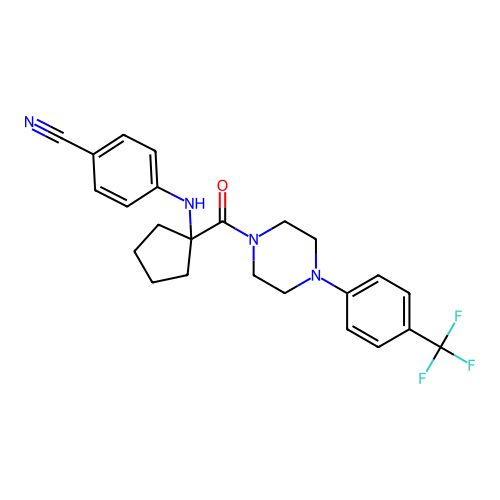
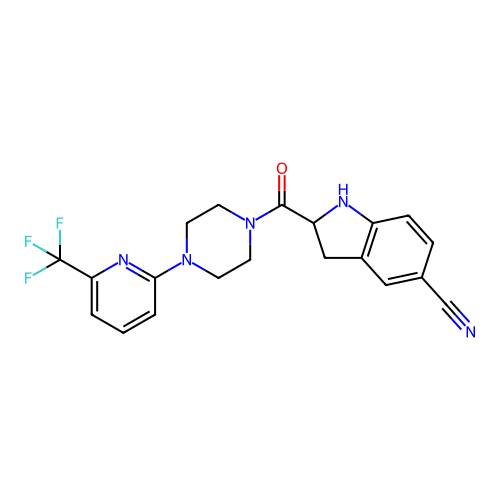
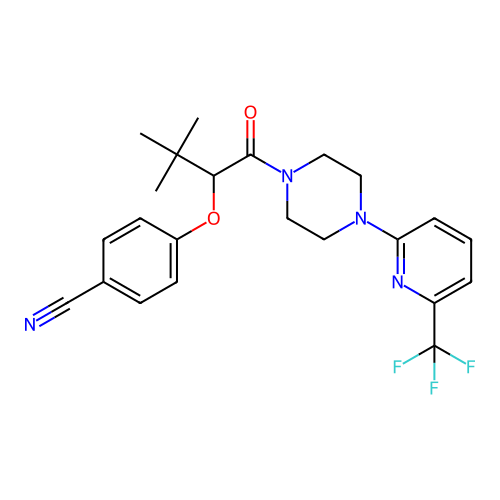
TargetTransient receptor potential cation channel subfamily A member 1(Human)
Hangzhou Westan Pharmaceutical Technology
US Patent
Hangzhou Westan Pharmaceutical Technology
US Patent
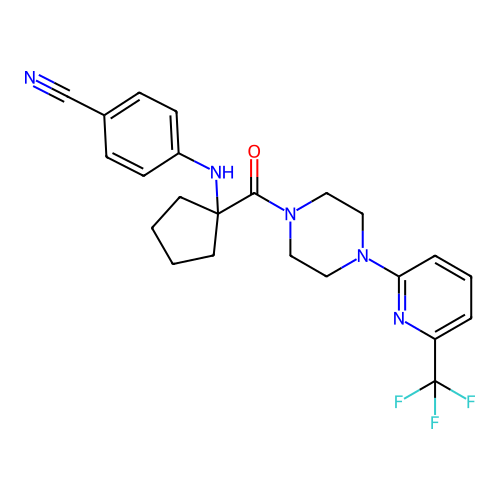
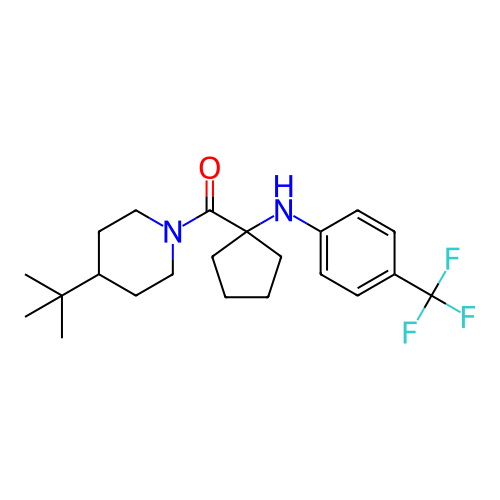
Affinity DataIC50: 19nMAssay Description:Table 3.1: The cell analysis plate was placed in an FLIPR instrument (Molecular Probes), and the compound in the compound plate was added to the corr...More data for this Ligand-Target Pair
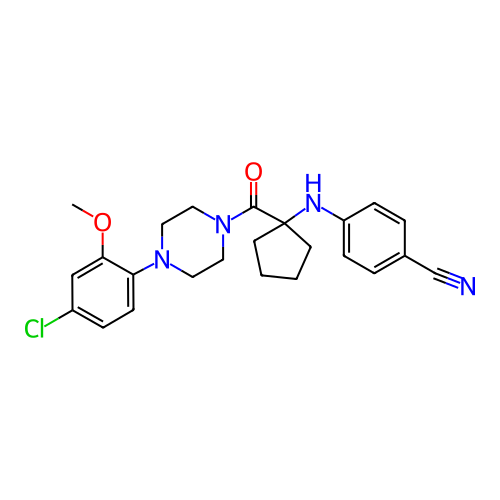
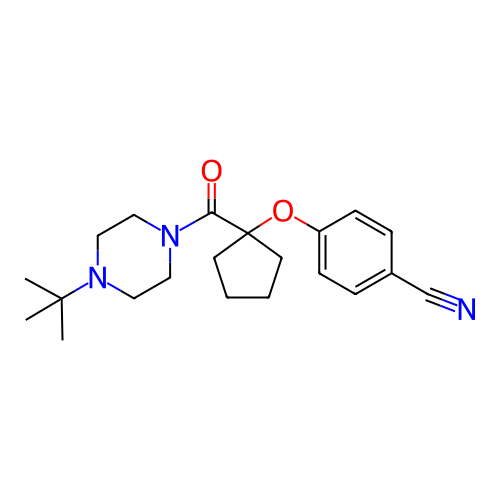
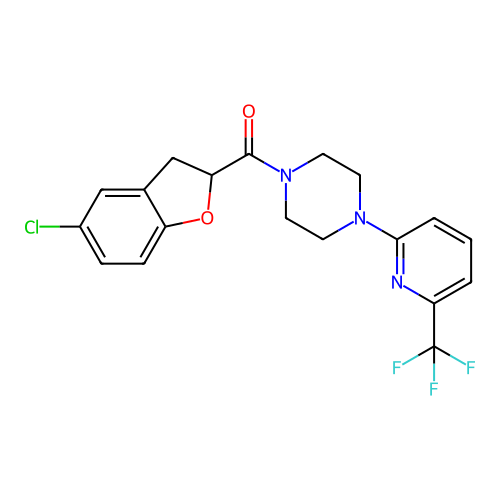
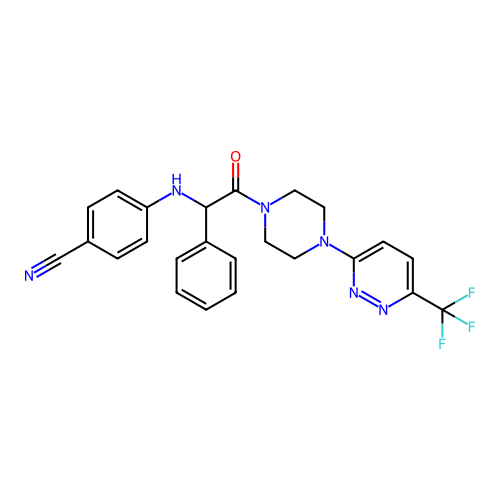
TargetTransient receptor potential cation channel subfamily A member 1(Human)
Hangzhou Westan Pharmaceutical Technology
US Patent
Hangzhou Westan Pharmaceutical Technology
US Patent
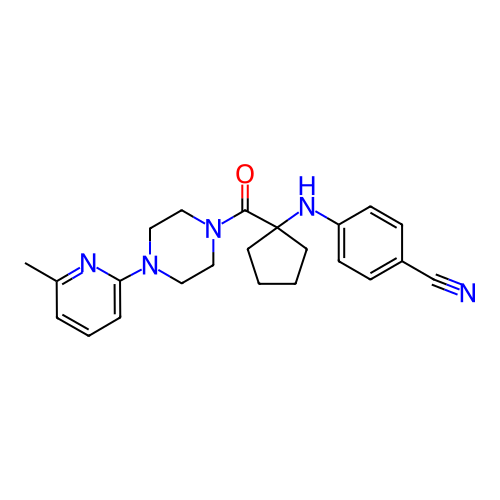
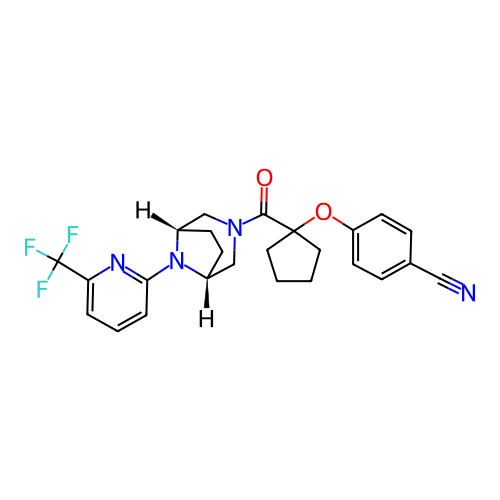
Affinity DataIC50: 23nMAssay Description:Table 3.1: The cell analysis plate was placed in an FLIPR instrument (Molecular Probes), and the compound in the compound plate was added to the corr...More data for this Ligand-Target Pair
TargetTransient receptor potential cation channel subfamily A member 1(Human)
Hangzhou Westan Pharmaceutical Technology
US Patent
Hangzhou Westan Pharmaceutical Technology
US Patent
Affinity DataIC50: 26nMAssay Description:Table 3.1: The cell analysis plate was placed in an FLIPR instrument (Molecular Probes), and the compound in the compound plate was added to the corr...More data for this Ligand-Target Pair
TargetTransient receptor potential cation channel subfamily A member 1(Human)
Hangzhou Westan Pharmaceutical Technology
US Patent
Hangzhou Westan Pharmaceutical Technology
US Patent
Affinity DataIC50: 28nMAssay Description:Table 3.1: The cell analysis plate was placed in an FLIPR instrument (Molecular Probes), and the compound in the compound plate was added to the corr...More data for this Ligand-Target Pair
TargetTransient receptor potential cation channel subfamily A member 1(Human)
Hangzhou Westan Pharmaceutical Technology
US Patent
Hangzhou Westan Pharmaceutical Technology
US Patent
Affinity DataIC50: 32nMAssay Description:Table 3.1: The cell analysis plate was placed in an FLIPR instrument (Molecular Probes), and the compound in the compound plate was added to the corr...More data for this Ligand-Target Pair
TargetTransient receptor potential cation channel subfamily A member 1(Human)
Hangzhou Westan Pharmaceutical Technology
US Patent
Hangzhou Westan Pharmaceutical Technology
US Patent
Affinity DataIC50: 35nMAssay Description:Table 3.2: The cells were transferred to the perfusion tank and perfused with extracellular fluid. The intracellular fluid was: 130 mM K-aspartate; 5...More data for this Ligand-Target Pair
TargetTransient receptor potential cation channel subfamily A member 1(Human)
Hangzhou Westan Pharmaceutical Technology
US Patent
Hangzhou Westan Pharmaceutical Technology
US Patent
Affinity DataIC50: 35nMAssay Description:Table 3.1: The cell analysis plate was placed in an FLIPR instrument (Molecular Probes), and the compound in the compound plate was added to the corr...More data for this Ligand-Target Pair
TargetTransient receptor potential cation channel subfamily A member 1(Human)
Hangzhou Westan Pharmaceutical Technology
US Patent
Hangzhou Westan Pharmaceutical Technology
US Patent
Affinity DataIC50: 38nMAssay Description:Table 3.1: The cell analysis plate was placed in an FLIPR instrument (Molecular Probes), and the compound in the compound plate was added to the corr...More data for this Ligand-Target Pair
TargetTransient receptor potential cation channel subfamily A member 1(Human)
Hangzhou Westan Pharmaceutical Technology
US Patent
Hangzhou Westan Pharmaceutical Technology
US Patent
Affinity DataIC50: 40nMAssay Description:Table 3.1: The cell analysis plate was placed in an FLIPR instrument (Molecular Probes), and the compound in the compound plate was added to the corr...More data for this Ligand-Target Pair
TargetTransient receptor potential cation channel subfamily A member 1(Human)
Hangzhou Westan Pharmaceutical Technology
US Patent
Hangzhou Westan Pharmaceutical Technology
US Patent
Affinity DataIC50: 51nMAssay Description:Table 3.1: The cell analysis plate was placed in an FLIPR instrument (Molecular Probes), and the compound in the compound plate was added to the corr...More data for this Ligand-Target Pair
TargetTransient receptor potential cation channel subfamily A member 1(Human)
Hangzhou Westan Pharmaceutical Technology
US Patent
Hangzhou Westan Pharmaceutical Technology
US Patent
Affinity DataIC50: 53nMAssay Description:Table 3.1: The cell analysis plate was placed in an FLIPR instrument (Molecular Probes), and the compound in the compound plate was added to the corr...More data for this Ligand-Target Pair
TargetTransient receptor potential cation channel subfamily A member 1(Human)
Hangzhou Westan Pharmaceutical Technology
US Patent
Hangzhou Westan Pharmaceutical Technology
US Patent
Affinity DataIC50: 54nMAssay Description:Table 3.1: The cell analysis plate was placed in an FLIPR instrument (Molecular Probes), and the compound in the compound plate was added to the corr...More data for this Ligand-Target Pair
TargetTransient receptor potential cation channel subfamily A member 1(Human)
Hangzhou Westan Pharmaceutical Technology
US Patent
Hangzhou Westan Pharmaceutical Technology
US Patent
Affinity DataIC50: 56nMAssay Description:Table 3.2: The cells were transferred to the perfusion tank and perfused with extracellular fluid. The intracellular fluid was: 130 mM K-aspartate; 5...More data for this Ligand-Target Pair
TargetTransient receptor potential cation channel subfamily A member 1(Human)
Hangzhou Westan Pharmaceutical Technology
US Patent
Hangzhou Westan Pharmaceutical Technology
US Patent
Affinity DataIC50: 56nMAssay Description:Table 3.1: The cell analysis plate was placed in an FLIPR instrument (Molecular Probes), and the compound in the compound plate was added to the corr...More data for this Ligand-Target Pair
TargetTransient receptor potential cation channel subfamily A member 1(Human)
Hangzhou Westan Pharmaceutical Technology
US Patent
Hangzhou Westan Pharmaceutical Technology
US Patent
Affinity DataIC50: 64nMAssay Description:Table 3.1: The cell analysis plate was placed in an FLIPR instrument (Molecular Probes), and the compound in the compound plate was added to the corr...More data for this Ligand-Target Pair
TargetTransient receptor potential cation channel subfamily A member 1(Human)
Hangzhou Westan Pharmaceutical Technology
US Patent
Hangzhou Westan Pharmaceutical Technology
US Patent
Affinity DataIC50: 65nMAssay Description:Table 3.1: The cell analysis plate was placed in an FLIPR instrument (Molecular Probes), and the compound in the compound plate was added to the corr...More data for this Ligand-Target Pair
TargetTransient receptor potential cation channel subfamily A member 1(Human)
Hangzhou Westan Pharmaceutical Technology
US Patent
Hangzhou Westan Pharmaceutical Technology
US Patent
Affinity DataIC50: 65nMAssay Description:Table 3.2: The cells were transferred to the perfusion tank and perfused with extracellular fluid. The intracellular fluid was: 130 mM K-aspartate; 5...More data for this Ligand-Target Pair
TargetTransient receptor potential cation channel subfamily A member 1(Human)
Hangzhou Westan Pharmaceutical Technology
US Patent
Hangzhou Westan Pharmaceutical Technology
US Patent
Affinity DataIC50: 68nMAssay Description:Table 3.1: The cell analysis plate was placed in an FLIPR instrument (Molecular Probes), and the compound in the compound plate was added to the corr...More data for this Ligand-Target Pair
TargetTransient receptor potential cation channel subfamily A member 1(Human)
Hangzhou Westan Pharmaceutical Technology
US Patent
Hangzhou Westan Pharmaceutical Technology
US Patent
Affinity DataIC50: 72nMAssay Description:Table 3.1: The cell analysis plate was placed in an FLIPR instrument (Molecular Probes), and the compound in the compound plate was added to the corr...More data for this Ligand-Target Pair
TargetTransient receptor potential cation channel subfamily A member 1(Human)
Hangzhou Westan Pharmaceutical Technology
US Patent
Hangzhou Westan Pharmaceutical Technology
US Patent
Affinity DataIC50: 76nMAssay Description:Table 3.1: The cell analysis plate was placed in an FLIPR instrument (Molecular Probes), and the compound in the compound plate was added to the corr...More data for this Ligand-Target Pair
TargetTransient receptor potential cation channel subfamily A member 1(Human)
Hangzhou Westan Pharmaceutical Technology
US Patent
Hangzhou Westan Pharmaceutical Technology
US Patent
Affinity DataIC50: 82nMAssay Description:Table 3.1: The cell analysis plate was placed in an FLIPR instrument (Molecular Probes), and the compound in the compound plate was added to the corr...More data for this Ligand-Target Pair
TargetTransient receptor potential cation channel subfamily A member 1(Human)
Hangzhou Westan Pharmaceutical Technology
US Patent
Hangzhou Westan Pharmaceutical Technology
US Patent
Affinity DataIC50: 83nMAssay Description:Table 3.2: The cells were transferred to the perfusion tank and perfused with extracellular fluid. The intracellular fluid was: 130 mM K-aspartate; 5...More data for this Ligand-Target Pair
TargetTransient receptor potential cation channel subfamily A member 1(Human)
Hangzhou Westan Pharmaceutical Technology
US Patent
Hangzhou Westan Pharmaceutical Technology
US Patent
Affinity DataIC50: 85nMAssay Description:Table 3.1: The cell analysis plate was placed in an FLIPR instrument (Molecular Probes), and the compound in the compound plate was added to the corr...More data for this Ligand-Target Pair
TargetTransient receptor potential cation channel subfamily A member 1(Human)
Hangzhou Westan Pharmaceutical Technology
US Patent
Hangzhou Westan Pharmaceutical Technology
US Patent
Affinity DataIC50: 87nMAssay Description:Table 3.1: The cell analysis plate was placed in an FLIPR instrument (Molecular Probes), and the compound in the compound plate was added to the corr...More data for this Ligand-Target Pair
TargetTransient receptor potential cation channel subfamily A member 1(Human)
Hangzhou Westan Pharmaceutical Technology
US Patent
Hangzhou Westan Pharmaceutical Technology
US Patent
Affinity DataIC50: 91nMAssay Description:Table 3.1: The cell analysis plate was placed in an FLIPR instrument (Molecular Probes), and the compound in the compound plate was added to the corr...More data for this Ligand-Target Pair
TargetTransient receptor potential cation channel subfamily A member 1(Human)
Hangzhou Westan Pharmaceutical Technology
US Patent
Hangzhou Westan Pharmaceutical Technology
US Patent
Affinity DataIC50: 92nMAssay Description:Table 3.1: The cell analysis plate was placed in an FLIPR instrument (Molecular Probes), and the compound in the compound plate was added to the corr...More data for this Ligand-Target Pair
TargetTransient receptor potential cation channel subfamily A member 1(Human)
Hangzhou Westan Pharmaceutical Technology
US Patent
Hangzhou Westan Pharmaceutical Technology
US Patent
Affinity DataIC50: 98nMAssay Description:Table 3.2: The cells were transferred to the perfusion tank and perfused with extracellular fluid. The intracellular fluid was: 130 mM K-aspartate; 5...More data for this Ligand-Target Pair
TargetTransient receptor potential cation channel subfamily A member 1(Human)
Hangzhou Westan Pharmaceutical Technology
US Patent
Hangzhou Westan Pharmaceutical Technology
US Patent
Affinity DataIC50: 105nMAssay Description:Table 3.1: The cell analysis plate was placed in an FLIPR instrument (Molecular Probes), and the compound in the compound plate was added to the corr...More data for this Ligand-Target Pair
TargetTransient receptor potential cation channel subfamily A member 1(Human)
Hangzhou Westan Pharmaceutical Technology
US Patent
Hangzhou Westan Pharmaceutical Technology
US Patent
Affinity DataIC50: 108nMAssay Description:Table 3.1: The cell analysis plate was placed in an FLIPR instrument (Molecular Probes), and the compound in the compound plate was added to the corr...More data for this Ligand-Target Pair
TargetTransient receptor potential cation channel subfamily A member 1(Human)
Hangzhou Westan Pharmaceutical Technology
US Patent
Hangzhou Westan Pharmaceutical Technology
US Patent
Affinity DataIC50: 112nMAssay Description:Table 3.1: The cell analysis plate was placed in an FLIPR instrument (Molecular Probes), and the compound in the compound plate was added to the corr...More data for this Ligand-Target Pair
TargetTransient receptor potential cation channel subfamily A member 1(Human)
Hangzhou Westan Pharmaceutical Technology
US Patent
Hangzhou Westan Pharmaceutical Technology
US Patent
Affinity DataIC50: 116nMAssay Description:Table 3.1: The cell analysis plate was placed in an FLIPR instrument (Molecular Probes), and the compound in the compound plate was added to the corr...More data for this Ligand-Target Pair
TargetTransient receptor potential cation channel subfamily A member 1(Human)
Hangzhou Westan Pharmaceutical Technology
US Patent
Hangzhou Westan Pharmaceutical Technology
US Patent
Affinity DataIC50: 129nMAssay Description:Table 3.1: The cell analysis plate was placed in an FLIPR instrument (Molecular Probes), and the compound in the compound plate was added to the corr...More data for this Ligand-Target Pair
TargetTransient receptor potential cation channel subfamily A member 1(Human)
Hangzhou Westan Pharmaceutical Technology
US Patent
Hangzhou Westan Pharmaceutical Technology
US Patent
Affinity DataIC50: 152nMAssay Description:Table 3.1: The cell analysis plate was placed in an FLIPR instrument (Molecular Probes), and the compound in the compound plate was added to the corr...More data for this Ligand-Target Pair
TargetTransient receptor potential cation channel subfamily A member 1(Human)
Hangzhou Westan Pharmaceutical Technology
US Patent
Hangzhou Westan Pharmaceutical Technology
US Patent
Affinity DataIC50: 182nMAssay Description:Table 3.1: The cell analysis plate was placed in an FLIPR instrument (Molecular Probes), and the compound in the compound plate was added to the corr...More data for this Ligand-Target Pair
TargetTransient receptor potential cation channel subfamily A member 1(Human)
Hangzhou Westan Pharmaceutical Technology
US Patent
Hangzhou Westan Pharmaceutical Technology
US Patent
Affinity DataIC50: 231nMAssay Description:Table 3.1: The cell analysis plate was placed in an FLIPR instrument (Molecular Probes), and the compound in the compound plate was added to the corr...More data for this Ligand-Target Pair
TargetTransient receptor potential cation channel subfamily A member 1(Human)
Hangzhou Westan Pharmaceutical Technology
US Patent
Hangzhou Westan Pharmaceutical Technology
US Patent
Affinity DataIC50: 261nMAssay Description:Table 3.1: The cell analysis plate was placed in an FLIPR instrument (Molecular Probes), and the compound in the compound plate was added to the corr...More data for this Ligand-Target Pair
TargetTransient receptor potential cation channel subfamily A member 1(Human)
Hangzhou Westan Pharmaceutical Technology
US Patent
Hangzhou Westan Pharmaceutical Technology
US Patent
Affinity DataIC50: 280nMAssay Description:Table 3.1: The cell analysis plate was placed in an FLIPR instrument (Molecular Probes), and the compound in the compound plate was added to the corr...More data for this Ligand-Target Pair
TargetTransient receptor potential cation channel subfamily A member 1(Human)
Hangzhou Westan Pharmaceutical Technology
US Patent
Hangzhou Westan Pharmaceutical Technology
US Patent
Affinity DataIC50: 285nMAssay Description:Table 3.1: The cell analysis plate was placed in an FLIPR instrument (Molecular Probes), and the compound in the compound plate was added to the corr...More data for this Ligand-Target Pair
TargetTransient receptor potential cation channel subfamily A member 1(Human)
Hangzhou Westan Pharmaceutical Technology
US Patent
Hangzhou Westan Pharmaceutical Technology
US Patent
Affinity DataIC50: 287nMAssay Description:Table 3.1: The cell analysis plate was placed in an FLIPR instrument (Molecular Probes), and the compound in the compound plate was added to the corr...More data for this Ligand-Target Pair
TargetTransient receptor potential cation channel subfamily A member 1(Human)
Hangzhou Westan Pharmaceutical Technology
US Patent
Hangzhou Westan Pharmaceutical Technology
US Patent
Affinity DataIC50: 325nMAssay Description:Table 3.1: The cell analysis plate was placed in an FLIPR instrument (Molecular Probes), and the compound in the compound plate was added to the corr...More data for this Ligand-Target Pair