Target (15)
Compound (14)
Article Title (57)
Article Author (5)
Assay (262)
Kroeze, WK; Hufeisen, SJ; Popadak, BA; Renock, SM; Steinberg, S; Ernsberger, P; Jayathilake, K; Meltzer, HY; Roth, BL H1-histamine receptor affinity predicts short-term weight gain for typical and atypical antipsychotic drugs. Neuropsychopharmacology 28: 519 -26 (2003) Malamas, MS; Raghav, JG; Ma, X; Honrao, C; Wood, JT; Benchama, O; Zhou, H; Mallipeddi, S; Makriyannis, A Oximes short-acting CB1 receptor agonists. Bioorg Med Chem 26: 4963 -4970 (2018) Takayama, K; Asari, T; Saitoh, M; Nirasawa, K; Sasaki, E; Roppongi, Y; Nakamura, A; Saga, Y; Shimada, T; Ikeyama, H; Taguchi, A; Taniguchi, A; Negishi, Y; Hayashi, Y Chain-Shortened Myostatin Inhibitory Peptides Improve Grip Strength in Mice. ACS Med Chem Lett 10: 985 -990 (2019) Trippier, PC; Jansen Labby, K; Hawker, DD; Mataka, JJ; Silverman, RB Target- and mechanism-based therapeutics for neurodegenerative diseases: strength in numbers. J Med Chem 56: 3121 -47 (2013) Schneider, HJ Ligand binding to nucleic acids and proteins: Does selectivity increase with strength? Eur J Med Chem 43: 2307 -15 (2008) Markowitz, S; Yuan, Y; Zhang, Y; Ready, J; Hu, B Compositions and methods of modulating short-chain dehydrogenase US Patent US11718589 (2023) Li, Q; Xing, S; Chen, Y; Liao, Q; Li, Q; Liu, Y; He, S; Feng, F; Chen, Y; Zhang, J; Liu, W; Guo, Q; Sun, Y; Sun, H Reasonably activating Nrf2: A long-term, effective and controllable strategy for neurodegenerative diseases. Eur J Med Chem 185: (2020) Husbands, SM; Sadd, J; Broadbear, JH; Woods, JH; Martin, J; Traynor, JR; Aceto, MD; Bowman, ER; Harris, LS; Lewis, JW 3-Alkyl ethers of clocinnamox: delayed long-term mu-antagonists with variable mu efficacy. J Med Chem 41: 3493 -8 (1998) Markowitz, S; Antczak, M; Ready, J; Zhang, Y COMPOSITIONS AND METHODS OF MODULATING SHORT-CHAIN DEHYDROGENASE ACTIVITY US Patent US20240043440 (2024) Markowitz, S; Willson, JK; Posner, B; Ready, J; Antczak, M; Zhang, Y; Desai, A; Gerson, S; Greenlee, W Compositions and methods of modulating short-chain dehydrogenase activity US Patent US9789116 (2017) Wiśniewski, K; Qi, S; Kraus, J; Ly, B; Srinivasan, K; Tariga, H; Croston, G; La, E; Wiśniewska, H; Ortiz, C; Laporte, R; Rivière, PJ; Neyer, G; Hargrove, DM; Schteingart, CD Discovery of Potent, Selective, and Short-Acting Peptidic V J Med Chem 62: 4991 -5005 (2019) CHEN, S; YANG, Y; ZHANG, J; LI, P; HE, H; WANG, Z; LI, J RING-MODIFIED PROLINE SHORT PEPTIDE COMPOUND AND USE THEREOF US Patent US20230312571 (2023) Wisniewski, K; Galyean, R; Tariga, H; Alagarsamy, S; Croston, G; Heitzmann, J; Kohan, A; Wisniewska, H; Laporte, R; Rivière, PJ; Schteingart, CD New, potent, selective, and short-acting peptidic V1a receptor agonists. J Med Chem 54: 4388 -98 (2011) Park, S; Hyun, S; Do, SI; Yu, J Selectivea-glucosidase substrates and inhibitors containing short aromatic peptidyl moieties. Bioorg Med Chem Lett 21: 2441 -4 (2011) Huang, TL; Mayence, A; Vanden Eynde, JJ Some non-conventional biomolecular targets for diamidines. A short survey. Bioorg Med Chem 22: 1983 -92 (2014) Schirlin, D; Baltzer, S; Dorsselaer, VV; Weber, F; Weill, C; Altenburger, JM; Neises, B; Flynn, G; Rémy, JM; Tarnus, C Short and unexpectedly potent difluorostatone type inhibitors of HIV-1 protease Bioorg Med Chem Lett 3: 253 -258 (1993) Wu, C; Cao, X; Zhang, X VISTA inhibitors in cancer immunotherapy: a short perspective on recent progresses. RSC Med Chem 12: 1672 -1679 (2021) Segala, E; Guo, D; Cheng, RK; Bortolato, A; Deflorian, F; Doré, AS; Errey, JC; Heitman, LH; IJzerman, AP; Marshall, FH; Cooke, RM Controlling the Dissociation of Ligands from the Adenosine A2A Receptor through Modulation of Salt Bridge Strength. J Med Chem 59: 6470 -9 (2016) Ullrich, S; Sasi, VM; Mahawaththa, MC; Ekanayake, KB; Morewood, R; George, J; Shuttleworth, L; Zhang, X; Whitefield, C; Otting, G; Jackson, C; Nitsche, C Challenges of short substrate analogues as SARS-CoV-2 main protease inhibitors. Bioorg Med Chem Lett 50: (2021) Pegoli, A; Wifling, D; Gruber, CG; She, X; Hübner, H; Bernhardt, G; Gmeiner, P; Keller, M Conjugation of Short Peptides to Dibenzodiazepinone-Type Muscarinic Acetylcholine Receptor Ligands Determines M J Med Chem 62: 5358 -5369 (2019) Nishizawa, N; Niida, A; Adachi, Y; Kanematsu-Yamaki, Y; Masuda, Y; Kumano, S; Yokoyama, K; Noguchi, Y; Asakawa, T; Hirabayashi, H; Amano, N; Takekawa, S; Ohtaki, T; Asami, T Highly potent antiobesity effect of a short-length peptide YY analog in mice. Bioorg Med Chem 25: 5718 -5725 (2017) Shinagawa, Y; Inoue, T; Hirata, K; Katsushima, T; Nakagawa, T; Matsuo, Y; Shindo, M; Hashimoto, H New aminopropandiol derivatives as orally available and short-acting calcium-sensing receptor antagonists. Bioorg Med Chem Lett 20: 3809 -13 (2010) Bruno, O; Romussi, A; Spallarossa, A; Brullo, C; Schenone, S; Bondavalli, F; Vanthuyne, N; Roussel, C New selective phosphodiesterase 4D inhibitors differently acting on long, short, and supershort isoforms. J Med Chem 52: 6546 -57 (2009) Stocks, PA; Raynes, KJ; Bray, PG; Park, BK; O'Neill, PM; Ward, SA Novel short chain chloroquine analogues retain activity against chloroquine resistant K1 Plasmodium falciparum. J Med Chem 45: 4975 -83 (2002) Yang, ZQ; Schlegel, KA; Shu, Y; Reger, TS; Cube, R; Mattern, C; Coleman, PJ; Small, J; Hartman, GD; Ballard, J; Tang, C; Kuo, Y; Prueksaritanont, T; Nuss, CE; Doran, S; Fox, SV; Garson, SL; Li, Y; Kraus, RL; Uebele, VN; Taylor, AB; Zeng, W; Fang, W; Chavez-Eng, C; Troyer, MD; Luk, JA; Laethem, T; Cook, WO; Renger, JJ; Barrow, JC Short-acting T-type calcium channel antagonists significantly modify sleep architecture in rodents. ACS Med Chem Lett 1: 504 -509 (2010) Tata, JR; Lu, Z; Jacks, TM; Schleim, KD; Cheng, K; Wei, L; Chan, WW; Butler, B; Tsou, N; Leung, K; Chiu, S; Hickey, G; Smith, RG; Patchett, AA The design and synthesis of orally active short duration spiroindane growth hormone secretagogues Bioorg Med Chem Lett 7: 2319 -2324 (1997) Martín-Santamaría, S; Muñoz-Muriedas, J; Luque, FJ; Gago, F Modulation of binding strength in several classes of active site inhibitors of acetylcholinesterase studied by comparative binding energy analysis. J Med Chem 47: 4471 -82 (2004) Gallant, M; Aspiotis, R; Day, S; Dias, R; Dubé, D; Dubé, L; Friesen, RW; Girard, M; Guay, D; Hamel, P; Huang, Z; Lacombe, P; Laliberté, S; Lévesque, JF; Liu, S; Macdonald, D; Mancini, J; Nicholson, DW; Styhler, A; Townson, K; Waters, K; Young, RN; Girard, Y Discovery of MK-0952, a selective PDE4 inhibitor for the treatment of long-term memory loss and mild cognitive impairment. Bioorg Med Chem Lett 20: 6387 -93 (2010) Nishizawa, N; Niida, A; Masuda, Y; Kumano, S; Yokoyama, K; Hirabayashi, H; Amano, N; Ohtaki, T; Asami, T Antiobesity Effect of a Short-Length Peptide YY Analogue after Continuous Administration in Mice. ACS Med Chem Lett 8: 628 -631 (2017) Nishizawa, N; Niida, A; Adachi, Y; Masuda, Y; Kumano, S; Yokoyama, K; Asakawa, T; Hirabayashi, H; Amano, N; Takekawa, S; Ohtaki, T; Asami, T Potent antiobesity effect of a short-length peptide YY-analogue continuously administered in mice. Bioorg Med Chem Lett 27: 3829 -3832 (2017) Demizu, Y; Nagoya, S; Shirakawa, M; Kawamura, M; Yamagata, N; Sato, Y; Doi, M; Kurihara, M Development of stapled short helical peptides capable of inhibiting vitamin D receptor (VDR)-coactivator interactions. Bioorg Med Chem Lett 23: 4292 -6 (2013) Dimitrov, IV; Harvey, MG; Voss, LJ; Sleigh, JW; Bickerdike, MJ; Denny, WA Ketamine esters and amides as short-acting anaesthetics: Structure-activity relationships for the side-chain. Bioorg Med Chem 27: 1226 -1231 (2019) Misawa, T; Demizu, Y; Kawamura, M; Yamagata, N; Kurihara, M Structural development of stapled short helical peptides as vitamin D receptor (VDR)-coactivator interaction inhibitors. Bioorg Med Chem 23: 1055 -61 (2015) Katz, BA; Elrod, K; Verner, E; Mackman, RL; Luong, C; Shrader, WD; Sendzik, M; Spencer, JR; Sprengeler, PA; Kolesnikov, A; Tai, VW; Hui, HC; Breitenbucher, JG; Allen, D; Janc, JW Elaborate manifold of short hydrogen bond arrays mediating binding of active site-directed serine protease inhibitors. J Mol Biol 329: 93 -120 (2003) Hoang, HN; Song, K; Hill, TA; Derksen, DR; Edmonds, DJ; Kok, WM; Limberakis, C; Liras, S; Loria, PM; Mascitti, V; Mathiowetz, AM; Mitchell, JM; Piotrowski, DW; Price, DA; Stanton, RV; Suen, JY; Withka, JM; Griffith, DA; Fairlie, DP Short Hydrophobic Peptides with Cyclic Constraints Are Potent Glucagon-like Peptide-1 Receptor (GLP-1R) Agonists. J Med Chem 58: 4080 -5 (2015) Trân, K; Murza, A; Sainsily, X; Delile, E; Couvineau, P; Côté, J; Coquerel, D; Peloquin, M; Auger-Messier, M; Bouvier, M; Lesur, O; Sarret, P; Marsault, É Structure-Activity Relationship and Bioactivity of Short Analogues of ELABELA as Agonists of the Apelin Receptor. J Med Chem 64: 602 -615 (2021) Lu, Q; Yang, YT; Chen, CS; Davis, M; Byrd, JC; Etherton, MR; Umar, A; Chen, CS Zn2+-chelating motif-tethered short-chain fatty acids as a novel class of histone deacetylase inhibitors. J Med Chem 47: 467 -74 (2004) Niida, A; Kanematsu-Yamaki, Y; Asakawa, T; Ishimura, Y; Fujita, H; Matsumiya, K; Nishizawa, N; Adachi, Y; Mochida, T; Tsuchimori, K; Yoneyama-Hirozane, M; Sakamoto, J; Hirabayashi, H; Fukui, H; Takekawa, S; Asami, T Antiobesity and emetic effects of a short-length peptide YY analog and its PEGylated and alkylated derivatives. Bioorg Med Chem 26: 566 -572 (2018) Shinagawa, Y; Inoue, T; Katsushima, T; Kiguchi, T; Ikenogami, T; Ogawa, N; Fukuda, K; Hirata, K; Harada, K; Takagi, M; Nakagawa, T; Kimura, S; Matsuo, Y; Maekawa, M; Hayashi, M; Soejima, Y; Takahashi, M; Shindo, M Discovery of a Potent and Short−Acting Oral Calcilytic with a Pulsatile Secretion of Parathyroid Hormone ACS Med Chem Lett 2: 238 -242 (2011) Carlier, PR; Han, YF; Chow, ES; Li, CP; Wang, H; Lieu, TX; Wong, HS; Pang, YP Evaluation of short-tether bis-THA AChE inhibitors. A further test of the dual binding site hypothesis. Bioorg Med Chem 7: 351 -7 (1999) Raboisson, P; Desjarlais, RL; Reed, R; Lattanze, J; Chaikin, M; Manthey, CL; Tomczuk, BE; Marugán, JJ Identification of novel short chain 4-substituted indoles as potent alphavbeta3 antagonist using structure-based drug design. Eur J Med Chem 42: 334 -43 (2007) Erhardt, PW; Woo, CM; Gorczynski, RJ; Anderson, WG Ultra-short-acting beta-adrenergic receptor blocking agents. 1. (Aryloxy)propanolamines containing esters in the nitrogen substituent. J Med Chem 25: 1402 -7 (1983) Erhardt, PW; Woo, CM; Anderson, WG; Gorczynski, RJ Ultra-short-acting beta-adrenergic receptor blocking agents. 2. (Aryloxy)propanolamines containing esters on the aryl function. J Med Chem 25: 1408 -12 (1983) Muley, L; Baum, B; Smolinski, M; Freindorf, M; Heine, A; Klebe, G; Hangauer, DG Enhancement of hydrophobic interactions and hydrogen bond strength by cooperativity: synthesis, modeling, and molecular dynamics simulations of a congeneric series of thrombin inhibitors. J Med Chem 53: 2126 -35 (2010) Katz, BA; Elrod, K; Luong, C; Rice, MJ; Mackman, RL; Sprengeler, PA; Spencer, J; Hataye, J; Janc, J; Link, J; Litvak, J; Rai, R; Rice, K; Sideris, S; Verner, E; Young, W A novel serine protease inhibition motif involving a multi-centered short hydrogen bonding network at the active site. J Mol Biol 307: 1451 -86 (2001) Hegedüs, R; Manea, M; Orbán, E; Szabó, I; Kiss, E; Sipos, E; Halmos, G; Mezo, G Enhanced cellular uptake and in vitro antitumor activity of short-chain fatty acid acylated daunorubicin-GnRH-III bioconjugates. Eur J Med Chem 56: 155 -165 (2012) Flaten, GE; Kottra, G; Stensen, W; Isaksen, G; Karstad, R; Svendsen, JS; Daniel, H; Svenson, J In vitro characterization of human peptide transporter hPEPT1 interactions and passive permeation studies of short cationic antimicrobial peptides. J Med Chem 54: 2422 -32 (2011) Tabuse, H; Abe-Sato, K; Kanazawa, H; Yashiro, M; Tamura, Y; Kamitani, M; Hitaka, K; Gunji, E; Mitani, A; Kojima, N; Oka, Y Discovery of Highly Potent and Selective Matrix Metalloproteinase-7 Inhibitors by Hybridizing the S1' Subsite Binder with Short Peptides. J Med Chem 65: 13253 -13263 (2022) Gobec, S; Sova, M; Kristan, K; Rizner, TL Cinnamic acid esters as potent inhibitors of fungal 17beta-hydroxysteroid dehydrogenase--a model enzyme of the short-chain dehydrogenase/reductase superfamily. Bioorg Med Chem Lett 14: 3933 -6 (2004) Fass, DM; Shah, R; Ghosh, B; Hennig, K; Norton, S; Zhao, WN; Reis, SA; Klein, PS; Mazitschek, R; Maglathlin, RL; Lewis, TA; Haggarty, SJ Effect of Inhibiting Histone Deacetylase with Short-Chain Carboxylic Acids and Their Hydroxamic Acid Analogs on Vertebrate Development and Neuronal Chromatin. ACS Med Chem Lett 2: 39 -42 (2011) Carballa, DM; Seoane, S; Zacconi, F; Pérez, X; Rumbo, A; Alvarez-Díaz, S; Larriba, MJ; Pérez-Fernández, R; Muñoz, A; Maestro, M; Mouriño, A; Torneiro, M Synthesis and biological evaluation of 1a,25-dihydroxyvitamin D3 analogues with a long side chain at C12 and short C17 side chains. J Med Chem 55: 8642 -56 (2012) Park, S; Yu, J An approach for differentiating isozymes. Construction of libraries containing short aromatic peptides as part of a method to design selective inhibitors against lipases. Bioorg Med Chem Lett 22: 3147 -51 (2012) Barlaam, B; Casella, R; Cidado, J; Cook, C; De Savi, C; Dishington, A; Donald, CS; Drew, L; Ferguson, AD; Ferguson, D; Glossop, S; Grebe, T; Gu, C; Hande, S; Hawkins, J; Hird, AW; Holmes, J; Horstick, J; Jiang, Y; Lamb, ML; McGuire, TM; Moore, JE; O'Connell, N; Pike, A; Pike, KG; Proia, T; Roberts, B; San Martin, M; Sarkar, U; Shao, W; Stead, D; Sumner, N; Thakur, K; Vasbinder, MM; Varnes, JG; Wang, J; Wang, L; Wu, D; Wu, L; Yang, B; Yao, T Discovery of AZD4573, a Potent and Selective Inhibitor of CDK9 That Enables Short Duration of Target Engagement for the Treatment of Hematological Malignancies. J Med Chem 63: 15564 -15590 (2020) Oger, F; Lecorgne, A; Sala, E; Nardese, V; Demay, F; Chevance, S; Desravines, DC; Aleksandrova, N; Le Guével, R; Lorenzi, S; Beccari, AR; Barath, P; Hart, DJ; Bondon, A; Carettoni, D; Simonneaux, G; Salbert, G Biological and biophysical properties of the histone deacetylase inhibitor suberoylanilide hydroxamic acid are affected by the presence of short alkyl groups on the phenyl ring. J Med Chem 53: 1937 -50 (2010) Verner, E; Katz, BA; Spencer, JR; Allen, D; Hataye, J; Hruzewicz, W; Hui, HC; Kolesnikov, A; Li, Y; Luong, C; Martelli, A; Radika, K; Rai, R; She, M; Shrader, W; Sprengeler, PA; Trapp, S; Wang, J; Young, WB; Mackman, RL Development of serine protease inhibitors displaying a multicentered short (<2.3 A) hydrogen bond binding mode: inhibitors of urokinase-type plasminogen activator and factor Xa. J Med Chem 44: 2753 -71 (2001) Procopiou, PA; Barrett, VJ; Biggadike, K; Butchers, PR; Craven, A; Ford, AJ; Guntrip, SB; Holmes, DS; Hughes, SC; Jones, AE; Looker, BE; Mutch, PJ; Ruston, M; Needham, D; Smith, CE Discovery of a rapidly metabolized, long-actingß(2) adrenergic receptor agonist with a short onset time incorporating a sulfone group suitable for once-daily dosing. J Med Chem 57: 159 -70 (2014) Murtuja, S; Shilkar, D; Sarkar, B; Sinha, BN; Jayaprakash, V A short survey of dengue protease inhibitor development in the past 6 years (2015-2020) with an emphasis on similarities between DENV and SARS-CoV-2 proteases. Bioorg Med Chem 49: (2021)
KHAN, TA; SHORT, G; PERNI, RB US Patent US20240425470 (2024) Castell, A; Short, FL; Evans, GL; Cookson, TV; Bulloch, EM; Joseph, DD; Lee, CE; Parker, EJ; Baker, EN; Lott, JS Biochemistry 52: 1776 -1787 (2013) Short, KM; Estiarte, MA; Pham, SM; Williams, DC; Igoudin, L; Dash, S; Sandoval, N; Datta, A; Pozzi, N; Di Cera, E; Kita, DB Eur J Med Chem 246: (2023) Grese, TA; Adrian, MD; Phillips, DL; Shetler, PK; Short, LL; Glasebrook, AL; Bryant, HU J Med Chem 44: 2857 -60 (2001) Madauss, KP; Deng, SJ; Austin, RJ; Lambert, MH; McLay, I; Pritchard, J; Short, SA; Stewart, EL; Uings, IJ; Williams, SP J Med Chem 47: 3381 -7 (2004)
ChEMBL_791622 (CHEMBL1930846) Binding affinity to D2 short receptor ChEMBL_1462783 (CHEMBL3399585) Inhibition of human aromatase in term placenta microsome assessed as radioactivity ChEMBL_2538187 Inhibition of human RPS6KA4 (Kin.Dom.1-N-term) by discoverX kinome scan assay ChEMBL_2538188 Inhibition of human RPS6KA4 (Kin.Dom.2-C-term) by discoverX kinome scan assay ChEMBL_2538189 Inhibition of human RPS6KA5 (Kin.Dom.1-N-term) by discoverX kinome scan assay ChEMBL_2538190 Inhibition of human RPS6KA5 (Kin.Dom.2-C-term) by discoverX kinome scan assay ChEMBL_2538191 Inhibition of human RSK1 (Kin.Dom.1-N-term) by discoverX kinome scan assay ChEMBL_2538192 Inhibition of human RSK1 (Kin.Dom.2-C-term) by discoverX kinome scan assay ChEMBL_2538193 Inhibition of human RSK2 (Kin.Dom.1-N-term) by discoverX kinome scan assay ChEMBL_2538194 Inhibition of human RSK2 (Kin.Dom.2-C-term) by discoverX kinome scan assay ChEMBL_2538195 Inhibition of human RSK3 (Kin.Dom.1-N-term) by discoverX kinome scan assay ChEMBL_2538196 Inhibition of human RSK3 (Kin.Dom.2-C-term) by discoverX kinome scan assay ChEMBL_2538197 Inhibition of human RSK4 (Kin.Dom.1-N-term) by discoverX kinome scan assay ChEMBL_2538198 Inhibition of human RSK4 (Kin.Dom.2-C-term) by discoverX kinome scan assay ChEMBL_1688623 (CHEMBL4039193) Inhibition of human dopamine D2 (short) receptor ChEBML_58638 Effective concentration required for agonistic activity against rat D2 short receptor ChEMBL_665771 (CHEMBL1259262) Displacement of [3H]Spiperone from human dopamine D2 short receptor ChEBML_61812 Binding affinity towards human Dopamine receptor D2 (short) by [3H]-spiperone displacement. ChEMBL_302916 (CHEMBL830376) Inhibition of [3H]spiperone binding to human dopamine receptor D2 short ChEMBL_58638 (CHEMBL665387) Effective concentration required for agonistic activity against rat D2 short receptor ChEMBL_61941 (CHEMBL675129) Effective concentration required for agonistic activity against rat D2 short receptor ChEMBL_2301506 Binding affinity to full length BRD4 short isoform (unknown origin) by BROMOscan assay ChEMBL_588135 (CHEMBL1044861) Binding affinity to human cloned dopamine D2-short expressed in CHO cells ChEMBL_61809 (CHEMBL672573) Binding affinity for human Dopamine receptor D2 (short) by [3H]- spiperone displacement. ChEMBL_61812 (CHEMBL672576) Binding affinity towards human Dopamine receptor D2 (short) by [3H]-spiperone displacement. ChEMBL_1434748 (CHEMBL3383417) Binding affinity to full-length BRD4 short isoform (unknown origin) by BROMOscan assay ChEMBL_1751658 (CHEMBL4186418) Binding affinity to full length BRD4 short isoform (unknown origin) by BROMOscan assay ChEMBL_363784 (CHEMBL860507) Displacement of [3H]spiperone from human D2 short receptor expressed in CHO cells ChEMBL_791613 (CHEMBL1930837) Displacement of [3H]spiperone from human D2 short receptor expressed in CHO cells ChEMBL_1703545 (CHEMBL4054778) Displacement of [3H]spiperone from human D2-short receptor expressed in CHO cell membranes ChEMBL_303088 (CHEMBL828760) Binding affinity towards human D2 short receptor using [3H]spiperone expressed in CHO cells ChEMBL_357163 (CHEMBL859990) Intrinsic activity against dopamine D2(short) receptor expressed in CHO cells by GTPgammaS assay ChEMBL_367037 (CHEMBL866800) Displacement of [3H]spiperone from human dopamine receptor D2(short) in CHO cell membrane ChEMBL_425698 (CHEMBL912014) Displacement of [3H]spiperone from human dopamine D2(short) expressed in CHO cell membrane ChEMBL_533451 (CHEMBL986943) Displacement of [3H]raclopride from rat dopamine D2(short) receptor expressed in CHOK1 cells ChEMBL_665576 (CHEMBL1261460) Displacement of [3H]Spiperone from human dopamine D2 short receptor expressed in CHO cells ChEMBL_744157 (CHEMBL1771856) Displacement of [3H]Spiperone from human dopamine D2 short receptor expressed in CHO cells ChEMBL_1504357 (CHEMBL3592694) Displacement of [3H]spiperone from human dopamine D2 short receptor expressed in CHO cell membranes ChEMBL_326849 (CHEMBL860444) Displacement of [3H]spiperone from human dopamine D2(short) receptor in rat pituitary GH4C1 cells ChEMBL_357152 (CHEMBL871243) Displacement of [3H]spiperone from human cloned dopamine D2(short) receptor expressed in CHO cells ChEMBL_446504 (CHEMBL895618) Displacement of [3H]spiperone from human dopamine D2 receptor short form expressed in CHO cells ChEMBL_578984 (CHEMBL1061433) Displacement of [3H]spiroperidol from human cloned dopamine D2 short receptor expressed in CHO cells ChEMBL_1339946 (CHEMBL3243816) Displacement of [3H]-N-methylspiperone from rat recombinant dopamine D2 short receptor expressed in CHO cells ChEMBL_154174 (CHEMBL762378) Antisecretory potency, affinity for intestinal PYY of rat jejunum by using short circuit current (SCC) method. ChEMBL_1832518 (CHEMBL4332526) Binding affinity to full length BRD4 short isoform (unknown origin) after 1 hr by bromoscan assay ChEMBL_364276 (CHEMBL863214) Displacement of [3H]SQ29,548 from TPalpha receptor (short isoform) expressed in COS7 cells at 1 uM ChEMBL_449682 (CHEMBL898786) Displacement of [3H]spiperone from human cloned dopamine receptor D2 short expressed in CHO cell membranes TaK1-TaB1 Inhibitor Assays The assay was performed at BSP Biosience Inc. (5Z)-7-oxozeaenol was used as a positive control. Analogue 3 was not tested due to the short-term stability as indicated by the sub 90% purity detected by UPLC following prep HPLC purification. The only synthesized analogue that was found to be relatively active was difluoro (5Z)-7-oxozeaenol 5. ChEBML_149039 Compound was evaluated for OT receptor affinity by displacement of [3H]OT from binding sites in uterine tissue taken from near-term pregnant rhesus monkey ChEMBL_154175 (CHEMBL762379) Tested for the affinity for intestinal PYY from rat jejunum by using short circuit current (SCC) method. ChEMBL_303731 (CHEMBL829637) Inhibition of [3H]spiperone binding to human dopamine receptor D2 short expressed in Chinese hamster ovary cells ChEMBL_533452 (CHEMBL986944) Agonist activity at rat dopamine D2(short) receptor expressed in CHOK1 cells by [35S]GTPgammaS binding assay ChEMBL_60362 (CHEMBL672097) In vitro binding affinity tested on human Dopamine receptor D2 (short) using [3H]spiperone as a radioligand ChEMBL_149039 (CHEMBL762232) Compound was evaluated for OT receptor affinity by displacement of [3H]OT from binding sites in uterine tissue taken from near-term pregnant rhesus monkey ChEMBL_1364910 (CHEMBL3295081) Displacement of [3H]Spiperone from human dopamine D2 short receptor expressed in CHO cells by competitive binding assay ChEMBL_2127677 (CHEMBL4837022) Inhibition of eIF4A (unknown origin) assessed as inhibition of translation of RNA featuring short 5'-UTR of tubulin ChEMBL_357161 (CHEMBL859988) Intrinsic activity against dopamine D2(short) receptor assessed as [3H]thymidine uptake in CHO cells by mitogenesis assay ChEMBL_320970 (CHEMBL885377) Binding affinity (low) towards human dopamine receptor 2 short against radioligand [3H]spiperone, expressed in Chinese hamster ovary cells ChEMBL_60233 (CHEMBL671415) In vitro ability to displace [3H]spiperone from the cloned human dopamine D2 short receptor expressed in CHO cells ChEMBL_60364 (CHEMBL672099) In vitro binding affinity to displace [3H]-spiperone from the cloned human dopamine receptor D2 short in CHO cells ChEMBL_60368 (CHEMBL672103) In vitro binding affinity to displace [3H]spiperone from the cloned human dopamine receptor D2 short in CHO cells ChEMBL_61815 (CHEMBL672579) In vitro displacement of [3H]spiperone from the recombinant human dopamine receptor D2 short form expressed in CHO cells ChEMBL_786910 (CHEMBL1920024) Displacement of [3H]spiperone from human DRD2 short receptor expressed in chinese hamster CHO cells by radioligand binding assay Receptor Affinity Assay It is well-known that drug compounds that have an affinity for the striatal dopamine D2 may give rise to adverse side effects, such as short-term extrapyramidal disorders and tardive dyskinesia. Such adverse effects e.g., have been observed for metoclopramide (CAS No.: 364-62-5), which reduces its utility in particular for the long-term treatment of chronic diseases. The in vitro affinity for the dopamine D2 receptor of Cpd A, and of two prior art compounds metoclopramide and declopramide (CAS No.: 891-60-1) was investigated using an in vitro radioligand binding technique with 125I-spiperone as the radioactive ligand. ChEMBL_1778263 (CHEMBL4235255) Inhibition of CFTR-mediated forskolin-induced chloride secretion in human T84 cells after 15 mins by short-circuit current analysis ChEMBL_1810771 (CHEMBL4310231) Binding affinity to recombinant human full length DNA-tagged BRD4 short isoform expressed in bacterial expression system by bromoscan assay ChEMBL_364279 (CHEMBL863217) Activity at TPalpha (short isoform) receptor expressed in HEK293 cells assessed as ability to antagonize U46619-mediated calcium ion mobilization ChEMBL_511651 (CHEMBL976298) Inhibition of human wild type CFTR expressed in rat FRT cells assessed as chloride current by short-circuit current measurements ChEMBL_58635 (CHEMBL665385) In vitro for its ability to displace [3H]- spiperone from cloned human dopamine D2 short receptor expressed in CHO cells ChEMBL_60076 (CHEMBL671732) In vitro binding affinity at human cloned dopamine receptor D2 (short) stably expressed in CHO cells by [3H]spiperone displacement. ChEMBL_61940 (CHEMBL675128) In vitro for its ability to displace [3H]- spiperone from cloned human dopamine D2 short receptor expressed in CHO cells ChEMBL_970231 (CHEMBL2406498) Inhibition of short-form RON (unknown origin) expressed in human HeLa cells assessed as phosphorylated RON levels after 4 hrs ChEMBL_1979353 (CHEMBL4612488) Binding affinity to human full-length BRD4 short isoform (M1 to A722 residues) expressed in bacterial expression system by BROMOscan assay ChEMBL_320984 (CHEMBL872131) Binding affinity towards human dopamine receptor 2 (short) expressed in Chinese hamster ovary cells using [3H]spiperone (0.5 nM) as radioligand ChEMBL_1629516 (CHEMBL3872142) Agonist activity at human GPR120 short isoform expressed in CHOK1 cells assessed as beta-arrestin recruitment after 90 mins by luminescence assay ChEMBL_320994 (CHEMBL872141) Low binding affinity towards human dopamine receptor 2 (short) expressed in Chinese hamster ovary cells using [3H]spiperone (0.5 nM) as radioligand ChEMBL_320995 (CHEMBL872142) High binding affinity towards human dopamine receptor 2 (short) expressed in Chinese hamster ovary cells using [3H]spiperone (0.5 nM) as radioligand Biochemical BTK Assay Z′-LYTE biochemical assay employs a fluorescence resonance energy transfer (FRET)-based, coupled-enzyme format and is based on the differential sensitivity of phosphorylated and non-phosphorylated peptides to proteolytic cleavage. Both ends of the short peptide substrate are labeled with two fluorescent groups to form a FRET paired combination. In the primary reaction (the Kinase Reaction), the kinase transfers the γ-phosphate of ATP to a single serine or threonine residue on the short peptide substrate. In the secondary reaction (the development reaction), the non-phosphorylated short peptides were recognized and cleaved by a site-specific protease (the development reagent). Phosphorylated short peptides can resist such cleavage. Cleavage of short peptides can disrupt the donor (such as coumarin) and receptor fluorophores (fluorescein) on the short peptides, while the phosphorylated short peptides can maintain FRET. The calculation method of the ratio is as follows, and the ratio of the respective emission signals generated by the donor fluorophores emitted (after excitation at 400 nm) to the receptors is calculated. Emission signal ratio=emitted light by coumarin (445 nm)/emitted light by fluorescein (520 nm). If the FRET short peptide is phosphorylated (such as no kinase inhibitor), the emitted light ratio will remain in a lower level. If the FRET short peptide is non-phosphorylated (such as kinase inhibitor), the emitted light ratio will be in a higher level. In this way, the inhibitory effects of different compound inhibitors on BTK kinase activity would be distinguished. ChEBML_61810 Binding affinity of compound measured using [3H]spiperone for the cloned human dopamine receptor D2 short (high/low affinity is given as 35/3700) ChEMBL_1629515 (CHEMBL3872141) Agonist activity at human GPR120 short isoform expressed in CHOK1 cells assessed as increase in IP1 accumulation after 60 mins by HTRF assay ChEMBL_1632277 (CHEMBL3874983) Agonist activity at human GPR120 short isoform expressed in CHOK1 cells assessed as induction of IP1 accumulation after 60 mins by HTRF assay ChEMBL_58636 (CHEMBL875028) In vitro for its ability to displace [3H]- spiperone from cloned human dopamine D2 short receptor expressed in CHO cells; Low binding affinity ChEMBL_58637 (CHEMBL665386) In vitro for its ability to displace [3H]- spiperone from cloned human dopamine D2 short receptor expressed in CHO cells; high binding affinity ChEMBL_651412 (CHEMBL1227385) Inhibition of CFTR in nonpermeabilized human T84 cells assessed as inhibition of forskolin and IBMX-induced chloride current by short-circuit current analysis ChEMBL_1365262 (CHEMBL3293227) Agonist activity at human dopamine D2 short receptor transiently expressed in HEK293 cells co-expressing Galphai2 after 30 mins by [35S]GTPgammaS binding assay ChEMBL_2152472 (CHEMBL5037019) Potentiation of wild type CFTR (unknown origin) expressed in HBE cells assessed as change in short circuit current in presence of forskolin and amiloride ChEMBL_2216614 (CHEMBL5129746) Antagonist activity at human adenosine A2A receptor expressed in HEK293T cells assessed as inhibition of NECA-induced Gs short protein activation by TRUPATH assay ChEMBL_2262113 (CHEMBL5217124) Binding affinity to human Sirt3 (118 to 399 residues) assessed as dissociation constant by short DNA nano levers based switchSENSE microfluid bio-chip analysis ChEMBL_579228 (CHEMBL1058022) Inhibition of SGK1-mediated epithelial sodium channel activity in human M-1 cells assessed as short circuit current by whole cell electrophysiological transepithelial experiment ChEMBL_58632 (CHEMBL665382) Binding affinity of compound measured using [3H]spiperone for the cloned human dopamine receptor D2 short (high/low affinity is given as 130/50000) ChEMBL_58633 (CHEMBL665383) Binding affinity of compound measured using [3H]spiperone for the cloned human dopamine receptor D2 short (high/low affinity is given as 27/1800) ChEMBL_58634 (CHEMBL665384) Binding affinity of compound measured using [3H]spiperone for the cloned human dopamine receptor D2 short (high/low affinity is given as 40/3600) ChEMBL_61810 (CHEMBL672574) Binding affinity of compound measured using [3H]spiperone for the cloned human dopamine receptor D2 short (high/low affinity is given as 35/3700) ChEMBL_769085 (CHEMBL1832642) Inhibition of human wild-type CFTR expressed in FRT cells assessed as inhibition of forskolin-induced short-circuit current by voltage clamp electrophysiology assay ChEMBL_2152470 (CHEMBL5037017) Potentiation of CFTR F508 deletion mutant (unknown origin) expressed in HBE cells assessed as change in short circuit current in presence of forskolin and amiloride ChEMBL_2262111 (CHEMBL5217122) Binding affinity to human Sirt3 (118 to 399 residues) assessed as dissociation constant (Kon) by short DNA nano levers based switchSENSE microfluid bio-chip analysis ChEMBL_2262112 (CHEMBL5217123) Binding affinity to human Sirt3 (118 to 399 residues) assessed as dissociation constant (Koff) by short DNA nano levers based switchSENSE microfluid bio-chip analysis ChEMBL_651195 (CHEMBL1228135) Inhibition of CFTR in nonpermeabilized human bronchial epithelial cells assessed as inhibition of forskolin and IBMX-induced chloride current at by short-circuit current analysis ChEMBL_1365266 (CHEMBL3293231) Antagonist activity at human dopamine D2 short receptor transiently expressed in HEK293 cells assessed as inhibition of beta-arrestin recruitment after 6 hrs by chemiluminescence assay ChEMBL_1512947 (CHEMBL3609986) Inhibition of ENaC in mouse M1 assessed as effect on trans epithelial electrical resistance by measuring short circuit currents by voltage-clamp based Ussing chamber assay ChEMBL_2086891 (CHEMBL4768154) Potentiator activity at CFTR F508del mutant (unknown origin) expressed in CFBE41o cells assessed as increase in forskolin induced transepithelial short circuit current by Ussing chamber assay ChEMBL_960597 (CHEMBL2389886) Inhibition of wild type human CFTR chloride conductance expressed in forskolin-stimulated rat FRT cells by short-circuit current analysis in presence of transepithelial chloride gradient ChEMBL_1365268 (CHEMBL3293233) Partial agonist activity at human dopamine D2 short receptor transiently expressed in HEK293 cells assessed as inhibition of beta-arrestin recruitment after 6 hrs by chemiluminescence assay ChEMBL_1632275 (CHEMBL3874981) Agonist activity at ARMS2-PK2 -tagged human GPR120 short isoform expressed in CHOK1 cells assessed as induction of beta-arrestin2 recruitment after 90 mins by luminescence assay ChEMBL_1649652 (CHEMBL3998786) Activation of human CFTR expressed in forskolin-stimulated basolateral membrane permeabilized FRT cells co-expressing YFP assessed as increase in short-circuit current by voltage clamp method ChEMBL_1705057 (CHEMBL4056290) Agonist activity at human GPR120 short splice variant expressed in HEK293 cells assessed as increase in intracellular calcium flux by Fluo-4 NW dye based FLIPR assay ChEMBL_1659972 (CHEMBL4009584) Activation of human CFTR expressed in forskolin-stimulated basolateral membrane permeabilized FRT cells assessed as increase in short-circuit current amplitude after 30 mins by voltage clamp method ChEMBL_1666072 (CHEMBL4015868) Inhibition of human TMEM16A expressed in FRT cells assessed as reduction of ATP-induced in chloride conductance preincubated for 5 mins followed by ATP addition by short-circuit current assay ChEMBL_1666074 (CHEMBL4015870) Inhibition of human TMEM16A expressed in FRT cells assessed as reduction of ATP-induced in chloride conductance preincubated for 20 mins followed by ATP addition by short-circuit current assay ChEMBL_1666092 (CHEMBL4015888) Inhibition of TMEM16B (unknown origin) expressed in FRT cells assessed as reduction of ATP-induced chloride conductance preincubated for 20 mins followed by ATP addition by short-circuit current assay ChEMBL_2319561 Inhibition of N-terminal GST-tagged human recombinant DPP-9 short form (1 to 863 residues) expressed in Sf9 cells using Ala-Pro-AMC dipeptide as substrate by fluorescence based assay ChEMBL_1753998 (CHEMBL4188758) Agonist activity at recombinant human GPR120 short isoform expressed in HEK293 cells assessed as intracellular calcium flux measured for 300 secs at 1 sec time interval by Fluo-4 NW based FLIPR assay Imidazole Spin Shift Assay In short, the difference between the imidazole-bound low-spin peak at 430 nm and the inhibitorbound high-spin peak at 395 nm was measured as a function of inhibitor concentration. ChEMBL_1927381 (CHEMBL4430453) Reversible inhibition of recombinant human Adk-short expressed in Escherichia coli BL21[DE3] assessed as [3H]AMP formation preincubated for 15 mins followed by [3H]adenosine addition measured after 30 mins by liquid scintillation counting method radioligand binding assay The structure-activity relationship and optimization studies have led to the discovery of selective T-type calcium channel blockers, e.g., compound 9. As used herein, the term T-type calcium channel blocker refers to a compound that can modulate, in particular inhibit or reduce activation of T-type calcium channels. In some embodiments, the IC50 of compounds of the invention for inhibiting T-type calcium channel is about 10 μM or less, typically about 2 μM or less, and often about 1 μM or less. The term about refers to ±20%, typically ±10%, and often ±5% of the numeric value. ChEMBL_1659128 (CHEMBL4008740) Agonist activity at human dopamine D2 receptor-short expressed in CHO-K1 cells assessed as reduction in adenylyl cyclase activator NKH 477 induced cAMP accumulation preincubated for 10 mins followed by NKH 477 addition by HTRF assay ChEMBL_2222625 (CHEMBL5135959) Modulation of CFTR F508 deletion mutant expressed in HBE cells assessed as change in short circuit current incubated for 18 to 24 hrs in presence of forskolin, amiloride and human serum by voltage-clamp based chamber assay ChEMBL_2262116 (CHEMBL5217127) Binding affinity to human Sirt3 (118 to 399 residues) assessed as dissociation constant of ternary complex using acetylated MnSOD peptide as substrate in presence of OAADPr by short DNA nano levers based switchSENSE microfluid bio-chip analysis ChEMBL_651188 (CHEMBL1227953) Inhibition of human CFTR expressed in rat FRT cells assessed as inhibition of CPT-cAMP-induced apical membrane current in presence of transepithelial chloride gradient and basolateral membrane permeabilization with amphotericin B by short-circuit current analysis Z-LYTE biochemical assay Z′-LYTE biochemical assay employs a fluorescence resonance energy transfer (FRET)based, coupled-enzyme format and is based on the differential sensitivity of phosphorylated and non-phosphorylated peptides to proteolytic cleavage. Both ends of the short peptide substrate are labeled with two fluorescent groups to form a FRET paired combination. In the primary reaction (the Kinase Reaction), the kinase transfers the γ-phosphate of ATP to a single serine or threonine residue on the short peptide substrate. In the secondary reaction (the development reaction), the non-phosphorylated short peptides were recognized and cleaved by a site-specific protease (the development reagent). Phosphorylated short peptides can resist such cleavage. Cleavage of short peptides can disrupt the donor (such as coumarin) and receptor fluorophores (fluorescein) on the short peptides, while the phosphorylated short peptides can maintain FRET. The calculation method of the ratio is as follows, and the ratio of the respective emission signals generated by the donor fluorophores emitted (after excitation at 400 nm) to the receptors is calculated. Emission signal ratio=emitted light by coumarin (445 nm)/emitted light by fluorescein (520 nm). If the FRET short peptide is phosphorylated (such as no kinase inhibitor), the emitted light ratio will remain in a lower level. If the FRET short peptide is non-phosphorylated (such as kinase inhibitor), the emitted light ratio will be in a higher level. In this way, the inhibitory effects of different compound inhibitors on BTK kinase activity would be distinguished.The experiment were carried out according to the instructions of the Z′-LYTE kinase test kit-tyrosine 1 peptide. Reagent preparation: 1.33× kinase buffer: 5× kinase buffer was diluted with water to 1.33× kinase buffer; an enzyme solution: the kinase was dissolved in 1.33× kinase buffer with the final working concentration being 3.32 nM; a short peptide solution: a short peptide stock solution (1 mM dissolved in DMSO) was dissolved in 1.33× kinase buffer with the final working concentration being 2 μM; Z′-LYTE Tyr01 phosphorylated short peptide solution, 0.6 μl of stock solution (1 mM dissolved in DMSO) was dissolved in 149.4 μl of 1.33× kinase buffer; an ATP solution: an ATP stock solution (10 mM aqueous solution) was dissolved in 1.33× kinase buffer with the final working concentration being 32 μM; a color-developing solution: color-developing solution B was dissolved in color-developing buffer with the final working concentration being 1× color-developing solution; 4× compound preparation: the compound was diluted in 3-fold gradient concentration to finally obtain 4% DMSO aqueous solution containing different concentrations of the compound, with the final working concentration being 3000, 1000, 333.33, 111.11, 37.04, 12.35, 4.12, 1.37 nM, 8 concentration points in total.Specific steps of the experiment: In the experiment, there were three control groups, each with 8 replicate wells, which were C1 100% inhibition group (no ATP), C2 0% inhibition group (with ATP), and C3 100% phosphorylation group, respectively. 2.5 μl of serially diluted compound was added to each well of a 384-well plate, with double replicate wells, and 4% DMSO solution was added to wells C1, C2, and C3. After that, except for wells C3, 2.5 μl of BTK enzyme solution was added to each remaining well, which was left to stand at 4° C. for 30 minutes. After that, except for wells C3, 2.5 μl of short peptide solution was added to each well, and 5 μl of phosphorylated short peptide solution was added to each of wells C3. 2.5 μl of 1.33× kinase buffer was added to each of wells C1 and C3, and 2.5 μl of ATP solution was added to each of the remaining wells. The wells were centrifuged transiently, and the plate was shaken at 1000 rpm for 30 seconds to perform transient centrifuge. ChEMBL_1719140 (CHEMBL4134140) Agonist activity at human GPR120 short splice variant expressed in HEK293 cells assessed as increase in intracellular calcium flux incubated for 30 mins measured for 300 secs at 1 sec interval by Fluo-4 NW dye based FLIPR assay ChEMBL_2262114 (CHEMBL5217125) Binding affinity to human Sirt3 (118 to 399 residues) assessed as dissociation constant (Kon) of ternary complex using acetylated MnSOD peptide as substrate in presence of OAADPr by short DNA nano levers based switchSENSE microfluid bio-chip analysis ChEMBL_2262115 (CHEMBL5217126) Binding affinity to human Sirt3 (118 to 399 residues) assessed as dissociation constant (Koff) of ternary complex using acetylated MnSOD peptide as substrate in presence of OAADPr by short DNA nano levers based switchSENSE microfluid bio-chip analysis NOX Enzyme Inhibition Assay The inhibition of NADPH oxidase (NOX), which is involved in the generation of reactive oxygen species in red mold, results in the suppression of normal hyphal growth and the formation of abnormal structures known as short-term conidia, thereby inhibiting germination. The abnormal phenotypes caused by the reduction of reactive oxygen species within the red mold can be easily observed through optical microscopy. Through this method, the ability to inhibit the generation of reactive oxygen species by NOX inhibition was evaluated.Specifically, to evaluate the activity of the compounds, a 0.1 mM concentration of the compound was added to a spore suspension of minimal medium diluted to 1/5 (MM20). Spores of the wild-type strain GZ3639 of red mold (105 spores/ml) were inoculated into the medium and incubated at 25° C. or 24 hours, followed by microscopic observation. Compounds that exhibited more than 50% inhibition of germination and short-term conidia formation compared to normal germination were selected for further activity evaluation at concentrations of 50 μM, 25 μM, and 10 μM. Among these, compounds showing 95% germination inhibition at 10 μM were further evaluated at concentrations of 5 μM, 1 μM, 0.5 μM, and 0.1 μM. Based on these results, the concentration of the compound at which the spore germination inhibition rate reached 50% (inhibitory concentration 50%, IC50) was determined. In Vitro Assay In vivo assays for 15-PGDH expression or 15-PGDH activity, e.g., ligands, agonists, antagonists, and their homologs and mimetics. The term modulator includes inhibitors and activators. Inhibitors are agents that, e.g., inhibit expression of 15-PGDH or bind to, partially or totally block stimulation, decrease, prevent, delay activation, inactivate, desensitize, or down regulate the activity of 15-PGDH, e.g., antagonists. Determination of Biochemical BTK 1. Reagents and Materials: BTK recombinant protein: Invitrogen, Cat #PV3363;Z′-LYTE kinase test kit-tyrosine 1 peptide: Invitrogen, Cat #PV3190;384-well low-flange black flat-bottomed polystyrene NBS microplate, no lid, no sterilization: Corning, Cat #3575;96-well polystyrene conical-bottomed MicroWell plate, sealed with a lid: Thermo Scientific Nunc , Cat #277143;Envision multi-mode plate reader: PerkinElmer; Mixmate shaker: Eppendorf;TS-2102 shaking incubator: TENSUC; 2. Methods: Z′-LYTE biochemical assay employs a fluorescence resonance energy transfer (FRET)-based, coupled-enzyme format and is based on the differential sensitivity of phosphorylated and non-phosphorylated peptides to proteolytic cleavage. Both ends of the short peptide substrate are labeled with two fluorescent groups to form a FRET paired combination. In the primary reaction (the Kinase Reaction), the kinase transfers the γ-phosphate of ATP to a single serine or threonine residue on the short peptide substrate. In the secondary reaction (the development reaction), the non-phosphorylated short peptides were recognized and cleaved by a site-specific protease (the development reagent). Electrophysiological Assay Clamped the cell at −80 mV and then depolarized to 10 mV with a square wave lasting 10 ms to get the Nav1.8 current (see FIG. 1 attached). This procedure was repeated every 5 seconds. The maximum current triggered by the square wave was detected, and when it stabilized, the test compounds were perfused, and when the reaction stabilized, the strength of the block was calculated. Biacore Assay The evaluation of the binding affinity (KD) of the compounds of formula (I) to the HSP90 protein was done using Biacore T100.His-HSP90 N-term domain was immobilized by capture of his tag by the Ab previously covalently bound to the chip (CM5) surface. A short cross-linking procedure after HSP90 binding was necessary in order to obtained a more stable signal.The compounds were analyzed using the following running buffer: 20 mM Tris/HCl pH 7.6, 150 mM KCl, 5 mM MgCl2, 0.05% P20 and 1% DMSO. The flow rate was 50 ul/min with and association time of 60 seconds.The cpds were diluted in running buffer from 100x stock solution; the different conc injected were obtained from a sequential dilution in order to have the same DMSO conc. in each sample and avoid any solvent correction.A series of 5 sequential injections of increasing concentrations of compound were performed and the results were analyzed using a method reported in literature (Robert Karlsson et al). HDAC Inhibition Assay These SAR data indicate that a tripartite structure of this scaffold with a central C(O) NH NH unit flanked by a phenyl group and a short aliphatic chain increases HDAC inhibition. As for the phenyl group, the presence of a relatively bulky substituent at the para position relative to the carbonyl group also affords potent HDAC inhibitors (Table 2). HDAC Inhibition These SAR data indicate that a tripartite structure of this scaffold with a central C(O) NH NH unit flanked by a phenyl group and a short aliphatic chain increases HDAC inhibition. As for the phenyl group, the presence of a relatively bulky substituent at the para position relative to the carbonyl group also affords potent HDAC inhibitors. Identification of CSNK1A1 Inhibitors In order to identify inhibitors of CSNK1A1, the CSNK1A1 knockdown signatures in CMap were compared to all CMap compound signatures, and resultant compounds were ranked by strength of signature similarity. The top ranked compound from this analysis (compound 1) was predicted to act as a CSNK1A1 inhibitor.The CMap prediction was confirmed using Kinomescan (FIG. 1 ). Compound 1 bound to only six out of over 400 kinases tested in the assay, including CSNK1A1. Z'-LYTE Biochemical Assay The experiment were carried out according to the instructions of the Z′-LYTE kinase test kit-tyrosine 1 peptide. Reagent preparation: 1.33 kinase buffer: 5 kinase buffer was diluted with water to 1.33 kinase buffer; an enzyme solution: the kinase was dissolved in 1.33 kinase buffer with the final working concentration being 3.32 nM; a short peptide solution: a short peptide stock solution (1 mM dissolved in DMSO) was dissolved in 1.33 kinase buffer with the final working concentration being 2 uM; Z′-LYTE Tyr01 phosphorylated short peptide solution, 0.6 ul of stock solution (1 mM dissolved in DMSO) was dissolved in 149.4 ul of 1.33 kinase buffer; an ATP solution: an ATP stock solution (10 mM aqueous solution) was dissolved in 1.33 kinase buffer with the final working concentration being 32 uM; a color-developing solution: color-developing solution B was dissolved in color-developing buffer with the final working concentration being 1 color-developing solution; 4 compound preparation: the compound was diluted in 3-fold gradient concentration to finally obtain 4% DMSO aqueous solution containing different concentrations of the compound, with the final working concentration being 3000, 1000, 333.33, 111.11, 37.04, 12.35, 4.12, 1.37 nM, 8 concentration points in total. Inhibition Assay The term selective inhibitor as used in reference to MMPs refers to an inhibitor that inhibits the enzymatic activity of one MMP in the presence of one or more other MMPs, typically by at least one order of magnitude, for example, with respect to the Ki. The methods used to obtain Ki data are known in the art and are described, for example, by Brown et al., J. Amer. Chem. Soc. 2000, 122(28), 6799-6800, and the references cited therein. Additional useful assays and techniques are described in U.S. Patent Publication No. 2009/0209615 (Lipton et al.), which is incorporated herein by reference in its entirety. Binding Assay Dopamine, D2S: Materials and Methods: Receptor Source: Human recombinant expressed in CHO cells Radioligand: [3H]Spiperone (20-60 Ci/mmol) Control Compound: Haloperidol Incubation Conditions: The reactions were carried out in 50 mM TRIS-HCl (pH 7.4) containing 120 mM NaCl, 5 mM KCl, 5 mM MgCl2, 1 mM EDTA for 60 minutes at 25 C. The reaction was terminated by rapid vacuum filtration onto glass fiber filters. Radioactivity trapped onto the filters was determined and compared to control values in order to ascertain any interactions of test compounds with the cloned dopamine D2 short binding site Radioligand Binding Assay Dopamine, D2s: Radioligand: [3H]Spiperone (20-60 Ci/mmol) or [3H]-7-hydroxy DPAT, 1.0 nMControl Compound: Haloperidol or ChlorpromazineIncubation Conditions: The reactions were carried out in 50 mM TRIS-HCl (pH 7.4) containing 120 mM NaCl, 5 mM KCl, 5 mM MgCl2, 1 mM EDTA for 60 minutes at 25 C. The reaction was terminated by rapid vacuum filtration onto glass fiber filters. Radioactivity trapped onto the filters was determined and compared to control values in order to ascertain any interactions of test compounds with the cloned dopamine D2 short binding site Radioligand Binding Assay, Dopamine, D2S Receptor Source: Human recombinant D2S expressed mammalian cellsRadioligand: [3H]Spiperone (20-60 Ci/mmol) or [3H]-7-hydroxy DPAT, 1.0 nMControl Compound: Haloperidol or ChlorpromazineIncubation Conditions: The reactions were carried out in 50 mM TRIS-HCl (pH 7.4) containing 120 mM NaCl, 5 mM KCl, 5 mM MgCl2, 1 mM EDTA for 60 minutes at 25 C. The reaction was terminated by rapid vacuum filtration onto glass fiber filters. Radioactivity trapped onto the filters was determined and compared to control values in order to ascertain any interactions of test compounds with the cloned dopamine-D2 short binding site. Assay on In Vitro Enzyme-Inhibiting Activity Test compounds: a part of compounds of the invention, the chemical names and preparation methods of which can be found in their preparation examples.Control agent: CO-1686, the structure of which can be found in the Background Art, prepared by the inventors (please refer to Patent WO2012061299A1 for the preparation methods).The meanings represented by the abbreviations in the experiments are described as follows.EDTA: eathylene diamine tetraacetic acidDMSO: dimethyl sulfoxideSD: standard deviationFAM: carboxyfluoresceinBrij-35: polyethylene glycol dodecyl etherHEPES: N-2-hydroxyethylpiperazine-N′-2-ethanesulfonic acidDTT: dithiothreitolExperimental method: the compounds were screened in the presence of Km ATP by Mobility Shift Assay using the kinases EGFR and EGFR_T790M.1. Preparation of Reagents(1) 1-fold kinase buffer for detecting the kinases wild-type EGFR (WT EGFR or WT for short), EGFR (d746-750) (d746-750 for short), EGFR (d746-750)-T790M ((d746-750)-T790M for short): 50 mM HEPES (pH 7.5), 0.0015% Brij-35, 10 mM MgCl2, 10 mM MnCl2, and 2 mM DTT;(2) 1-fold kinase buffer for detecting the kinases EGFR T790M (T790M for short), EGFR L858R (L858R for short), EGFR T790M-L858R (T790M-L858R for short): 50 mM HEPES (pH 7.5), 0.0015% Brij-35, 5 mM MgCl2, and 2 mM DTT.(3) Stop Solution100 mM HEPES (pH 7.5), 0.015% Brij-35, 0.2% Coating Reagent #3, and 50 mM EDTA2. Preparation of a Compound Solution(1) To the second well of a 96-well plate, 5 μL 10 mM compound (dissolved in DMSO) was added, and 95 μL 100% DMSO was added to prepare 100 μL 0.5 mM compound.(2) To other wells, 60 μL 100% DMSO was added. 20 μL compound from the second well was added to the third well, and 4-fold dilution was further performed to get 10 diluted concentrations.(3) To the first well and the twelfth well of the 96-well plate, 100 μL 100% DMSO was separately added, and the two wells were used as control wells.(4) 10 μL from each well of the 96-well plate was added to another 96-well plate, and 90 μL 1-fold kinase buffer was added.(5) 5 μL from the 96-well plate was added to another 384-well plate, for example, transferred from A1 well of the 96-well plate to A1 and A2 wells of the 384-well plate, and transferred from A2 well of the 96-well plate to A3 and A4 wells of the 384-well plate, and so on.3. Kinase reaction(1) Preparation of 2.5-fold enzyme solutionKinase was added to 1-fold kinase buffer to form 2.5-fold enzyme solution.(2) Preparation of 2.5-fold substrate solutionFAM-tagged polypeptide and ATP were added to 1-fold kinase buffer to form 2.5-fold substrate solution.(3) Addition of 2.5-fold enzyme solution to 384-well plateTo 384-well plate, 10 μL 2.5-fold enzyme solution was added, and incubated at room temperature for 10 min.(4) Addition of 2.5-fold substrate solution to 384-well plateTo 384-well plate, 10 μL 2.5-fold substrate solution was added.(5) Kinase reaction and stopAfter incubation at 28° C. for a period of time (depending on kinase), 25 μL stop solution was added.4. Data on percent conversion was read by Caliper.5. Data analysis(1) Data on enzyme activity was obtained by Caliper program;(2) Inhibition rate of enzyme activity was calculated from the data on enzyme activity by the following formula: Inhibition rate(%)=(maximal value−the measured value of a test compound)/(maximal value-minimal value)×100,wherein, the maximal value represents the measured value of DMSO control; and the minimal value represents the measured value of blank control.(3) Calculation of IC50 value by XLFit excel. Inhibition Assay The inhibition assays were performed at 25° C. in 50 mM 3,3-dimethylglutarate buffer, pH 7.0, containing 1 mM EDTA with an ionic strength of 0.15M adjusted by NaCl. The salicylic acid based library was screened in a 96-well format at 10 μM compound concentration. The reaction was started by the addition of 50 μl of the enzyme to 150 μl of reaction mixture containing the final Km value of pNPP and various concentrations of the inhibitor in 96-well plate. The reaction was quenched after 10 minutes by the addition of 50 μl of 5N NaOH, and then this reaction mixture was detected for absorbance at 405 nm by a Spectra MAX340 microplate spectrophotometer (Molecular Devices). PHD2 Enzymatic Assay Compound DMSO stock preparation: All compounds were reconstituted into 20 mM stock by DMSO.Compound storage: All compounds in DMSO were stored at RT in a desiccator for short-term storage (up to 3 months). Leftover compounds were store at −20 for longer term.Working Stock Preparation:Reference Roxadustat (FG-4592) was 3-fold serial diluted from 400 μM for 10 doses in DMSO.The compounds were 3-fold serial diluted from 400 μM for 10 doses in DMSO.Prepared 200 positive control (400 μM, FG-4592) and 200 vehicle control (100% DMSO).Centrifuged compound plates at 1000 rpm for 1 min.Compound Screening:a) Transferred 40 nl compound dilutions into each well of assay plates using Echo 655;b) Sealed the assay plate and centrifuge compound plates at 1000 rpm for 1 min.c) Prepared and add 4 μL of the 2 PHD2 enzyme working solution to individual well of the assay plate.d) Sealed the assay plate and centrifuge compound plates at 1000 rpm for 1 min. Incubate plate at RT for 30 min.e) Prepared and add 4 μl 2 PHD2 substrate working solution to each well of the assay plate.f) Prepared and added 4 μL 4 stop solution to the each well of the assay plate.g) Prepared 4 detection solution with AlphaScreen Streptavidin Donor beads, AlphaScreen Protein A Acceptor beads and Hydroxy-HIF-1α (Pro564) (D43B5) XP Rabbit mAb.h) Added 4 μL 4 detection solution to the each well of the assay plate. repeat at step d.i) Read Alphascreen signal on Envision HTS plate reader. ROCK2 Kinase Activity Assays HTRF assay: This assay used the CisBio HTRF KinEASE kit (kit 62ST2PEZ) and the kinase reaction containing 0.2 uM biotinylated substrate peptide (S2, CisBio), 5 uM, 100 uM or 1 mM of ATP, inhibitors (0.1-10,000 nM in 2% DMSO) and enzymes as in the 33P-ATP assay below. [33P]-ATP assay: ROCK2 activity was initially determined using a radioactive FlashPlate-based assay. In a 96-well format, biotinylated peptide substrates (2 mM final; S6-short for ROCK2), γ-[33P]-ATP (5 uM, 2 mCi/mmol), compounds (0.1-10000 nM in 2% DMSO), and ROCK2 (0.2 nM; Upstate) catalytic domains. CRBN Affinity Test CRBN affinity experiments were performed to evaluate the binding affinity of AST-DT-135, AST-DT-218, and AST-DT-220 to CRBN proteins. First, CRBN proteins were expressed in E. coli and purified, and then the purified CRBN proteins were dissolved in a buffer solution (PBS). AST-DT-135, AST-DT-218, AST-DT-220, and lenalidomide hydrate were each dissolved in a solvent, and the CRBN proteins were dispensed into a 96-well plate, and then the CRBN proteins and AST-DT-135, AST-DT-218, AST-DT-220, and a lenalidomide hydrate were each mixed and reacted. After the mixture was sufficiently mixed and reacted, the binding strength at each concentration was measured to collect data, and a binding curve was created therefrom, and the KD (equilibrium dissociation constant) values were derived therefrom. Binding Assay Receptor Source: Human recombinant expressed in CHO cells Radioligand: [3H]Spiperone (20-60 Ci/mmol) Control Compound: Haloperidol Incubation Conditions: The reactions were carried out in 50 mM TRIS-HCl (pH 7.4) containing 120 mM NaCl, 5 mM KCl, 5 mM MgCl2, 1 mM EDTA for 60 minutes at 25 C. The reaction was terminated by rapid vacuum filtration onto glass fiber filters. Radioactivity trapped onto the filters was determined and compared to control values in order to ascertain any interactions of test compounds with the cloned dopamine—D2 short binding site (Literature Reference: Jarvis, K. R. et al. Journal of Receptor Research 1993, 13(1-4), 573-590; Gundlach, A. L. et al. Life Sciences 1984, 35, 1981-1988.) Cytochrome P450 2C9 Inhibition Assay (Amodiaquine) The inhibition of cytochrome P450 2C8-isoenzyme catalysed deethylation of Amodiaquine by the test compound is assayed at 37° C. with human liver microsomes. All assays are carried out on a robotic system in 96 well plates. The final incubation volume contains TRIS buffer (0.1 M), MgCl2 (5 mM), human liver microsomes (0.05 mg/ml), Amodiaquine (1 uM) and the test compound at five different concentrations or no compound (high control) in duplicate (e.g. highest concentration 10-50 uM with subsequent serial 1:4 dilutions). Following a short preincubation period, reactions are started with the cofactor (NADPH, 1 mM) and stopped by cooling the incubation down to 8° C. and subsequently by addition of one volume of acetonitrile. Cytochrome P450 2C9 Inhibition Assay (Diclofenac) The inhibition of cytochrome P450 2C9-isoenzyme catalysed hydroxylation of Diclofenac by the test compound is assayed at 37° C. with human liver microsomes. All assays are carried out on a robotic system in 96 well plates. The final incubation volume contains TRIS buffer (0.1 M), MgCl2 (5 mM), human liver microsomes (0.1 mg/ml), Diclofenac (10 uM) and the test compound at five different concentrations or no compound (high control) in duplicate (e.g. highest concentration 10-50 uM with subsequent serial 1:4 dilutions). Following a short preincubation period, reactions are started with the cofactor (NADPH, 1 mM) and stopped by cooling the incubation down to 8° C. and subsequently by addition of one volume of acetonitrile. Cytochrome P450 2C9 Inhibition Assay (Mephenytoin) The inhibition of cytochrome P450 2C19-isoenzyme catalysed hydroxylation of Mephenytoin by the test compound is assayed at 37° C. with human liver microsomes. All assays are carried out on a robotic system in 96 well plates. The final incubation volume contains TRIS buffer (0.1 M), MgCl2 (5 mM), human liver microsomes (0.5 mg/ml), (S)-Mephenytoin (70 uM) and the test compound at five different concentrations or no compound (high control) in duplicate (e.g. highest concentration 10-50 uM with subsequent serial 1:4 dilutions). Following a short preincubation period, reactions are started with the cofactor (NADPH, 1 mM) and stopped by cooling the incubation down to 8° C. and subsequently by addition of one volume of acetonitrile. Agonistic Activity of Polypeptide Compounds for GHSR-1a The activity of GHSR-1a can be measured using different techniques, for example, by detecting the change in the intracellular conformation of GHSR, the change in G-protein coupling activity, and/or the change in intracellular messengers. Techniques such as measuring intracellular Ca2+ are preferably used to measure the activity of GHSR-1a. Examples of techniques known in the art that can be used to measure Ca2+ include the use of FLIPR calcium ion assay kits, among others. The FLIPR calcium ion assay kits use a calcium ion sensitive indicator and a masking dye to ensure that a researcher carries out high-sensitivity fluorescent screening for G protein-coupled receptors, ion channels and other calcium ion sensitive targets. This experiment used FLIPR calcium 6 assay kits and FLIPR calcium 6-QF assay kits.1. Process1.1. Cell Culture and Reagent Preparationa) Cell line: Flp In-CHO-GHSR Stable Pool;b) Complete medium: F12K+10% fetal bovine serum+1×penicillin-streptomycin (PS)+600 μg/mL hygromycin B;c) Cell seeding medium: F12K+10% fetal bovine serum.d) Assay buffer: 1× HBSS+20 mM HEPES.e) 10× component A: Assay buffer and component A were left at room temperature (RT), 10 mL of buffer was added to component A, and the mixture was vortexed for 1-2 min and stored at −20° C.1.2. Compound Managementa) Compound stock solutions: the powders from in-house synthesis were made into 10 mM stock solutions in DMSO according to the standard protocol.b) Compound storage: all compounds in DMSO were stored in room temperature desiccators for short-term storage (at most 4 months). The remaining compounds were left at −20 ° C. for long-term storage.1.3. Agonist Activity Assaya) Flp In-CHO-GHSR Stable Pool cells were cultured in complete medium.b) The cells were placed in 25 lbs/inch cell seeding medium in a 384-well cell culture plate (Corning, 3764) at 7k cells/well and cultured overnight at 37° C. with 5% CO2.c) 20× component A was thawed at room temperature, diluted with assay buffer to 2×, and left at RT.d) The Petri dish was taken out of the incubator and equilibrated at room temperature for 10 min. The medium was changed to apricot buffer. After the final wash, 20 μL of buffer was kept in each well, 20 μL of 2× component A was then added to each well, and the plate was incubated at 37° C. for 3-5 s.e) 10 μL of 5× compound was added to the 384-well cell culture plate, and data collection was immediately performed using FLIPR Tetra. Counterscreen for agonists of heterodimerization of the mu 1 (OPRM1) and delta 1 (OPRD1) opioid receptors: Luminescence-based cell-based high throughput dose response assay Source (MLPCN Center Name): The Scripps Research Institute Molecular Screening Center (SRIMSC) Affiliation: The Scripps Research Institute, TSRI Assay Provider: Lakshmi A. Devi, Mount Sinai School of Medicine Network: Molecular Library Probe Production Centers Network (MLPCN) Grant Proposal Number: R03NS053751 Grant Proposal PI: Lakshmi A. Devi, Mount Sinai School of Medicine External Assay ID: OPRD1_AG_LUMI_1536_3XEC50 DCSRUN Name: Counterscreen for agonists of heterodimerization of the mu 1 (OPRM1) and delta 1 (OPRD1) opioid receptors: Luminescence-based cell-based high throughput dose response assay to identify agonists of OPRD1 homodimerization. Description: Opiates such as morphine are the choice analgesic in the treatment of chronic pain due to their potent and rapid action. However, their long-term use is limited because of the development of tolerance and dependence, as well as respiratory suppression and constipation (1). Due to their clinical importance, various strategie Dose Response of Flow Cytometric HTS Screen for inhibitors of the ABC transporter ABCB6 for Cherry Pick01 University of New Mexico Assay Overview: Assay Support: NIH 1 R03 MH093193-01A1 High Throughput Screening for inhibitors of the ABC transporter ABCB6 PI: Partha Krishnamurthy, Ph.D. Screening Center PI: Larry Sklar, Ph.D. / UNMCMD Screening Lead: Mohiuddin Khan, Ph.D. Assay Implementation: Stephanie Chavez, Dominique Perez, Matthew Garcia, J. Jacob Strouse, Ph.D., Mark Carter, M.S., Anna Waller, Ph.D. UNM Cheminformatics: Cristian Bologa, Ph.D., Oleg Ursu, Ph.D. Chemistry: University of Kansas Specialized Chemistry Center KU Specialized Chemistry Center PI: Jeff Aube, Ph.D. KU SCC Project Manager: Jennifer E. Golden. Ph.D. Assay Background and Significance: The goal of this project is to implement a high throughput screening (HTS) assay to identify and develop selective chemical probes that regulate ABCB6 expression or function. The long-term objective is to use these novel pharmacological tools to understand not only the significance of ABCB6 in tumor growth and proliferation a Amplex Red Peroxide/Peroxidase-Coupled Assay The compounds of the invention can be tested for their ability to inhibit LSD1. The ability of the compounds of the invention to inhibit LSD1 can be tested as follows. Human recombinant LSD1 protein was purchased from BPS Bioscience Inc. In order to monitor LSD1 enzymatic activity and/or its inhibition rate by our inhibitor(s) of interest, di-methylated H3-K4 peptide (Millipore) was chosen as a substrate. The demethylase activity was estimated, under aerobic conditions, by measuring the release of H2O2 produced during the catalytic process, using the Amplex Red peroxide/peroxidase-coupled assay kit (Invitrogen).Briefly, a fixed amount of LSD1 was incubated on ice for 15 minutes, in the absence and/or in the presence of various concentrations of inhibitor (from 0 to 75 uM, depending on the inhibitor strength). Tranylcypromine (Biomol International) was used as a control for inhibition. Within the experiment, each concentration of inhibitor was tested in triplicate. Receptor Activity Assay The compounds are tested on HEK-293 (Human Embryonic Kidney) cells stably expressing the subunit α5 of the human GABAA receptor, and also the subunits beta2 (short) and gamma2 (long). The cells are maintained in the presence of a selection of three antibiotics, neomycin, zeocin and puromycin in a Dulbecco medium (DMEM) containing 10% (v/v) foetal bovine serum. On the day before the experiment, the cells are transferred to 96-well plates (in a density of 50,000 cells/well). The cells are then preincubated for 40 minutes with the compounds under test and are treated with GABA. The membrane potential is monitored using a blue FMP marker (Molecular Devices), following the instructions of the manufacturer. The responses are recorded for 120 seconds on a FlexStation3 plate reader (Molecular Devices, USA). Chamber Assay of CFTR-mediated short-circuit currents ssing chamber experiments were performed using human bronchial epithelial (HBE) cells derived from CF subjects heterozygous for F508del and a minimal function CFTR mutation (F508del/MF-HBE) and cultured as previously described (Neuberger T, Burton B, Clark H, Van Goor F Methods Mol Biol 2011:741:39-54). After four days the apical media was removed, and the cells were grown at an air liquid interface for >14 days prior to use. This resulted in a monolayer of fully differentiated columnar cells that were ciliated, features that are characteristic of human bronchial airway epithelia. To isolate the CFTR-mediated short-circuit (ISC) current, F508del/MF-HBE grown on Costar Snapwell cell culture inserts were mounted in an Ussing chamber and the transepithelial ISC was measured under voltage-clamp recording conditions (Vhold= 0 mV) at 37 oC. The basolateral solution contained (in mM) 145 NaCl, 0.83 K2HPO4, 3.3 KH2PO4, 1.2 MgCl2, 1.2 CaCl2, 10 Glucose, 10 HEPES (pH adjusted to 7.4 with NaOH) and the apical solution contained (in mM) 145 NaGluconate, 1.2 MgCl2, 1.2 CaCl2, 10 glucose, 10 HEPES (pH adjusted to 7.4 with NaOH) and 30 µM amiloride to block the epithelial sodium channel. Forskolin (20 µM) was added to the apical surface to activate CFTR, followed by apical addition of a CFTR inhibitor cocktail consisting of BPO, GlyH-101 and CFTR inhibitor 172 (each at 20 µM final assay concentration) to specifically isolate CFTR currents. The CFTR-mediated ISC (µA/cm2) for each condition was determined from the peak forskolin response to the steady-state current following inhibition. Chemiluminescent PARP Assay Tankyrase activity was assayed using a 96-well format HT Universal Chemiluminescent PARP Assay Kit (Trevigen, Inc, cat. no. 4676-096-K) according to the manufacturer's instructions. In short, tankyrase/PARP activity is quantified by the incorporation of biotinylated nicotinamide adenine dinucleotide (biotin-NAD+) onto the immobilised pseudo substrate, Histone. The extent of poly(Biotin-ADP)ribosylation (PARylation) in the presence of increasing dose of inhibitor is then quantified by binding of streptavidin conjugated horse radish peroxidase (strep-HRP) followed by chemiluminescent detection. Prior to assay initiation, inhibitor stocks were prepared in aqueous DMSO (10% (v/v)) from 5 millimolar (mM) stock in 100% DMSO (Sigma Aldrich, cat. no. 265855) as 10x concentrations. For the primary assay (i.e., single dose at 1 micromolar (uM) final concentration) this corresponded to 10 uM in 10% DMSO. Enzyme Assay and NMN Detection NAMPT reaction was performed in 50 mM HEPES, pH 7.5, containing 5 mM MgCl2, 0.1% Prionex, 0.005% Tween 20, and 1 mM TCEP at room temperature in Greiner 384-well black polypropylene plates. The concentration of substrates and enzymes in the final assay were as follows: ATP (120 uM), nicotinamide (5 uM), phosphoribosylpyrophosphate (6.25 uM), NAMPT enzyme (16 nM), pyrophosphatase (0.04 U/ml) in the final reaction volume 6 uL. Following 2 h incubation the reaction was stopped by addition 2.5 ul 20% acetophenone in dimethyl sulfoxide (DMSO) and 2.5 ul 2 MKOH. Plates were centrifuges and added with 10.5 ul 88% formic acid. The fluorescence (ex380/em460) was measured following another short incubation and 30 min incubation. The increased concentration of NMN was determined from a calibration curve obtained at the time of experiment. Potentiator Assay Fischer Rat Thyroid (FRT) epithelial cells, stably expressing human ΔF508-CFTR were used as monolayer cultures on permeable supports. Cl− current was measured using the short circuit current technique, under an imposed basolateral to apical Cl− gradient in Ussing chambers. To measure stable Cl− currents, FRT cells were cultured for 48 h at 27° C. to facilitate the insertion of ΔF508 CFTR into the plasma membrane. Ussing chamber studies were likewise conducted at 27° C. Under these conditions, the effects of cumulative additions of test compounds on ΔF508 CFTR currents could be quantitated with both potency and efficacy endpoints. Compounds were added to both the apical and basloalteral sides subsequent to addition of 10 μM forskolin. Efficacy of compounds was compared to a known potentiator such as gensitein. A confirmatory biochemical assay using the ADP-Hunter methodology, purified TAg, and ATP to quantify activity of synthesized compounds that inhibit the ATPase activity of Tag (3) Southern Research's Specialized Biocontainment Screening Center (SRSBSC) Southern Research Institute (Birmingham, Alabama) NIH Molecular Libraries Probe Centers Network (MLPCN) Assay Provider: Dr. Jeffery Brodsky, University of Pittsburgh Grant number: 1R03MH084077-01 The oncogenic virus Simian Virus 40 (SV40) is a well-characterized model system to examine the underlying mechanisms of growth control and cancer. SV40 is also closely related to two viruses, JC and BK virus, which infect humans, and result in morbidity and mortality in immuno-compromised patients. Although it is controversial whether SV40 also causes disease in humans, the virus has been found in specific tumors but not in the surrounding tissue. Unlike BKV and JCV, SV40 grows relatively well in mammalian cell culture systems; moreover, ~10% of the population examined in one study has antibodies against SV40, probably because the first polio vaccines were contaminated with this virus. The long-term effects of SV40 Inhibition Assay The inhibition constants (K) the compounds for four CA isozymes, CA I, II, IX and XII were determined. An Applied Photophysics (Oxford, UK) stopped-flow instrument has been used for assaying the CA-catalyzed CO2 hydration activity (Khalifah, 1971). Phenol red (at a concentration of 0.2 mM) has been used as indicator, working at the absorbance maximum of 557 nm, with 10 mM Hepes (pH 7.5) as buffer, 0.1 M Na2SO (for maintaining constant the ionic strength), following the CA-catalyzed CO2 hydration reaction for a period of 10-100 s. The CO2 concentrations ranged from 1.7 to 17 mM for the determination of the kinetic parameters and inhibition constants. For each inhibitor at least six traces of the initial 5-10% of the reaction have been used for determining the initial velocity. The uncatalyzed rates were determined in the same manner and subtracted from the total observed rates. Stock solutions of inhibitor (1 mM) were prepared in distilled-deionized water with 10-20% (v/v) DMSO. Measurement of Dissociation Constants (K) by NMR Dissociation constants were obtained by monitoring changes in chemical shifts as a function of ligand concentration. The changes in chemical shifts (d) were calculated according to the following equation (Williamson, Progress in Nuclear Magnetic Resonance Spectroscopy, Volume 73, August 2013, Pages 1-16): d=√(1/2[δ_H{circumflex over ( )}2+(α−δ_N{circumflex over ( )}2)]), Where δ are the changes in chemical shift in ppm for 1H and 15N and the correction factor (α) was set at 0.15.1H 1D protein-observed experiments were recorded with 15-50 μM protein. The standard Bruker 1D 1H sequence with excitation sculpting (zgesgp) was employed. A relaxation delay of 1 s was employed in order to use 256 scans while still keeping experimental time fairly short. Changes in protein chemical shift or peak intensity in the methyl region were monitored against compound concentration. In vitro Assay The enzymatic activity of compounds of the present invention was monitored measuring the formation of ADP using the ADP-GLO Kinases assay. Following the incubation of the purified enzyme, a substrate and ATP, the produced ADP was converted into ATP, which in turn was converted into light by Ultra-Glo Luciferase. The luminescent signal positively correlated with ADP amount and kinase activity. Briefly, the kinase reaction was performed by incubating 2.6 nM of the purified, commercially available human ALK5 (recombinant TGF (31 N-term GST-tagged, 80-end), a final concentration of TGF(31 peptide 94.5 μM (Promega, T36-58) and ultra-pure ATP (Promega V915B). The ATP concentration was set at the Km value (concentration of substrate which permits the enzyme to achieve half maximal velocity (Vmax)) of ALK5 (5 μM). All reactions/incubations were performed at 25° C. Compound and ALK5 kinase were mixed and incubated for 15 mins. Reactions were initiated by addition of ATP at a final concentration in the assay of 0.8301 After an incubation of 150 min, the reaction was stopped, and ADP production detected with ADP-Glo kit according to manufacturer's indications. CA Inhibition Assay An Applied Photophysics stopped-flow instrument has been used for assaying the CA catalysed CO2 hydration activity [Khalifah et al., J. Biol. Chem., 246:2561-2573]. Phenol red (at a concentration of 0.2 mM) has been used as indicator, working at the absorbance maximum of 557 nm, with 20 mM Hepes (pH 7.5) as buffer, and 20 mM Na2SO4 (for maintaining constant the ionic strength), following the initial rates of the CA-catalyzed CO2 hydration reaction for a period of 10-100 s. The CO2 concentrations ranged from 1.7 to 17 mM for the determination of the kinetic parameters and inhibition constants. For each inhibitor, at least six traces of the initial 5-10% of the reaction have been used for determining the initial velocity. The uncatalyzed rates were determined in the same manner and subtracted from the total observed rates. Stock solutions of inhibitor (0.1 mM) were prepared in distilled-deionized water and dilutions up to0.01 nM were done thereafter with distilled-deionized water. Inhibitor and enzyme solutions were preincubated together for 15 min at room temperature prior to assay, in order to allow for the formation of the E-I complex. Enzyme Inhibition Assay An SX.18MV-R Applied Photophysics (Oxford, UK) stopped-flow instrument has been used to assay the catalytic/inhibition of various CA isozymes as reported by Khalifah [Khalifah et al., J. Biol. Chem., 1:156-161]. Phenol Red (at a concentration of 0.2 mM) has been used as indicator, working at the absorbance maximum of 557 nm, with 10 mM Hepes (4-(2-hydroxyethyl)-1-piperazineethanesulfonic acid; pH 7.4) as buffer, 0.1 M Na2SO4 or NaClO4 (for maintaining constant the ionic strength; these anions are not inhibitory in the used concentration), following the CA-catalyzed CO2 hydration reaction for a period of 5-10 s. Saturated CO2 solutions in water at 25°C were used as substrate. Stock solutions of inhibitors were prepared at a concentration of 10 mM (in dimethyl sulphoxidewater 1:1, v/v) and dilutions up to 1 mM done with the assay buffer mentioned above. At least four different inhibitor concentrations have been used for measuring the inhibition constant. Inhibitor and enzyme solutions were preincubated together for 10 min at room temperature prior to assay, in order to allow for the formation of the E-I complex. Monoamine Oxidase Assays Assays were conducted in 96-well black plates with clear bottom (Corning) in a final volume of 100 μL. The assay buffer was 100 mM HEPES, pH 7.5. Each experiment was performed in triplicate within the same experiment. Briefly, a fixed amount of MAO (0.25 μg for MAO-A and 0.5 μg for MA-B) was incubated on ice for 15 minutes in the reaction buffer, in the absence and/or in the presence of various concentrations of inhibitor (e.g., from 0 to 50 μM, depending on the inhibitor strength). Tranylcypromine (Biomol International) was used as a control for inhibition. After leaving the enzyme(s) interacting with the inhibitor, 60 to 90 μM of kynuramine was added to each reaction for MAO-B and MAO-A assay respectively, and the reaction was left for 1 hour at 37° C. in the dark. The oxidative deamination of the substrate was stopped by adding 50 μL (v/v) of NaOH 2N. The conversion of kynuramine to 4-hydroxyquinoline, was monitored by fluorescence (excitation at 320 nm, emission at 360 nm) using a microplate reader (Infinite 200, Tecan). JAK/TYK2 Assay 10 mM test compound stock or 1 mM control compound stock (tofocitinib, ruxolitinib or staurosporine) in DMSO was diluted to 0.4 mM in DMSO. A 3-fold series dilution was then performed in DMSO to generate 10 different compound concentrations. The assay was carried out in 384-well white plate. 0.5 uL of 40× compound DMSO solution at different concentrations was mixed with 10 uL 2× enzyme prepared in reaction buffer (20 mM HEPES, 10 mM MgCl2, 0.01% Tween, 1 mM DTT, pH 7.5). 10 uL 2× substrate mixture prepared in reaction buffer was then added to start the reaction. A short spin was done to settle down all solutions to the bottom of the plate. Final concentrations of test compound in the reaction mixture were 10000, 3333, 1111, 370, 123, 41.2, 13.7, 4.57, 1.52 and 0.51 nM. Concentrations of control compound were ten times less. Enzymatic reaction was conducted at 25° C. for 1-2 hours. 10 uL of Kinase Glo Reagents was added to stop the reaction and generate the luminescent signal which was measured using Envision. TR-FRET (time-resolved fluorescence resonance energy transfer) assay In general, the assay is based on the interaction between N-terminally Six-Histidine-tagged-RORC2 ligand binding domain (6-His-RORC2 LBD), expressed in E. coli and purified by affinity chromatography, and biotin-coactivator peptide SRC1-2 (biotin-aminohexanoic acid-CPSSHSSLTERHKILHRLLQEGSPS-NH2; SEQ ID NO: 1) containing the LXXLL consensus domain which is responsible for receptor binding. This interaction is detected by addition of Europium labeled-anti-His antibody (Ex. 337 nm, Em. 620 nm, which binds to 6His) and Streptavidin-APC (Ex. 620 nm, Em. 665 nm, which binds to biotin). When receptor and coactivator are bound to each other, upon shining light at 337 nm on the sample, the Europium emits fluorescence that excites APC due to close proximity (FRET) and this signal is measured at 665 nm. Due to the long lasting fluorescence emission of Europium, the non-specific, short-lived fluorescence is time-resolved (TR) from the fluorescence of interest. Inhibitors of the interaction of receptor and coactivator peptide are detected by a decrease in TR-FRET signal. TbrPDEB1 Enzyme Assay In short, recombinant TbrPDEB1 and TbrPDEB2 were assayed in 10 mM Tris pH 7.4, bovine serum albumin (0.2 mg/mL), 10 mM MgCl2, 25µM cAMP (Enzo Lifesciences) and an excess of 5 endonucleotidase (>1000U) at 37 °C. Excess amount of 5 endonucleotidase was determined by titration (Enzo Lifesciences). Reactions were terminated by the addition of BioMol green (Enzo Lifesciences) which was also used to detect changes in the level of phosphate. This was measured by absorbance at 620 nm using a Tecan Sunrise plate reader. All screens were carried at a final concentration of 2% (v/v) DMSO and all IC50 experiments were carried out at 10% (v/v) DMSO. Inhibitors were preincubated with the assay mixture for 5 min prior to the addition of substrate. Inhibition was determined by the change in the initial velocity relative to a vehicle only control for both compound screening and for the determination of IC50 values. Initial velocity was determined by linear regression and IC50 values were calculated Biochemical Inhibition Assay The NAMPT Enzymatic Reaction. The NAMPT enzymatic reactions were carried out in Buffer A (50 mM Hepes pH 7.5, 50 mM NaCl, 5 mM MgCl2, and 1 mM THP) in 96-well V-bottom plates. The compound titrations were performed in a separate dilution plate by serially diluting the compounds in DMSO to make a 100x stock. Buffer A (89 uL) containing 33 nM of NAMPT protein was added to 1 uL of 100x compound plate containing controls (e.g. DMSO or blank). The compound and enzyme mixture was incubated for 15 min at rt, then 10 uL of 10x substrate and co-factors in Buffer A were added to the test well to make a final concentration of 1 uM NAM, 100 pM 5-Phospho-D-ribose 1-diphosphate (PRPP), and 2.5 mM Adenosine 5'-triphosphate (ATP). The reaction was allowed to proceed for 30 min at rt, then was quenched with the addition of 11 uL of a solution of formic acid and L-Cystathionine to make a final concentration of 1% formic acid and 10 uM L-Cystathionine. Background and signal strength was determined by addition (or non-addition) of a serial dilution of NMN to a pre-quenched enzyme and cofactor mix. Biochemical Inhibition Assay The NAMPT enzymatic reactions were carried out in Buffer A (50 mM Hepes pH 17.5, 50 mM NaCl, 5 mM MgCl2, and 1 mM THP) in 96-well V-bottom plates. The compound titrations were performed in a separate dilution plate by serially diluting the compounds in DMSO to make a 100× stock. Buffer A (89 μL) containing 33 nM of NAMPT protein was added to 1 μL of 100× compound plate containing controls (e.g. DMSO or blank). The compound and enzyme mixture was incubated for 15 min at room temperature, then 10 μL of 10× substrate and co-factors in Buffer A were added to the test well to make a final concentration of 1 μM NAM, 100 μM 5-Phospho-D-ribose 1-diphosphate (PRPP), and 2.5 mM Adenosine 5′-triphosphate (ATP). The reaction was allowed to proceed for 30 min at room temperature, then was quenched with the addition of 11 μL of a solution of formic acid and L-Cystathionine to make a final concentration of 1% formic acid and 10 μM L-Cystathionine Background and signal strength was determined by addition (or non-addition) of a serial dilution of NMN to a pre-quenched enzyme and cofactor mix. Biochemical Inhibition Assay The NAMPT enzymatic reactions were carried out in Buffer A (50 mM Hepes pH 7.5, 50 mM NaCl, 5 mM MgCl2, and 1 mM THP) in 96-well V-bottom plates. The compound titrations were performed in a separate dilution plate by serially diluting the compounds in DMSO to make a 100× stock. Buffer A (89 μL) containing 33 nM of NAMPT protein was added to 1 μL of 100× compound plate containing controls (e.g. DMSO or blank). The compound and enzyme mix was incubated for 15 minutes at room temperature, then 10 μL of 10× substrate and co-factors in Buffer A were added to the test well to make a final concentration of 1 μM NAM, 100 μM 5-Phospho-D-ribose 1-diphosphate (PRPP), and 2.5 mM Adenosine 5′-triphosphate (ATP). The reaction was allowed to proceed for 30 minutes at room temperature, then was quenched with the addition of 11 μL of a solution of formic acid and L-Cystathionine to make a final concentration of 1% formic acid and 10 μM L-Cystathionine. Background and signal strength was determined by addition (or non-addition) of a serial dilution of NMN to a pre-quenched enzyme and cofactor mix. CA Inhibition Assay An Applied Photophysics stopped-flow instrument has been used for assaying the CA catalysed CO2 hydration activity. Phenol red (at a concentration of 0.2 mM) has been used as an indicator, working at the absorbance maximum of 557 nm, with 20 mM Hepes (pH 7.5) as buffer, and 20 mM Na2SO4 (for maintaining constant the ionic strength), following the initial rates of the CA-catalyzed CO2 hydration reaction for a period of 10-100 s. The CO2 concentrations ranged from 1.7 to 17 mM for thedetermination of the kinetic parameters and inhibition constants19. For each inhibitor at least six traces of the initial 5-10% of the reaction have been used for determining the initial velocity. The uncatalyzed rates were determined in the same manner and subtracted from the total observed rates. Stock solutions of inhibitor (0.1 mM) were prepared in distilled-deionized water and dilutionsup to 0.01 nM were done thereafter with distilled deionized water. Inhibitor and enzyme solutions were preincubated together for 15 min-72 h at room temperature(15 min) or 4 °C (all other incubation times) prior to assay, in order to allow for the formation of the E-I complex or for the eventual active site mediated hydrolysis of the inhibitor. CA Inhibition Assay An Applied Photophysics stopped-flow instrument has been used for assaying the CA catalysed CO2 hydration activity. Phenol red (at a concentration of 0.2mM) has been used as indicator, working at the absorbance maximum of 557 nm, with 20 mM Hepes (pH 7.5) as buffer, and 20 mM Na2SO4 (for maintaining constant the ionic strength), following the initial rates of the CA-catalyzed CO2 hydration reaction [Khalifah et al., J. Biol. Chem., 246:2561-73] for a period of 10-100 s. The CO2 concentrations ranged from 1.7 to 17 mM for the determination of the kinetic parameters and inhibition constants. For each inhibitor at least six traces of the initial 5-10% of the reaction have been used for determining the initial velocity. The uncatalyzed rates were determined in the same manner and subtracted from the total observed rates. Stock solutions of inhibitor (0.1 mM) were prepared in distilled deionized water and dilutions up to 0.01nM were done thereafter with distilled-deionized water. Inhibitor and enzyme solutions were preincubated together for 15 min at room temperature prior to assay, in order to allow for the formation of the E-I complex (GTX3 was incubated also for longer periods, of 1-24 h, but no differences of activity have been detected). CA Inhibition Assay An applied photophysics stopped-flow instrument has been used for assaying the CA catalyzed CO2 hydration activity. Phenol red (at a concentration of 0.2 mM) has been used as indicator, working at the absorbance maximum of 557 nm, with 20mMHepes (pH 7.5) as buffer, and 20mM Na2SO4 (for maintaining constant the ionic strength), following the initial rates of the CA-catalyzed CO2 hydration reaction for a period of 10-100 s. The CO2 concentrations ranged from 1.7 to 17mM for the determination of the kinetic parameters and inhibition constants. For each inhibitor at least six traces of the initial 5-10% of the reaction have been used for determining the initial velocity. The uncatalyzed rates were determined in the same manner and subtracted from the total observed rates. Stock solutions of inhibitor (0.1mM) were prepared in distilled-deionized water and dilutions up to 0.01nM were done thereafter with distilled deionized water. Inhibitor and enzyme solutions were preincubated together for 15 min to 72 h at room temperature (15 min) or 4 °C (all other incubation times) prior to assay, in order to allow for the formation of the E-I complex or for the eventual active site mediated hydrolysis of the inhibitor. CA Inhibition Assay Phenol red (at a concentration of 0.2 mM) has been used as indicator, working at the absorbance maximum of 557 nm, with 10 mM Tris-HCl (pH 7.5) as buffer, 0.1 M Na2SO4 (for maintaining constant the ionic strength), at 25°C, following the CA-catalyzed CO2-hydration reaction for a period of 10-80 s (the uncatalyzedreaction needs around 60-100 s in the assay conditions, whereas the catalyzed ones are of around 6-10 s). The CO2 concentrations ranged from 1.7 to 17 mM for thedetermination of kinetic parameters. For each inhibitor, tested in the concentration range between 0.01 and 100 μM, at least six traces of the initial 5-10% of the reaction have been used for determining the initial velocity. The uncatalyzed rates were determined in the same manner and subtracted from the total observed rates. Stock solutions of inhibitor (1 mM) were prepared in distilled-deionized water with 10-20% (v/v) dimethyl sulfoxide (which is not inhibitory at these concentrations), and dilutions up to 0.001 μM were done thereafter with distilled-deionized water. Inhibitor and enzyme solutions were preincubated together for 15 min at room temperature prior to assay in order to allow for the formation of the E-I complex. Carbonic Anhydrase I, II, IV and XII Assay An Applied Photophysics stopped-flow instrument has been used for assaying the CA catalysed CO2 hydration activity [Khalifah et al., J. Biol. Chem., 246:2561-2573]. Phenol red (at a concentration of 0.2 mM) has been used as indicator, working at the absorbance maximum of 557 nm, with 10-20 mM Hepes (pH 7.5) as buffer, and 20 mM Na2SO4 (for maintaining constant the ionic strength), following the initial rates of the CA-catalyzed CO2 hydration reaction for a period of 10-100 s. The CO2 concentrations ranged from 1.7 to 17 mM for the determination of the kinetic parameters and inhibition constants. For each inhibitor at least six traces of the initial 5-10% of the reaction have been used for determining the initial velocity. The uncatalyzed rates were determined in the same manner and subtracted from the total observed rates. Stock solutions of inhibitor (10 mM) were prepared in distilled-deionised water and dilutions up to 0.01 nM were done thereafter with distilled-deionised water. Inhibitor and enzyme solutions were preincubated together for 15 min at room temperature prior to assay, in order to allow for the formation of the E-I complex. Enzymatic Reaction Assay The NAMPT enzymatic reactions were carried out in Buffer A (50 mM Hepes pH 7.5, 50 mM NaCl, 5 mM MgCl2, and 1 mM THP) in 96-well V-bottom plates. The compound titrations were performed in a separate dilution plate by serially diluting the compounds in DMSO to make a 100× stock. Buffer A (89 μL) containing 33 nM of NAMPT protein was added to 1 μL of 100× compound plate containing controls (e.g. DMSO or blank). The compound and enzyme mixture was incubated for 15 min at rt, then 10 μL of 10× substrate and co-factors in Buffer A were added to the test well to make a final concentration of 1 μM NAM, 100 μM 5-Phospho-D-ribose 1-diphosphate (PRPP), and 2.5 mM Adenosine 5′-triphosphate (ATP). The reaction was allowed to proceed for 30 min at rt, then was quenched with the addition of 11 μL of a solution of formic acid and L-Cystathionine to make a final concentration of 1% formic acid and 10 μM L-Cystathionine. Background and signal strength was determined by addition (or non-addition) of a serial dilution of NMN to a pre-quenched enzyme and cofactor mix. LSD1 Assay Briefly, a fixed amount of LSD1 was incubated on ice for 15 minutes, in the absence and/or in the presence of various concentrations of inhibitor (e.g., from 0 to 75 μM, depending on the inhibitor strength). Tranylcypromine (Biomol International) was used as a control for inhibition. Within the experiment, each concentration of inhibitor was tested in triplicate. After leaving the enzyme interacting with the inhibitor, 12.5 μM of di-methylated H3-K4 peptide was added to each reaction and the experiment was left for 1 hour at 37° C. in the dark. The enzymatic reactions were set up in a 50 mM sodium phosphate, pH 7.4 buffer. At the end of the incubation, Amplex Red reagent and horseradish peroxidase (HPR) solution were added to the reaction according to the recommendations provided by the supplier (Invitrogen), and left to incubate for 30 extra minutes at room temperature in the dark. A 1 μM H2O2 solution was used as a control of the kit efficiency. The conversion of the Amplex Red reagent to resorufin due to the presence of H2O2 in the assay, was monitored by fluorescence (excitation at 540 nm, emission at 590 nm) using a microplate reader (Infinite 200, Tecan). Monoamine Oxidase Assays Briefly, a fixed amount of MAO (0.25 μg for MAO-A and 0.5 μg for MAO-B) was incubated on ice for 15 minutes in the reaction buffer, in the absence and/or in the presence of various concentrations of inhibitor (e.g., from 0 to 50 μM, depending on the inhibitor strength). Tranylcypromine (Biomol International) was used as a control for inhibition. After leaving the enzyme(s) interacting with the inhibitor, 60 to 90 μM of kynuramine was added to each reaction for MAO-B and MAO-A assay respectively, and the reaction was left for 1 hour at 37° C. in the dark. The oxidative deamination of the substrate was stopped by adding 50 μL (v/v) of NaOH 2N. The conversion of kynuramine to 4-hydroxyquinoline, was monitored by fluorescence (excitation at 320 nm, emission at 360 nm) using a microplate reader (Infinite 200, Tecan). Arbitrary units were used to measure levels of fluorescence produced in the absence and/or in the presence of inhibitor. The maximum of oxidative deamination activity was obtained by measuring the amount of 4-hydroxyquinoline formed from kynuramine deamination in the absence of inhibitor and corrected for background fluorescence in the absence of MAO enzymes. Monoamine Oxidase Assays Briefly, a fixed amount of MAO (0.25 μg for MAO-A and 0.5 μg for MAO-B) was incubated on ice for 15 minutes in the reaction buffer, in the absence and/or in the presence of various concentrations of inhibitor (e.g., from 0 to 50 μM, depending on the inhibitor strength). Tranylcypromine (Biomol International) was used as a control for inhibition.After leaving the enzyme(s) interacting with the inhibitor, 60 to 90 μM of kynuramine was added to each reaction for MAO-B and MAO-A assay respectively, and the reaction was left for 1 hour at 37° C. in the dark. The oxidative deamination of the substrate was stopped by adding 50 μL (v/v) of NaOH 2N. The conversion of kynuramine to 4-hydroxyquinoline, was monitored by fluorescence (excitation at 320 nm, emission at 360 nm) using a microplate reader (Infinite 200, Tecan). Arbitrary units were used to measure levels of fluorescence produced in the absence and/or in the presence of inhibitor.The maximum of oxidative deamination activity was obtained by measuring the amount of 4-hydroxyquinoline formed from kynuramine deamination in the absence of inhibitor and corrected for background fluorescence in the absence of MAO enzymes. Enzymatic Activity Assay The enzymatic activity of compounds of the present invention was monitored measuring the formation of ADP using the ADP-GLO Kinases assay. Following the incubation of the purified enzyme, a substrate and ATP, the produced ADP was converted into ATP, which in turn was converted into light by Ultra-Glo Luciferase. The luminescent signal positively correlated with ADP amount and kinase activity. Briefly, the kinase reaction was performed by incubating 2.6 nM of the purified, commercially available human ALK5 (recombinant TGF β1 N-term GST-tagged, 80-end), a final concentration of TGFβ1 peptide 94.5 μM (Promega, T36-58) and ultra-pure ATP (Promega V915B). The ATP concentration was set at the Km value (concentration of substrate which permits the enzyme to achieve half maximal velocity (Vmax)) of ALK5 (5 μM). All reactions/incubations were performed at 25° C. Compound and ALK5 kinase were mixed and incubated for 15 mins. Reactions were initiated by addition of ATP at a final concentration in the assay of 0.83 μM. After an incubation of 150 min, the reaction was stopped, and ADP production detected with ADP-Glo kit according to manufacturer's indications. The assay was performed in 384-well format and was validated using a selection of reference compounds that was tested in 11 point concentration-response curve. Enzyme Activity Assay Assay details: A SARS-Cov-2 Mpro construct was prepared, which includes a His-tag and PreScission cleavage site (see FIG. 3A). The construct was transformed into E. coli and the enzyme was isolated using Ni2+-affinity chromatography. The C-terminal His tag was cleaved by PreScission and the N-term was autocleaved by the protease itself. The protein was further purified by FPLC and purity was assessed by gel electrophoresis and Coomassie staining. The enzymatic activity of purified SARS-CoV-2 Mpro was tested using a dabcyl-KTSAVLQ↓SGFRKME(Edans)-NH2 substrate (GL Biochem) by monitoring at em 460 nm with ex 360 nm (the assay is schematically shown in FIG. 3B, adapted from Kasperkeiwicz et al., FEBS J, 284 (10), 1518-1539). Initial velocities were determined from the linear portion of the kinetic curve. As a quality control measure, the Km and kcat of purified SARS-CoV-2 Mpro were compared to published values and only preparations that show similar activity were used in the activity assay. SARS-CoV-2 Mpro was incubated with a test compound for 20 minutes prior to addition of substrate. Compounds were tested at 17 μM in duplicates. For each tested compound, assay results were reported as % fluorescence generated by initial enzyme activity (initial enzyme activity in the absence of test compound). In Vitro Assay The enzymatic activity of compounds of the present invention was monitored measuring the formation of ADP using the ADP-GLO Kinases assay. Following the incubation of the purified enzyme, a substrate and ATP, the produced ADP was converted into ATP, which in turn was converted into light by Ultra-Glo Luciferase. The luminescent signal positively correlated with ADP amount and kinase activity. Briefly, the kinase reaction was performed by incubating 2.6 nM of the purified, commercially available human ALK5 (recombinant TGF 31 N-term GST-tagged, 80-end), a final concentration of TGFβ1 peptide 94.5 μM (Promega, T36-58) and ultra-pure ATP (Promega V915B). The ATP concentration was set at the Km value (concentration of substrate which permits the enzyme to achieve half maximal velocity (Vmax)) of ALK5 (5 μM). All reactions/incubations were performed at 25° C. Compound and ALK5 kinase were mixed and incubated for 15 mins. Reactions were initiated by addition of ATP at a final concentration in the assay of 0.83p M. After an incubation of 150 min, the reaction was stopped, and ADP production detected with ADP-Glo kit according to manufacturer's indications. The assay was performed in 384-well format and was validated using a selection of reference compounds that was tested in 11 point concentration-response curve. ligand sensing assay (LiSA) As used herein, reference to the activity of an LXR agonist at LXRα and LXRβ refer to the activity as measured using the ligand sensing assay (LiSA) described in Spencer et al. Journal of Medicinal Chemistry 2001, 44, 886-897, incorporated herein by reference. In some embodiments, the LXR agonist has an EC50 of less than 1 μM in the ligand sensing assay (e.g., 0.5 nm to 500 nM, 10 nM to 100 nM). For example, the methods of the invention can be performed using an LXRβ agonist having activity for LXRβ that is at least 3-fold greater than the activity of the agonist for LXRα, or having activity for LXRβ that is at least 10-fold greater than the activity of the agonist for LXRα, or having activity for LXRβ that is at least 100-fold greater than the activity of said agonist for LXRα, or having activity for LXRβ that is at least within 3-fold of the activity of the agonist for LXRα. The term greater activity in the LiSA assay assay refers to a lower EC50. For example, GW3965 2 has approximately 6-fold greater activity for LXRβ (EC50=30) compared to LXRα (EC50=190). Biochemical Assay Briefly, a fixed amount of LSD1 was incubated on ice for 15 minutes, in the absence and/or in the presence of various concentrations of inhibitor (e.g., from 0 to 75 μM, depending on the inhibitor strength). Tranylcypromine (Biomol International) was used as a control for inhibition. Within the experiment, each concentration of inhibitor was tested in triplicate. After leaving the enzyme interacting with the inhibitor, 12.5 μM of di-methylated H3-K4 peptide was added to each reaction and the experiment was left for 1 hour at 37° C. in the dark. The enzymatic reactions were set up in a 50 mM sodium phosphate, pH 7.4 buffer. At the end of the incubation, Amplex Red reagent and horseradish peroxidase (HPR) solution were added to the reaction according to the recommendations provided by the supplier (Invitrogen), and left to incubate for 30 extra minutes at room temperature in the dark. A 1 μM H2O2 solution was used as a control of the kit efficiency. The conversion of the Amplex Red reagent to resorufin due to the presence of H2O2 in the assay, was monitored by fluorescence (excitation at 540 nm, emission at 590 nm) using a microplate reader (Infinite 200, Tecan). Arbitrary units were used to measure level of H2O2 produced in the absence and/or in the presence of inhibitor. CO2 Hydration Assay An applied photophysics stopped flow instrument has been used for assaying the CA-catalyzed CO2 hydration activity [Khalifah et al., J. Biol. Chem., 246:2561-2573]. Phenol red (at a concentration of 0.2 mM) has been used as indicator, working at the absorbance maximum of 557 nm, with 20 mM Hepes (pH 7.5) as buffer, and 20 mM Na2SO4 (for maintaining constant the ionic strength), following the initial rates of the CA-catalyzed CO2 hydration reaction for a period of 10-100 s. The CO2 concentrations ranged from 1.7 to 17 mM for the determination of the kinetic parameters and inhibition constants. For each inhibitor at least six traces of the initial 5-10% of the reaction have been used for determining the initial velocity, in triplicate measurements. The uncatalyzedrates were determined in the same manner and subtracted from the total observed rates. Stock solutions of inhibitor (0.1 mM) were prepared in distilled-deionizedwater and dilutions up to 0.01 nM were done thereafter with distilled-deionized water. Inhibitor and enzyme solutions were preincubated together for 15 min at room temperature prior to assay, in order to allow for the formation of the E-I complex [Maresca et al., Bioorg. Med. Chem. Lett., 21:1334-1337; Khalifah et al., J. Biol. Chem., 246:2561-2573; Park et al., Tetrahedron, 59:7651-7676]. Enzyme Activity Assay The object of this test is to detect the in vitro inhibitory activity of the compound against HER1 (ErbB1), HER2 (ErbB2) and HER4 (ErbB4). The enzymes used in this test were human ErbB1, ErbB2 and ErbB4. Eurofins Pharma Discovery Service provided the activity detection method, and the results of the inhibitory activity of the tested compound against HER1, HER2 and HER4 were shown in Table 1.Experimental Steps and Methods (96-Well Plate):5-fold diluted tested compound buffer (5 μL), peptide substrate poly(Glu, Tyr) (4:1) (2.5 μL), ErbB (4-20 ng, 2.5 μL), MnCl2 (50 mM, 1.25 μL), dH2O (3.75 μL) and [γ-33P]ATP (10 μL) were added, and incubated at 30° C. for 10 min. 3% phosphoric acid was added to terminate the reaction, and 10 μL of the specimen was transferred to Filtermate A. The filter was washed with 75 mM phosphoric acid for three times and methanol once, and transferred to a sealed plastic bag, and a scintillation fluid mixture (4 mL) was added, The intensity of the emitted photons was detected on the scintillation luminescence counter. The photon intensity of the enzyme sample was compared with the photon intensity of the internal control sample, and the level of photon intensity reflected the strength of the tyrosine kinase activity. MAOA and MAOB In Vitro Activity Assay Principle: A specific luciferin derivative was used as a substrate. MAOA or MAOB can catalyze the conversion of substrate to luciferin methyl ester. The product luciferin methyl ester can produce fluorescent light under the action of luciferase, so that the activity of MAOA or MAOB can be reflected by the intensity of the fluorescent signal. Meanwhile, a blank control was set to determine the strength of the enzyme activity. Tranylcypromine was used as a positive inhibitor in the experiment.Sample treatment: The sample was dissolved in DMSO, and stored at low temperature. The concentration of DMSO in the final system was controlled to a range which would not affect the determined activity.In the initial screening, the activity of the sample was tested at a single concentration, for example 100 μM. For samples exhibiting activity under certain conditions, for example, the inhibition rate % Inhibition is greater than 50, the active dose-dependent relationship, i.e., the IC50 value was obtained by nonlinearly fitting the activity of the sample vs the concentration of the sample, and the software used for the calculation was Graphpad Prism 5. The model used for fitting was sigmoidal dose-response (varible slope), and for most inhibitor screening models, the bottom and top of the fitted curve were set to 0 and 100. Chamber Electrophysiology Assay of CFTR Potentiation in CF Bronchial Epithelial Cells Primary cystic fibrosis human bronchial epithelial (CF hBE) cells were expanded and cultured according to published methods (Neuberger et al., Ch. 4 of Cystic Fibrosis, Methods in Molecular Biology vol. 741, pp. 39-54 (2011)). Well-differentiated cells (>30 days at air/liquid interface) on Snapwell filters (Corning Costar, cat. no. 3801) were mounted in Ussing chambers (Physiologic Instruments, Inc., San Diego, Calif.). F508del/F508del cultures were assayed at 27° C. and G551D/F508del cells were assayed at 35° C. HEPES buffered physiological saline (composition (in mM): 137 NaCl, 4 KCl, 1 MgCl2, 1.8 CaCl2, 10 HEPES Na) was used in both apical and basolateral chambers. Chambers were bubbled with air to promote mixing and the voltage was clamped to zero. Amiloride (30 uM), forskolin (10 uM), test compound (4 increasing concentrations), and CFTRinh-172 (20 uM) were added sequentially with 20-25 minutes between additions. Short-circuit currents were acquired and analyzed using LabScribe2. Test compound responses were scaled relative to responses for DMSO (0%) and the maximal response of a positive control potentiator (100%). TR-FRET Assay Kinase reaction conditions:400 nM GFP-4E-BP1, 8 uM ATP, -150 ng/mL mTOR, 50 mM HEPES pH 7.5, 0.01% Polysorbate 20, 1 mM EGTA, 10 mM MnC12, and variable amounts of test compounds.Preparation of Reagents:Note: Thaw and keep mTOR, the substrate, ATP, and the antibody on ice prior to making working dilutions. Working dilutions of these components can be kept at room temperature for short periods of time the day of use.1. Add 2 ml of 5X Assay Buffer to 8 ml water to prepare 10 ml of IX Assay Buffer. Note: The concentration of IX Assay Buffer is 50 mM HEPES pH 7.5, 0.01% Polysorbate 20, 1 mM EGTA, and 10 mM MnC12.2. Prepare Antibody/EDTA Solution by first adding 2.75 ul of Tb-anti p4E-BPl Antibody to 2397 ul of LanthaScreenTM TR-FRET Dilution Buffer. Then, add 100 ul of 0.5 M EDTA. 3. Prepare 4X Substrate/Enzyme Solution by first adding 72 ul of GFP-4E-BP1 (22 uM) to 926 ul of IX Assay Buffer. Then, add 1.6 ul of mTOR (0.45 mg/mL). 4. Biochemical Activity ACSS2 Assay The assay was performed in Perkin Elmer 384 well white Proxiplates in a total volume of 8 μl. 1 nM (fc)C-term myc tagged ACSS2 (human, recombinant, Origene, Rockville, US) and a mixture of 100 μM (fc) ATP, 100 μM (fc) Coenzyme A and 500 μM (fc) sodium acetate were incubated in a total volume of 5 μl (50 mM Hepes, 1 mM Mg-chloride, 150 mM NaCl, 1 mM DTT, 0.01% (w/v) BSA, 0.3% DMSO, pH 7.5) in the absence or presence of the test compound (10 dilution concentrations, start conc 30 μM) for 180 min at 37 C. The reaction was stopped and residual ATP destroyed by the addition of 1 μl AMP Glo reagent solution (Promega, Madison, US). After 1h incubation at room temperature 2 μl of AMP Glo detection reagent was added and the assay was incubated for 0.75 hr at room temperature. The luminescence signal was measured with an Envision multimode reader (Perkin Elmer LAS Germany GmbH) at 700 nm in luminescence mode. The full value used was the inhibitor-free reaction. The pharmacological zero value was generated by addition of ACSS2 inhibitor (Ac-CoA Synthase Inhibitor CAS 508186-14-9-Calbiochem) in a final concentration of 5 μM. The inhibitory values (IC50) were determined using the program Assay Analyzer from GeneData. Enzymology Assay 1. Experimental materials and instrumentsPDE9A2 Enzyme (BPS, Cat. No. 60090)384-well plate (Perkin Elmer, Cat. No. 6007279)2. Experimental procedurePreparation of the compounds: the compounds were prepared into 10 mM compound stock solution in DMSO for long-term storage. The obtained compound stock solution was diluted in 100 times with DMSO to obtain 100 μM compound working mother solution, and then the compound working mother solution was diluted in 3 times with DMSO to obtain 8-10 concentration gradients of diluted compound mother liquor (100×).Incubation with the compounds: A very small amount of liquid pipetting system Echo was used to pipette the diluted compound mother liquor into a 384-well plate. 200 nL diluted compound mother liquor and 10 μL PDE9A2 enzyme solution were added to each compound well. After centrifugation at 1000 rpm for 1 min, the mixture was incubated for 15 min at the room temperature. Then the 10 μL substrate mixture was added. After centrifugation at 1000 rpm for 1 min, the mixture was incubated with shocking for 30 min at the room temperature. Finally, a stop solution was added to end the reaction system. The mixture was incubated with shocking for 60 min at the room temperature. In the maximum reading hole (Max), the compound was replaced by solvent. In the minimum reading hole (Min), the compound and enzyme solution were replaced by solvent. Biological Assay Briefly, a fixed amount of LSD1 was incubated on ice for 15 minutes, in the absence and/or in the presence of at least eight 3-fold serial dilutions of the respective test compound (e.g., from 0 to 75 μM, depending on the inhibitor strength). Tranylcypromine (Biomol International) was used as a control for inhibition. Within the experiment, each concentration of inhibitor was tested in duplicate. After leaving the enzyme interacting with the inhibitor, KM of di-methylated H3-K4 peptide was added to each reaction and the experiment was left for 30 minutes at 37° C. in the dark. The enzymatic reactions were set up in a 50 mM sodium phosphate, pH 7.4 buffer. At the end of the incubation, Amplex Red reagent and horseradish peroxidase (HPR) solution were added to the reaction according to the recommendations provided by the supplier (Invitrogen), and left to incubate for 5 extra minutes at room temperature in the dark. A 1 μM H2O2 solution was used as a control of the kit efficiency. The conversion of the Ampiex Red reagent to resorufin due to the presence of H2O2 in the assay, was monitored by fluorescence (excitation at 540 nm, emission at 590 nm) using a microplate reader (Infinite 200, Tecan). Arbitrary units were used to measure level of H2O2 produced in the absence and/or in the presence of inhibitor. CA Inhibition Assay An Applied Photophysics stopped-flow instrument has been used for assaying the CA catalysed CO2 hydration activity Khalifah RG. The carbon dioxide hydration activity of carbonic anhydrase. I. Stop-flow kinetic studies on the native human isoenzymes B and C. J Biol Chem 1971;246:2561-2573.Phenol red (at a concentration of 0.2 mM) has been used as indicator, working at the absorbance maximum of 557 nm, with 10-20 mM Hepes (pH 7.5, for α-CAs) or TRIS (pH 8.3 for β-CAs) as buffers, and 20 mM Na2SO4 (for α-CAs) or 20 mM NaBF4 for β-CAs (for maintaining constant the ionic strength), following the initial rates of the CA-catalyzed CO2 hydration reaction for a period of 10-100 s. The CO2 concentrations ranged from 1.7 to 17 mM for the determination of the kinetic parameters and inhibition constants. For each inhibitor, at least six traces of the initial 5%-10% of the reaction have been used for determining the initial velocity. The uncatalyzed rates were determined in the same manner and subtracted from the total observed rates. Stock solutions of inhibitor (10 mM) were prepared in distilled-deionized water and dilutions up to 0.01 nM were done thereafter with distilled-deionized water. Inhibitor and enzyme solutions were preincubated together for 15 min at room temperature prior to assay, in order to allow for the formation of the E-I complex. CA Inhibition Assay An Applied Photophysics stopped-flow instrument has been used for assaying the CA catalysed CO2 hydration activity [Khalifah et al., J. Biol. Chem., 246:2561-2573]. Phenol red (at a concentration of 0.2 mM) has been used as indicator, working at the absorbance maximum of 557 nm, with 10-20 mM Hepes (pH 7.5, for α-CAs) or TRIS (pH 8.3 for β-CAs) as buffers, and 20 mM Na2SO4 (for α-CAs) or 20 mM NaCl− for β-CAs (for maintaining constant the ionic strength), following the initial rates of the CA-catalyzed CO2 hydration reaction for a period of 10-100 s. The CO2 concentrations ranged from 1.7 to 17 mM for the determination of the kinetic parameters and inhibition constants. For each inhibitor, at least six traces of the initial 5-10% of the reaction have been used for determining the initial velocity. The uncatalyzed rates were determined in the same manner and subtracted from the total observed rates. Stock solutions of inhibitor (10 mM) were prepared in distilled-deionized water and dilutions up to 0.01 nM were done thereafter with distilled-deionized water. Inhibitor and enzyme solutions were preincubated together for 15 min at room temperature prior to assay, in order to allow for the formation of the E-I complex. The inhibition constants were obtained by nonlinear least-square methods using PRISM 3, whereas the kinetic parameters for the uninhibited enzymes from Lineweaver-Burk plots, as reported earlier. CA Inhibition Assay An Applied Photophysics stopped-flow instrument has been used for assaying the CA catalyzed CO2 hydration activity [Khalifah et al., J. Biol. Chem., 246:2561-73]. Phenol red (at a concentration of 0.2 mM) has been used as an indicator, working at the absorbance maximum of 557 nm, with 20 mM Hepes (pH 7.4 for hCA I and II) or with 20 mM Tris (pH 8.4, for ScCA) as buffers, and 20 mM NaClO4 (for maintaining constant the ionic strength), following the initial rates of the CA-catalyzed CO2 hydration reaction for a period of 10-100 s. The CO2 concentrations ranged from 1.7 to 17 mM for the determination of the kinetic parameters and inhibition constants. For each inhibitor at least six traces of the initial 5%-10% of the reaction have been used for determining the initial velocity. The uncatalyzed rates were determined in the same manner and subtracted from the total observed rates. Stock solutions of inhibitor (10 mM) were prepared in distilled-deionized water and dilutions up to 0.001 nM were done thereafter with the assay buffers. Inhibitor and enzyme solutions were preincubated together for 15 min at room temperature prior to assay, in order to allow for the formation of the E-I complex. The concentration of the enzymes in the assays was of 8.0 nM for hCA I, of 5.9nM for hCA II and of 12.5 nM for ScCA, respectively. CA Inhibition Assay An Applied Photophysics stopped-flow instrument has been used for assaying the CA-catalyzed CO2 hydration activity [Khalifah et al., J. Biol. Chem., 246:2561-2573]. Phenol red (at a concentration of 0.2 mM)has been used as indicator, working at the absorbance maximum of 557 nm with 10-20 mM Hepes (pH 7.5, for α-CAs) or TRIS (pH 8.3 for β-CAs) as buffers, and20 mM Na2SO4 (for α-CAs) or 20 mM NaCl for β-CAs (for maintaining constant the ionic strength), following the initial rates of the CA-catalyzed CO2 hydration reaction for a period of 10-100 s. The CO2 concentrations ranged from 1.7 to 17 mM for the determination of the kinetic parameters and inhibition constants. For each inhibitor, at least six traces of the initial 5-10% of the reaction have been used for determining the initial velocity. The uncatalyzed rates were determined in the same manner and subtracted from the total observed rates. Stock solutions of inhibitor (10 mM) were prepared in distilled deionized water and dilutions up to 0.01 nM were done thereafter with distilled-deionized water. Inhibitor andenzyme solutions were preincubated together for 15 min at room temperature prior to assay in order to allow for the formation of the E-I complex. The inhibition constants were obtained by non-linear least-squares methods using PRISM 3, whereas the kinetic parameters for the uninhibited enzymes from Lineweaver-Burk plots,as reported earlier. In Vitro Activity Assay DYRK1A assay. Substrate, HT-PRD (Proline rich domain, residues 746-864 of dynamin 1a, prepared as N-terminal tagged 6×His fusion protein), was diluted in dilution buffer (25 mM Tris-HCl, pH 7.4 and 100 mM NaCl) to a concentration of 2 ng/μl or higher and used to coat a 96-well plate (BD Falcon #353072) with 100 μl per well (200 ng/well unless otherwise indicated) at 4° C. overnight. Unbound materials were washed away with dilution buffer and wells were blocked with 150 μl blocking buffer (2% BSA, 1×PBS, and 0.25% Tween 20) at room temperature for 60 min. After blocking, wells were washed extensively with dilution buffer before subjecting to phosphorylation. DYRK1A phosphorylation was performed in wells with 100 μl reaction mix containing 25 mM HEPES, pH7.4, 100 mM NaCl, 5 mM MgCl2, 100 UM ATP (Sigma-Aldrich Chemicals), inhibitor if needed, and 5 ng HT-497 (6×His tagged rat truncated DYRK1A isoform X1 containing residues 1-497). Reactions were initiated by adding HT-497 and continued for 30 min (unless otherwise indicated) at 30° C. At the end point, wells were washed with 350 μl dilution buffer three times to terminate the reaction. A set of inhibition experiments typically consisted of a no-inhibitor control plus a series of eight inhibitor concentrations in the range of 0.000625 UM-100 μM (final) depending on the strength of inhibitor. LSD1 in vitro activity assay Principle: LSD1 specifically removes the methylation modification at K4 lysine on H3 polypeptide substrate, making it a substrate without methylation. The method employed histone H3 methylated polypeptide (1-24) as a substrate and introduces a biotin label in the C segment of the substrate. When LSD1 was initiated with the participation of FAD, the methylation modification on the substrate H3K4 can be removed. The Eu-labeled H3K4 background antibody binded to the substrate by antigen-antibody reaction, while the streptavidin-labeled receptor binded together by the specific interaction of streptavidin and biotin, thereby the Eu-labeled donor interacting with the streptavidin-labeled receptor. In fluorescence resonance energy transfer, when two fluorophores were brought close due to biomolecular interaction, part of the energy captured by the cryptate when excited would be released, the emission wavelength of which is 620 nm; the other part of the energy was transferred to the acceptor, the emission wavelength of which is 665 nm. The 665 nm emission can only produce by FRET caused by the donor. Therefore, when biomolecules interact, there were two excited lights at 620 nm and 665 nm; when there was no interaction, there was only one excited light at 620 nm. The LSD1 demethylation activity can be reflected by detecting the ratio between the fluorescence signals at the two emission wavelengths of 665 nm and 620 nm. Meanwhile, a blank control was set to determine the strength of the enzyme activity. TR-FRET Assay In this assay, a GST-tagged human RORγ ligand binding domain (GST-hRORγ-LBD) interacts with a synthetic biotinylated TRAP220 cofactor peptide containing an LXXLL motif (amino acids 631-655 from NP_004765). The ligand-binding domain (LBD) of RORγ is expressed as fusion protein with GST in BL-21 (BL3) cells using the vector pDEST15. Cells are lysed by lysozyme-treatment and sonication, and the fusion proteins purified over glutathione sepharose (Pharmacia) according to the manufacturers instructions. The strong constitutive interaction is disrupted upon binding of functional antagonists. The strength of the interaction is monitored by TR-FRET between streptavidine APC interacting with the biotinylated peptide and Europium-labelled Anti-GST. 6 μl RORγ-LBD-GST solution (final 8.7 nM) in assay buffer (20 mM Tris-HCl, pH 6.8, 5 mM MgCl2, 60 mM KCl, 0.1% delipidated BSA, 1 mM DTT) are dispensed into black 384 well small volume plates (Greiner #784076). 6 μl TRAP220 peptide (final 400 nM), SA-APC (final 1.6 ng/μl), Eu-anti-GST (final 0.125 ng/μl) in assay buffer and 2 μl test compounds (DMSO stocks prediluted in 20 mM Tris-HCl, pH 6.8, 5 mM MgCl2, 60 mM KCl) are added and the mixture incubated 60 min at RT in the dark before measuring FRET (excitation 337 nm, emission at 615 and 665 nm). GPR17 cAMP Assay Protocol GPR17 cAMP Assay Protocol: CHO-K1 cells stably expressing vector containing untagged human GPR17 short isoform (Roche) were cultured at 37° C./5% CO2 in DMEM (Dulbecco's Modified Eagle Medium):F-12 (1:1) supplemented with 10% foetal bovine serum and 400 μg/ml Geneticin. Changes in intracellular cyclic adenosine monophosphate (cAMP) levels were quantified using the Nano-TRF Detection Assay kit (Roche Diagnostics, Cat. No. 05214386001). This assay allows for direct cAMP quantification in a homogeneous solution, cAMP is detected based on time-resolved fluorescence energy transfer (TR-FRET) and competitive binding of ruthenylated cAMP and endogenous cAMP to an anti-cAMP monoclonal antibody labeled with AlexaFluor-700. The Ruthenium complex serves as the FRET donor and transfers energy to AlexaFluor-700. The FRET signal is inversely proportional to the cAMP concentration. CHO-GPR17S cells were detached with Accutase and resuspended in assay buffer consisting of Hank's Balanced Salt Solution (HBSS), 10 mM HEPES (4-(2-hydroxyethyl) piperazine-1-ethanesulfonic acid solution) and 0.1% bovine serum albumin (pH 7.4). The cells were seeded in black 384-well plates (Corning) at a density of 10,000 cells/20 μl assay buffer until the addition of compounds. JAK/TYK2 Assay 10 mM test compound stock or 1 mM control compound stock (tofocitinib, ruxolitinib or staurosporine) in DMSO was diluted to 0.4 mM in DMSO. A 3-fold series dilution was then performed in DMSO to generate 10 different compound concentrations. The assay was carried out in 384-well white plate. 0.5 uL of 40× compound DMSO solution at different concentrations was mixed with 10 uL 2× enzyme prepared in reaction buffer (20 mM HEPES, 10 mM MgCl2, 0.01% Tween, 1 mM DTT, pH 7.5). 10 uL 2× substrate mixture prepared in reaction buffer was then added to start the reaction. A short spin was done to settle down all solutions to the bottom of the plate. Final concentrations of test compound in the reaction mixture were 10000, 3333, 1111, 370, 123, 41.2, 13.7, 4.57, 1.52and 0.51 nM. Concentrations of control compound were ten times less. Enzymatic reaction was conducted at 25° C. for 1-2 hours. 10 uL of Kinase Glo Reagents was added to stop the reaction and generate the luminescent signal which was measured using Envision. Luminescence signal was inversely related to kinase activity. Reaction mixture which did not contain enzyme served as negative control. The mixture without any compound was the positive control. TR-FRET The activity of compound of the invention can be determined by a co-activator recruitment by TR-FRET (time-resolved fluorescence resonance energy transfer) assay. In general, the assay is based on the interaction between N-terminally Six-Histidine-tagged-RORC2 ligand binding domain (6-His-RORC2 LBD), expressed in E. coli and purified by affinity chromatography, and biotin-coactivator peptide SRC1-2 (biotin-aminohexanoic acid-CPSSHSSLTERHKILHRLLQEGSPS-NH2; SEQ ID NO: 1) containing the LXXLL (SEQ ID NO: 2) consensus domain which is responsible for receptor binding. This interaction is detected by addition of Europium labeled-anti-His antibody (Ex. 337 nm, Em. 620 nm, which binds to 6His) and Streptavidin-APC (Ex. 620 nm, Em. 665 nm, which binds to biotin). When receptor and coactivator are bound to each other, upon shining light at 337 nm on the sample, the Europium emits fluorescence that excites APC due to close proximity (FRET) and this signal is measured at 665 nm. Due to the long lasting fluorescence emission of Europium, the non-specific, short-lived fluorescence is time-resolved (TR) from the fluorescence of interest. Inhibitors of the interaction of receptor and coactivator peptide are detected by a decrease in TR-FRET signal. Cell-Free Assay Beta-secretase (BACE) is one of the enzymes involved in the generation of the amyloid beta peptide found in the amyloid plaques of Alzheimer's Disease patients. This assay measures the inhibition of the beta-secretase enzyme as it cleaves a non-native peptide.A synthetic APP substrate that can be cleaved by beta-secretase having N-term inal biotin and made fluorescent by the covalent attachment of Oregon Green at the Cys residue is used to assay beta-secretase activity in the presence or absence of the inhibitory compounds. The substrate is Biotin-GLTNIKTEEISEISYAEVEFR-C[Oregon Green]KK-OH. The BACE1 enzyme is affinity purified material from conditioned media of CHO-K1 cells that have been transfected with a soluble BACE construct (BACE1deltaTM96His). Compounds are incubated in a log dose response curve from a top concentration of 100 μM with BACE1 enzyme and the biotinylated fluorescent peptide in 384-well black plates (Thermo Scientific #4318). BACE1 is at a final concentration of 0.1 nM with a final concentration of peptide substrate of 150 nM in a reaction volume of 30 μL assay buffer [100 mM sodium acetate, pH 4.5 (brought to pH with acetic acid), and 0.001% Tween-20]. Plates are covered and incubated for 3 hours at 37° C. The reaction is stopped with the addition of 30 μL of 1.5 μM Streptavidin (Pierce, #21125). After a 10 minute incubation at room temperature, plates are read on a PerkinElmer EnVision for fluorescence polarization (Ex485 nm/Em530 nm). Enzyme Assay Test substance: Compounds of the invention, prepared by the corresponding examples of the invention1. Experimental materials and instrumentsPDE9A2 Enzyme (BPS, Cat. No. 60090)384-well plate (Perkin Elmer, Cat. No. 6007279)2. Experimental procedurePreparation of the compounds: the compounds were prepared into 10 mM compound stock solution in DMSO for long-term storage. The obtained compound stock solution was diluted in 100 times with DMSO to obtain 100 μM compound working mother solution, and then the compound working mother solution was diluted in 3 times with DMSO to obtain 8-10 concentration gradients of diluted compound mother liquor (100×).Incubation with the compounds: A very small amount of liquid pipetting system Echo was used to pipette the diluted compound mother liquor into a 384-well plate. 200 nL diluted compound mother liquor and 10 μL PDE9A2 enzyme solution were added to each compound well. After centrifugation at 1000 rpm for 1 min, the mixture was incubated for 15 min at the room temperature. Then the 10 μL substrate mixture was added. After centrifugation at 1000 rpm for 1 min, the mixture was incubated with shocking for 30 min at the room temperature. Finally, a stop solution was added to end the reaction system. The mixture was incubated with shocking for 60 min at the room temperature. In the maximum reading hole (Max), the compound was replaced by solvent. In the minimum reading hole (Min), the compound and enzyme solution were replaced by solvent. Diffusion Ordered Spectroscopy (DOSY) Solutions of TS, TSY342H, and TSD247A in 20 mM Tris-HCl were exchanged with deuterated PBS using four cycles of concentration with Amicon Ultra (50,000 nominal molecular weight limit; Millipore) and diluted in deuterated PBS. One hundred microliters of 0.1 mM protein solution (TcTSs or BSA) was titrated with the sialoside (0.2, 0.4, 0.6, 0.8, 1.0, 1.2, 1.6, and 2.0 mM) or lacto-N-neotetraose (0.1, 0.2, 0.3, 0.4, 0.5, 0.6, 0.7, and 0.9mM) as a negative control. The solution containing 0.1 mM protein plus sialoside was further titrated with Me-Lac (0.1, 0.2, 0.3, 0.4, 0.5, 0.6, 0.7, and 0.9 mM) in Shigemi tubes. NMR spectra were obtained at a probe temperature of 293 K on a Bruker DMX 600-MHz spectrometer equipped with a 5-mm self-shielded gradient triple resonance probe. All DOSY experiments were performed with a stimulated echo using bipolar gradient pulses for diffusion, one spoil gradient, and the 3-9-19 pulse sequence with gradients for water suppression according to the Bruker pulse program stebpgp1s19. The gradient duration was set to δ = 10 ms (protein-only experiments) and 20ms (protein⋅carbohydrate complexes experiments), and the diffusion time was set to Δ = 40 ms. Gradient strength was linearly varied in 16 steps from 0.6 to 6.7 G/cm. For each of the 16 gradient amplitudes, eight transients of 192 complex data points were acquired to a 10.0-ppm spectral width. The pulse repetition delay between each scan was 3 s. MAOA and MAOB In Vitro Activity Experiments Screening method: Monoamine oxidase MAOA and MAOB activity screeningInstrument: microplate reader Envision (PerkinElmer, USA).MATERIALS: Human recombinant MAOA, purchased from Promega; human recombinant MAOB, purchased from Sigma;The MAOA and MAOB activity assay kit MAO-Glo was purchased from Promega. Principle: This method uses a specific luciferin derivative as a substrate, MAOA or MAOB can catalyze the conversion of substrate to luciferin methyl ester, and the product, luciferin methyl ester can produce fluorescence under the action of luciferase, thus reflecting the activity of MAOA or MAOB by the intensity of the fluorescent signal. Meanwhile, a blank control was set to determine the strength of the enzyme activity. Tranylcypromine (TCP) was employed as a positive inhibitor in the experiment.Sample processing: Samples were dissolved in DMSO, stored at low temperature, and the concentration of DMSO in the final system was controlled within a range that won't affect the activity of the assay.The activity of the sample was tested by primary screening at a single concentration, for example 100 μM. For samples exhibiting activity under certain conditions, for example, the inhibition rate (% Inhibition) being greater than 50, the active dose-dependent relationship, i.e., the IC50 value, was obtained by nonlinearly fitting the sample activity vs the sample concentration, the software used for the calculation was Graphpad Prism 5, the model used for the fit was sigmoidal dose-response (variable slope), and for most inhibitor screening models, the bottom and top of the fitted curve were set to 0 and 100. CYPA Binding Analysis by Surface Plasmon Resonance (SPR) Assay All SPR experiments were conducted on a Biacore 8K+ instrument (Cytiva). Recombinant biotinylated CYPA protein with a C-terminal AVI tag was purified and immobilized on flow cell 2 of SA chip (Cytiva, BR100531), with the flow cell 1 as the blank reference. The running buffer was HBS-P+ Buffer (Cytiva, BR100827, 0.01 M HEPES pH 7.4,0.15 M NaCl, 0.05% v/v Surfactant P20), and the flow rate was 10 μL/min. The immobilization level was achieved to about 1800 response units (RU). Compounds were 3-fold serially diluted to 1.5-3333 nM using HBS-P+Buffer with a final DMSO concentration of 1.5%, and then loaded to flow through the chip surface at a rate of 30 μL/min with HBS-P+Buffer containing 1.5% DMSO as the running buffer. Experiments were performed at 25° C. The contact time and dissociation time were set to 60 s and 200 s, respectively. After binding and dissociation of each sample, the chip was regenerated using 1 M NaCl with a short contact time of 19 s at a rate of 60 μL/min. The sensorgrams were analyzed using Biacore Insight Evaluation software with 1:1 kinetics binding model to determine the association rate constant (kon), dissociation rate constant (koff) and equilibrium dissociation constant (KD). Enzymatic Assay The PLpro primary assay using PLpro as prepared above was conducted as described below and provided the data described in Table 7 in the column: Enzymatic assay IC50 . The PLpro primary assay, which measures protease activity with the short peptide substrate Z-RLRGG-AMC (SEQ ID NO. 4) (Bachem), was performed in black, flat-bottom 384-well plates containing a final reaction volume of 50 μL. The assays were assembled at room temperature as follows: 40 μL of 50 nM PLpro in Buffer B (50 mM HEPES, pH 7.5, 0.1 mg/mL BSA, 0.01% Triton- X 100, and 5 mM DTT) was dispensed into wells containing 0.1-1 μL of inhibitor in DMSO or appropriate controls. The enzyme was incubated with inhibitor for 10 min prior to substrate addition. Reactions were initiated with 10 μL of 62.5 μM RLRGG-AMC (SEQ ID NO. 4) in Buffer B. Plates were shaken vigorously for 30 s, and fluorescence from the release of AMC from peptide was monitored continuously for 15 min on a Tecan Infinite M200 Pro plate reader (λexcitation=360 nm; λemission=460 nm). Slopes from the linear portions of each progress curve were recorded and normalized to plate-based controls. Positive control wells, representing 100% inhibition, included 10 μM GRL0617; negative control wells, representing 0% inhibition, included vehicle. IC50 Test of Compound YJZ5118 on CDK12, CDK13, and CDK9 Kinases The inhibitory activities of the test compound on the kinases were evaluated by LANCE Ultra assay, which was used for detecting ATP-dependent phosphorylation of a ULight-4E-BP1 (Thr37/Thr46) substrate peptide (150 nM). In short, enzymatic reactions were performed in a reaction buffer (25 mM HEPES (pH 7.5), 10 mM MgCl2, 0.01% BSA, 0.01% Tween 20, and 1 mM DTT). The assay was performed in a 384-well plate (6 μL). A final concentration of an ATP substrate was 10 M, and a final concentration of the ULight-4E-BP1 (Thr37/Thr46) substrate peptide was 150 nM. A final concentration of CDK9, CDK12, or CDK13 was 0.3, 30, or 30 nM, respectively. Pre-incubation of the compound and the enzyme was performed at room temperature for 60 min. The reaction was stopped by adding 10 mM EDTA and 0.15 nM Eu-labeled anti-phospho-eIF4E-binding protein 1 (Thr37/46) antibody in LANCE detection buffer after incubation at room temperature for 15, 60, or 90 min. Time-resolved fluorescence (excitation, 320 nm; emission donor, 615 nm; emission acceptor, 665 nm) was monitored using an EnVision spectrophotometer (PerkinElmer). Readings were computed as (acceptor count/donor count)×1000. IC50 values were derived by fitting a sigmoidal dose-response curve to a plot of assay readouts of inhibitor concentrations. Biochemical Inhibition Assay NAMPT Protein Purification. Recombinant His-tagged NAMPT was produced in E. coli cells, purified over a Ni column, and further purified over a size-exclusion column by XTAL Biostructures.The NAMPT Enzymatic Reaction. The NAMPT enzymatic reactions were carried out in Buffer A (50 mM Hepes pH 7.5, 50 mM NaCl, 5 mM MgCl2, and 1 mM THP) in 96-well V-bottom plates. The compound titrations were performed in a separate dilution plate by serially diluting the compounds in DMSO to make a 100× stock. Buffer A (89 μL) containing 33 nM of NAMPT protein was added to 1 μL of 100× compound plate containing controls (e.g. DMSO or blank). The compound and enzyme mixture was incubated for 15 min at room temperature, then 10 μL of 10× substrate and co-factors in Buffer A were added to the test well to make a final concentration of 1 μM NAM, 100 μM 5-Phospho-D-ribose 1-diphosphate (PRPP), and 2.5 mM Adenosine 5′-triphosphate (ATP). The reaction was allowed to proceed for 30 min at room temperature, then was quenched with the addition of 11 μL of a solution of formic acid and L-Cystathionine to make a final concentration of 1% formic acid and 10 μM L-Cystathionine. Background and signal strength was determined by addition (or non-addition) of a serial dilution of NMN to a pre-quenched enzyme and cofactor mix.Quantification of NMN. A mass spectrometry-based assay was used to measure the NAMPT reaction product, β-nicotinamide mononucleotide (NMN), and the internal control (L-Cystathionine). NMN and L-Cystathionine were detected using the services of Biocius Lifesciences with the RapidFire system. In short, the NMN and L-Cystathionine were bound to a graphitic carbon cartridge in 0.1% formic acid, eluted in 30% acetonitrile buffer, and injected into a Sciex 4000 mass spectrometer. The components of the sample were ionized with electrospray ionization and the positive ions were detected. The Q1 (parent ion) and Q3 (fragment ion) masses of NMN were 334.2 and 123.2, respectively. The Q1 and Q3 for L-Cystathionine were 223.1 and 134.1, respectively. The fragments are quantified and the analyzed by the following methodDetermination of IC50 Values. First, the NMN signal was normalized to the L-Cystathionine signal by dividing the NMN signal by the L-Cystathionine signal for each well. The signal from the background wells were averaged and subtracted from the test plates. The compound treated cells were then assayed for percent inhibition by using this formula:% Inh=100−100*x/ywherein x denotes the average signal of the compound treated wells and y denotes the average signal of the DMSO treated wells.IC50 values were then determined using the following formula:IC 50=10{circumflex over ( )}(LOG10(X)+(((50-%Inh at Cmpd Concentration 1)/(XX−YY)*(LOG10(X)−LOG10(Y))))wherein X denotes the compound concentration 1, Y denotes the compound concentration 2, XX denotes the % inhibition at compound concentration 1 (X), and YY denotes the % inhibition at compound concentration 2 (Y). Biological Assays-Inhibition of LSD1 Briefly, a fixed amount of LSD1 was incubated on ice for 15 minutes, in the absence and/or in the presence of at least eight 3-fold serial dilutions of the respective inhibitor (e.g., from 0 to 75 μM, depending on the inhibitor strength). Tranylcypromine (Biomol International) was used as a control for inhibition. Within the experiment, each concentration of inhibitor was tested in duplicate. After leaving the enzyme interacting with the inhibitor, KM of di-methylated H3-K4 peptide was added to each reaction and the experiment was left for 30 minutes at 37° C. in the dark. The enzymatic reactions were set up in a 50 mM sodium phosphate, pH 7.4 buffer. At the end of the incubation, Amplex Red reagent and horseradish peroxidase (HPR) solution were added to the reaction according to the recommendations provided by the supplier (Invitrogen), and left to incubate for 5 extra minutes at room temperature in the dark. A 1 μM H2O2 solution was used as a control of the kit efficiency. The conversion of the Amplex Red reagent to resorufin due to the presence of H2O2 in the assay, was monitored by fluorescence (excitation at 540 nm, emission at 590 nm) using a microplate reader (Infinite 200, Tecan). Arbitrary units were used to measure level of H2O2 produced in the absence and/or in the presence of inhibitor.The maximum demethylase activity of LSD1 was obtained in the absence of inhibitor and corrected for background fluorescence in the absence of LSD1. The IC50 value of each inhibitor was calculated with GraphPad Prism Software. Inhibition of CYP-2C8 The inhibition of cytochrome P450 2C8-isoenzyme catalyzed deethylation of amodiaquine by the test compound is assayed at 37° C. with human liver microsomes. All assays are carried out on a robotic system in 96 well plates. The final incubation volume contains TRIS buffer (0.1 M), MgCl2 (5 mM), human liver microsomes (0.05 mg/mL), amodiaquine (1 μM) and the test compound at five different concentrations or no compound (high control) in duplicate (e.g. highest concentration 10-50 μM with subsequent serial 1:4 dilutions). Following a short preincubation period, reactions are started with the cofactor (NADPH, 1 mM) and stopped by cooling the incubation down to 8° C. and subsequently by addition of one volume of acetonitrile. An internal standard solution the stable isotope d5-desethylamodiaquine is added after quenching of incubations. Peak area analyte (=metabolite formed) and internal standard is determined by LC-MS/MS. The resulting peak area ratio analyte to internal standard in these incubations is compared to a control activity containing no test compound. Within each of the assay runs, the IC50 of a positive control inhibitor (Montelukast) is determined. Experimental IC50 values are calculated by least square regression according to the following equation: % control activity=(100% control activity/(1+(I/IC 50)S))−B with I=inhibitor concentration; S=slope factor; B=background activity (lower plateau of the inhibition curve). Inhibition of CYP-2C9 The inhibition of cytochrome P450 2C9-isoenzyme catalyzed hydroxylation of diclofenac by the test compound is assayed at 37° C. with human liver microsomes. All assays are carried out on a robotic system in 96 well plates. The final incubation volume contains TRIS buffer (0.1 M), MgCl2 (5 mM), human liver microsomes (0.1 mg/mL), diclofenac (10 μM) and the test compound at five different concentrations or no compound (high control) in duplicate (e.g., highest concentration 10-50 μM with subsequent serial 1:4 dilutions). Following a short preincubation period, reactions are started with the cofactor (NADPH, 1 mM) and stopped by cooling the incubation down to 8° C. and subsequently by addition of one volume of acetonitrile. An internal standard solution the stable isotope 13C6-hydroxydiclofenac is added after quenching of incubations. Peak area analyte (=metabolite formed) and internal standard is determined by LC-MS/MS. The resulting peak area ratio analyte to internal standard in these incubations is compared to a control activity containing no test compound. Within each of the assay runs, the IC50 of a positive control inhibitor (sulfaphenazole) is determined. Experimental IC50 values are calculated by least square regression according to the following equation: % control activity=(100% control activity/(1+(I/IC 50)S))−B with I=inhibitor concentration; S=slope factor; B=background activity (lower plateau of the inhibition curve). Activity Test of Compounds in the CHK1 Coupled Reaction System The compounds of the present disclosure used in the experiments were self-prepared, and their chemical names and structural formulas were shown in the preparation embodiments of each compound. The determination mixture containing embodiment compounds of the present disclosure and Chk1 and Chk2 kinases were incubated in a microtiter plate, and CHK1 inhibitor activity of compounds were tested by monitoring the phosphorylation of Chk1 and Chk2 kinases on a synthetic peptide substrate with a specific amino acid sequence (KKKVSRSGLYRSPSMPENLNRPR, SEQ ID NO: 1). The test was carried out on the KinaseProfiler protein kinase activity detection platform of Eurofins, and the experimental results were provided by the company. The procedure was as follows: Chk1 and Chk2 kinases were diluted with 20 mM MOPS (morpholinpropane sulfonic acid), 1 mM EDTA (ethylenediaminetetraacetic acid), 0.04% Brij-35, 5% glycerol, 0.1% 2-mercaptoethanol, 1 mg/mL BSA (bovine serum albumin) and added to the reaction system, and the reaction system contained the embodiment compounds, 8 mM MOPS pH 7.0, 0.2 mM EDTA, 200 sM polypeptide substrate (KKKVSRSGLYRSPSMPENLNRPR, SEQ ID NO: 1), 10 mM magnesium acetate and a certain concentration of [γ-33P]-ATP (the strength was about 500 cpm/pmol). A mixture solution of Mg2′ and ATP (adenosine triphosphate) was added to initiate the reaction and the reaction solution was incubated at room temperature for 40 min. 0.5% Phosphate buffer was added to terminate the reaction. 10 μL of the reaction solution was filtered four times on a continuous filter P30, washed three times with 0.425 phosphate buffer, and once with methanol, each wash for 4 min. The value was read with scintillation counting method after drying. Inhibitory Activity on Human ACC1 and the ACC2 Recombinant human ACC1 and recombinant human ACC2, which were prepared by the method mentioned above, were preincubated with assay buffer solution (50 mM HEPES-KOH (pH 7.4), 10 mM magnesium chloride, 6-10 mM potassium citrate, 4 mM reduced form of glutathione, 1.5 mg/ml bovine serum albumin) for one hour. Then, 0.2 μL of each this invention compound solution (in DMSO) were dispensed to 384-well microplate, 5 μL of the preincubated enzyme solution and 5 μL of substrate solution (50 mM HEPES-KOH (pH 7.4), 1 mM ATP, 0.8 mM acetyl CoA and 25-50 mM potassium bicarbonate) were added to microplate. After centrifugation and shaking, the reaction mixtures were incubated in a humidified box at room temperature for 1 to 3 hours. After the incubation, the enzyme reactions were stopped by the addition of EDTA. Then, after the samples were cocrystallized with CHCA (α-cyano-4-hydroxy cinnamic acid) matrices on MALDI target plate, by using the matrix assist laser deionization time-of-flight mass spectrometer (MALDI-TOF MS), samples were measured in reflector negative mode. Deprotonated ions of acetyl CoA (AcCoA) of substrate and malonyl CoA (MalCoA) of the reaction product were detected, then, the conversion rates of acetyl CoA to malonyl CoA was calculated by the intensity of [MalCoA-H]−/(Intensity of [MalCoA-H]−+Intensity of [AcCoA-H]−) using each signal strength. The 50% inhibitory concentration (IC50) was calculated from the inhibition rate of the enzymatic reaction at each concentration of the compounds. In addition, potassium citrate concentrations in assay buffer solution, potassium hydrogen carbonate concentrations in substrate solution and incubation time were adjusted by each lot of enzyme. The Measurement of Inhibitory Activity on Human ACC1 and the ACC2 Recombinant human ACC1 and recombinant human ACC2, which were prepared by the method mentioned above, were preincubated with assay buffer solution (50 mM HEPES-KOH (pH 7.4), 10 mM magnesium chloride, 6-10 mM potassium citrate, 4 mM reduced form of glutathione, 1.5 mg/ml bovine serum albumin) for one hour. Then, 0.2 μL of each this invention compound solution (in DMSO) were dispensed to 384-well microplate, 5 μL of the preincubated enzyme solution and 5 μL of substrate solution (50 mM HEPES-KOH (pH 7.4), 1 mM ATP, 0.8 mM acetyl CoA and 25-50 mM potassium bicarbonate) were added to microplate. After centrifugation and shaking, the reaction mixtures were incubated in a humidified box at room temperature for 1 to 3 hours. After the incubation, the enzyme reactions were stopped by the addition of EDTA. Then, after the samples were cocrystallized with CHCA (α-cyano-4-hydroxy cinnamic acid) matrices on MALDI target plate, by using the matrix assist laser deionization time-of-flight mass spectrometer (MALDI-TOF MS), samples were measured in reflector negative mode. Deprotonated ions of acetyl CoA (AcCoA) of substrate and malonyl CoA (MalCoA) of the reaction product were detected, then, the conversion rates of acetyl CoA to malonyl CoA was calculated by the intensity of [MalCoA-H]−/(Intensity of [MalCoA-H].+Intensity of [AcCoA-H] ) using each signal strength. The 50% inhibitory concentration (IC50) was calculated from the inhibition rate of the enzymatic reaction at each concentration of the compounds. In addition, potassium citrate concentrations in assay buffer solution, potassium hydrogen carbonate concentrations in substrate solution and incubation time were adjusted by each lot of enzyme. Biochemical Assay The assay employs a short peptide substrate labeled with the single fluorophore PT14 as a fluorescence lifetime probe sensitive to the cleavage state of the substrate (PT14: 6-(9-oxo-9H-acridin-10-yl)-hexanoate, AssayMetrics, UK). The peptide substrate has the following sequence: Ac-Trp-Leu-Arg-Ser-Arg{circumflex over ( )}Cys(PT14)-NH2 (Product number BS-9117, Biosyntan, Germany, N-terminus to C-terminus from left to right in three letter code, Ac: acetyl group, Cys(PT14): cysteine residue with the fluorophore PT14 conjugated to the cysteine sulfhydryl group via a maleimide group; C-terminus of the peptide is amidated; within the substrate sequence written above, {circumflex over ( )} indicates the scissile bond). The assay buffer consists of 200 mM Tris/HCl at pH 7.5, 0.8 M Na citrate, 100 μM EGTA, 100 μM DTT and 0.05% (w/v) CHAPS. The kinetic characterization of the enzymatic reaction led to the determination of a Michaelis Constant (KM) of 40 μM and a kcat value of 34 s−1. The assay was established for the 384-well plate format using black microtiter round well plates (Product number 95040020, Thermo Electron Oy, Finland). Test compounds were dissolved in 100% (v/v) DMSO or a mixture containing 90% (v/v) DMSO and 10% (v/v) H2O at a stock concentration of 100 mM. Serial dilutions of test compounds were prepared using either 100% (v/v) DMSO or a mixture containing 90% (v/v) DMSO and 10% (v/v) H2O. Enzyme Kinetics of SARS-CoV-2 3CLP A synthesized fluorescent substrate containing the cleavage site (indicated by the arrow, ↓) of SARS-CoV-2 3CLP (2-Abz-SVTLQ↓SG-Tyr(NO2)—R—NH2) was used for the fluorescence resonance energy transfer (FRET)-based cleavage assay4. The protease reaction of SARS-CoV-2 3CLP towards fluorescent substrate was performed in activity buffer (20 mM Bis Tris, pH 7.8, 1 mM DTT) at 37° C. for 10 min. The final concentration of protease used in the assay was fixed at 80 nM and the concentrations of the substrate were varied from 0.1 to 500 μM. Reaction was started with the enzyme and the fluorescence signal of the Abz-SVTLQ peptide cleavage product was monitored at an emission wavelength of 420 nm with excitation at 320 nm, using an Flx800 fluorescence spectrophotometer (BioTek). Before kinetic calculations, it was verified that the proportionality between the fluorescence emitted and the amount of the substrate used in the assay was linear. The minimal concentration of the enzyme and time of reaction that gave a linear dependence of amount of generated product with time was chosen. Initial velocities in corresponding relative fluorescence units per unit of time (ARFU/s) were converted to the amount of the cleaved substrate per unit of time (M/s) by fitting to the calibration curve of free Aminobenzoyl-SVTLQ. All data are corrected for inner filter effects by an adopted literature protocol. In short, the fluorescence signal (RFU) at each substrate concentration was determined and defined as f(FRET). Inhibitory Effect Against DGKalpha Enzyme First, 3×OAG (3 mM)/ATP (0.45 mM) substrate solution was prepared from 1× substrate assay buffer (40 mM MOPS (pH 7.2), 20 mM MgCl2, 1 mM DTT, 0.4 mM CaCl2), 3 mM sodium deoxycholate, 100 mM NaCl, 0.1 mg/mL BSA, 0.12% NP-40), and vortexed thoroughly for 3 minutes to induce detergent-lipid micelle formation. Then, 3×DGKα (7.5 nM) enzyme solution was prepared from 2× enzyme assay buffer (80 mM MOPS (pH 7.2), 2 mM DTT, 200 mM NaCl, 0.2 mg/mL BSA) and vortexed for a short time. After preparing the above two solutions, a half-area opaque 96-well assay plate was prepared, and 10 μL of 3× diluted compound solution (30 μM to 0 μM) was transferred to each well. Next, 10 μL of 3×DGK enzyme solution was transferred to the same plate, mixed by pipetting, and then 10 μL of 3×OAG/ATP substrate solution was added to the assay plate and mixed well. The plate was incubated at room temperature for 20 minutes for the enzyme reaction. Next, 15 μL of ADP-Glo reagent was added to each well and mixed by pipetting, followed by incubating the plate at room temperature for 40 minutes to deplete the remaining ATPs. After this step, 30 μL of kinase detection reagent was added and mixed, and the plate was incubated at room temperature for an additional 20 minutes and luminescence was measured by Envision to calculate the IC50 value of each compound. Biochemical Activity ACSS2 Assay The biochemical activity assay for ACSS2 is based on the detection of released AMP by AMP-Glo Assay kit (Promega, Madison). The assay is run in three steps: the enzymatic reaction in which human rec ACSS2 activates acetate with ATP and Coenzyme A as cosubstrates to acetyI-coA thereby releasing AMP and the detection reaction of AMP by AMP Glo assay in which after the destruction of the residual ATP with AMP Glo reagent 1 produced AMP is converted to ATP that is measured in a luciferase assay system (detection reagent). The ACSS2 activity correlates with the detected luminescence signal. The assay was performed in Perkin Elmer 384well white Proxiplates in a total volume of 8 µl. 1 nM (fc) C-term myc tagged ACSS2 (human, recombinant, Origene, Rockville, US) and a mixture of 100 µM (fc) ATP, 100 µM (fc) Coenzyme A and 500 µM (fc) sodium acetate were incubated in a total volume of 5 µl (50 mM Hepes, 1 mM Mg-chloride, 150 mM NaCl, 1 mM DTT, 0.01 % (w/v) BSA, 0.3 % DMSO, pH 7.5) in the absence or presence of the test compound (10 dilution concentrations, start conc 30 µM) for 180 min at 37° C. The reaction was stopped and residual ATP destroyed by the addition of 1 µl AMP Glo reagent solution (Promega, Madison, US). After 1 h incubation at room temperature 2 µl of AMP Glo detection reagent was added and the assay was incubated for 0.75 hr at room temperature. The luminescence signal was measured with an Envision multimode reader (Perkin Elmer LAS Germany GmbH) at 700 nm in luminescence mode. The full value used was the inhibitor-free reaction. The pharmacological zero value was generated by addition of ACSS2 inhibitor (Ac-CoA Synthase Inhibitor - CAS 508186-14-9 -Calbiochem) in a final concentration of 5 µM. The inhibitory values (IC50) were determined using the program Assay Analyzer from GeneData. Detection of Compound's Ability to Inhibit HPK1 Kinase Activity Assay The specific operation is as follows: configure the enzymatic reaction system buffer (10 mM MOPS, pH 7.2, 5 mM β-glycerol-phosphate, 10 mM MgCl2, 0.8 mM EDTA, 2 mM EGTA, 0.1 mM DTT); the test compound (1 mM the compound stock solution in DMSO) was diluted with buffer to the highest concentration of 60 uM (containing 6% DMSO), and the compound with a concentration of 60 μM was initially diluted 5 times with a buffer containing 6% DMSO for a total of 8 points of gradient concentration; then dilute HPK1 kinase to 30 nM in buffer. Add 2 μl of HPK1 kinase diluent to each well of a Greiner 384-well microplate (Cat. No. 784075), and add 2 μl of buffer to the control well; add 1 μl of the diluted compound to the reaction well after brief centrifugation, and add 1 μl buffer solution containing 6% DMSO to the control well; after short centrifugation, place in a 25° C. constant temperature incubator (Shanghai Yiheng Scientific Instrument Co., Ltd., Cat. No.: LRH-150) and incubate for 20 minutes. Add 3 μl of reaction substrate (10 μM MBP and 20 μM ATP dissolved in distilled water) to each well, briefly centrifuge and incubate in a constant temperature incubator at 25° C. for 60 min, and use ADP-Glo Kinase Assay Kit to detect the enzymatic reaction activity, ADP-Glo Kinase Assay Kit detection is carried out according to the operating instructions of the kit. Data are described using the half maximal inhibitory Enzymatic Activity Assay The activity of recombinant human PI3Kγ ((aa144-1102)-6His) and PI3Kα, β, δ (6-His(p110-p85α)) was determined by measuring the ADP level after phosphorylation of DiC8-PIP2 using a commercially available ADP-Glo kit from Promega. The assay was carried out in white low volume 384 well plates in a final volume of 14 μl at R.T. The assay conditions contained the following: 50 mM Tris buffer pH 7.4, 2.1 mM DTT, 3 mM MgCl2, 0.05% CHAPS, 20 μM ATP, 80 μM DiC8-PIP2 and 1.2 nM PI3Kα, β, γ or 0.6 nM PI3Kδ. Potential inhibitors were made up in DMSO and then diluted in the assay to give a final concentration of not exceeding 1% (v/v) DMSO. A 10-point half-log dilution series of the inhibitors (highest concentration typically 0.1 μM for δ or γ and 33 μM for a or 1) was tested and the pIC50 determined using a 4-parameter logistic equation in a non-linear curve fitting routine. Routinely, inhibitors were pre-incubated with 3 μl of enzyme for 15 min prior to the addition of 2 μl substrate mixture for a further 60 min enzyme reaction. The phosphorylation was stopped with the addition of 3 μl ADP-Glo reagent (stop solution) followed by a 40 min incubation. Prior to detection 6 μl of ADP-Glo Kinase Detection Reagent was added and the plates were read in a micro plate reader using a Luminescence filter. All additions were followed by a short centrifugation step. GPR120 pERK AlphaScreen SureFire Assay The human and mouse GPR120-mediated intracellular phosphorylated ERK assays were also established using CHO-K1 cells stably transfected with the short form of human or mouse GPR120 receptor. Cells were cultured in growth medium consisting of F-12 media (Invitrogen Cat. #11765) with 5% Charcoal/Dextran FBS (Invitrogen Cat. #12676-029) and 500 μg/mL GENETICIN (Life Technologies Cat. #10131-027). Cells were cryo preserved at a concentration of 3×10⁶ cells/mL, in 70% F-12, 20% Charcoal/Dextran FBS and 10% DMSO, and frozen in liquid nitrogen at a low passage number.For the pERK assay, 3×10⁶ cells/mL cryopreserved human and mouse cells were thawed rapidly in a 37° C. water bath and added to a T-225 flask containing 50 mL growth medium. The flasks were placed in a tissue culture incubator overnight (37° C., 5% CO2). The next day, cells were harvested with trypsin (Gibco Cat. #25300-054), resuspended in serum-containing growth medium and counted using a Cellometer and volume adjusted to a concentration of 0.5×10⁶ cells/mL. Cells were plated into 384-well clear bottom tissue culture plates (BD Cat. #353962) at 50 μL/well, for a density of 25,000 cells/well using a MULTIDROP and incubated for 16-18 hours (overnight) at 37° C. with 5% CO2. The next day, cells were washed once with 50 μL of PBS without Ca++/Mg++ (Gibco Cat. #14190-036) and serum starved in 25 μL of F-12 media without any serum or antibiotics for 2 hours at 37° C. In Vitro BRD4 (BD1) Enzymatic Activity Assay In the present application, IC50 values of the compounds in inhibiting BRD4 (BD1) enzyme binding reaction were determined by homogeneous time resolved fluorescence (HTRF). A compounds was serially diluted 5-fold with 100% DMSO starting from 0.2 mM (7 concentrations in total), and then 2 μL of the compound at each concentration was added to 48 μL of a reaction buffer (20 mM HEPES pH 7.5, 150 mM NaCl, 5 mM DTT, 0.005% Tween 20, and 100 μg/mL BSA) for dilution, and mixed well. 2.5 μL of the resulting mixture was added to a 384-well plate (OptiPlate-384, purchased from PerkinElmer), then 5 μL of GST-BRD4 (BD1, 44-168 aa) (final concentration: 1 nM) was added, and the resulting mixture was centrifuged, and fully mixed. 2.5 μL of a short peptide Biotin-AHA-SGRGK(Ac)GGK(Ac)GLGK(Ac)GGAK(Ac) RHRKV (final concentration: 100 nM) was then added to initiate the reaction (total reaction volume: 10 μL). The 384-well plate was placed in an incubator at 23° C. to react for 1 hour, and then 5 μL of Eu3+ cryptate-labled anti-GST antibody (purchased from Cisbio) and 5 μL of Streptavidin-XL-665 (purchased from Cisbio) were added to terminate the reaction. After being incubated in the incubator for another 1 hour, the fluorescence values (excited at 320 nm, emitted light at 665 nm and 620 nm being detected, and the ratio of the two being the enzyme binding signal) were read on Envision (purchased from PerkinElmer). In Vitro Enzymatic Activity Assay In the present application, the IC50 value of the compound of formula (I) in inhibiting BRD4 (BD1) enzyme binding reaction were determined by homogeneous time resolved fluorescence (HTRF). The compound of formula (I) was serially diluted 5-fold with 100% DMSO starting from 0.2 mM (7 concentrations in total), and then 2 μL of the compound of formula (I) at each concentration was added to 48 μL of a reaction buffer (20 mM HEPES pH 7.5, 150 mM NaCl, 5 mM DTT, 0.005 % Tween 20, and 100 μg/mL BSA) for dilution, and mixed well. 2.5 μL of the resulting mixture was added to a 384-well plate (OptiPlate-384, purchased from PerkinElmer), then 5 μL of GST-BRD4 (BD1, 44-168 aa) (final concentration: 1 nM) was added, and the resulting mixture was centrifuged, and fully mixed. 2.5 μL of a short peptide Biotin-AHA-SGRGK(Ac)GGK(Ac)GLGK(Ac)GGAK(Ac) RHRKV (final concentration: 100 nM) was then added to initiate the reaction (total reaction volume: 10 μL). The 384-well plate was placed in an incubator at 23° C. to react for 1 hour, and then 5 μL of Eu3+cryptate-labled anti-GST antibody (purchased from Cisbio) and 5 μL of Streptavidin-XL-665 (purchased from Cisbio) were added to terminate the reaction. After being incubated in the incubator for another 1 hour, the fluorescence values (excited at 320 nm, emitted light at 665 nm and 620 nm being detected, and the ratio of the two being the enzyme binding signal) were read on Envision (purchased from PerkinElmer). JAK/TYK2 Assay 10 mM test compound stock or 1 mM control compound stock (tofocitinib, ruxolitinib or staurosporine) in DMSO was diluted to 0.4 mM in DMSO. A 3-fold series dilution was then performed in DMSO to generate 10 different compound concentrations. The assay was carried out in 384-well white plate. 0.5 uL of 40× compound DMSO solution at different concentrations was mixed with 10 uL 2× enzyme prepared in reaction buffer (20 mM HEPES, 10 mM MgCl2, 0.01% Tween, 1 mM DTT, pH 7.5). 10 uL 2× substrate mixture prepared in reaction buffer was then added to start the reaction. A short spin was done to settle down all solutions to the bottom of the plate. Final concentrations of test compound in the reaction mixture were 10000, 3333, 1111, 370, 123, 41.2, 13.7, 4.57, 1.52 and 0.51 nM. Concentrations of control compound were ten times less. Enzymatic reaction was conducted at 25° C. for 1-2 hours. 10 uL of Kinase Glo Reagents was added to stop the reaction and generate the luminescent signal which was measured using Envision. Luminescence signal was inversely related to kinase activity. Reaction mixture which did not contain enzyme served as negative control. The mixture without any compound was the positive control. Final concentration of enzymes and substrates and incubation time are summarized in the table below.[enz] [ATP] [sub] timeJAK1 7.5 nM 2 uM 30 uM (IRS-1) 1 hrJAK2 0.8 nM 2 uM 4 uM (pEY) 1 hrJAK3 1.5 nM 2 uM 4 uM (pEY) 1 hrTYK2 9 nM 2 uM 30 uM (IRS-1) 1 hr MERS-CoV nLUC in Calu-3 At 48 hours prior to infection, Calu-3 2B4 cells were plated in a 96-well black-walled clear bottom plate at 5x10⁴ cells/well. A 10 mM stock of NHC was serially diluted in 100% DMSO in 3-fold increments to obtain a ten-point dilution series. MERS-nLUC was diluted in DMEM supplemented with 10% FBS, and 1% Antibiotic-Antimycotic to achieve a multiplicity of infection (MOI) of 0.08. Cells were infected and concurrently treated with NHC in triplicate per drug dilution for 1hr, after which viral inoculum was aspirated, cultures were rinsed once and fresh medium containing drug or vehicle was added. At 48 hours post infection, nanoluciferase expression as a surrogate for virus replication was quantitated on a Spectramax plate reader (Molecular Devices) according to the manufacturer s instructions (Promega, NanoGlo). For the 100% inhibition control, diluted MERS-nLUC was exposed to short-wave UV light (UVP, LLC) for 6 min to inhibit the ability of the virus to replicate. For the 0% inhibition control, cells were infected in the presence of vehicle only. DMSO was kept constant in all conditions at 0.05%. Values from triplicate wells per condition were averaged and compared to controls to generate a percent inhibition value for each drug dilution. The IC50 value was defined as the concentration at which there was a 50% decrease in luciferase expression. Data were analyzed using GraphPad Prism 8.0. The IC50 values were calculated by non-linear regression analysis using the dose-response (variable slope) equation (four parameter logistic equation): Y = Bottom + (Top-Bottom)/(1+10^((LogIC50-X)*HillSlope)). DPP-IV Activity Inhibition Tests In Vitro DPP-IV could hydrolyze Gly-Pro-Aminoluciferin at room temperature to generate Aminoluciferin, which could produce glow type luminescent signals in a luciferase reaction system provided by a DPPIV-Glo protease test kit, and the strength of the luminescent signals was in direct proportion to the enzyme activity of DPP-IV.1. Experimental purposes:to evaluate the inhibition effects of compounds I-1 I-4 in the present invention by observing their activity inhibition to DPP-IV enzyme.2. Experimental materials:2.1 humanized recombinant DPP-IV: SIGMA product, article number D3446-10UG.2.2 DPPIV-Glo protease detection kit: Promega product, article number G8351.2.3 Trizma base: Sigma product, article number T6066-1KG: prepared into 10 mM Tris-HCl, pH 8.0.2.4 384 OptiPlate: PerkinElmer product, article number 6007299.2.5 Liquid treatment instrument: Bravo (Agilent company); Echo (Labcyte company).2.6 Detection instrument Envision (PerkinElmer company).3. Experimental methods:3.1 Diluting tested samples in a gradient dilution to ten concentrations by DMSO with Bravo, and then transferring 250 nl of samples to 384 OptiPlate with Echo.3.2 Diluting dipeptidyl peptidase IV (Sigma) to 0.2 ng/ml solution with 10 mM Tris-HCl (pH 8.0), adding the samples to be detected in, per well 25 μl. Meanwhile, a blank control (including substrate but no enzyme and samples) and positive control (including substrate and enzyme but no samples) were also set up.3.3 Adding 25 μl of DPPIV-Glo Reagent (prepared according to instructions in DPPIV-Glo protease detection kit, containing 20 μM DPP-IV substrate Gly-Pro-Aminofluorescein and luciferase reaction system) into each well.3.4 Reacting at room temperature for 60 min, determining the luminescence intensity by Envision.3.5 Calculating the enzyme activity of DPP-IV according to the luminescence intensity, enzyme activity=(sample luminescence intensity values−blank control luminescence intensity values/(positive control luminescence intensity values−blank control luminescence intensity values)×100.3.6 Calculating IC50 of the samples according to the enzyme activity using GraphPad Prism5.0 software. LSD1 Assays Briefly, a fixed amount of LSD1 was incubated on ice for 15 minutes, in the absence and/or in the presence of at least eight 3-fold serial dilutions of the respective inhibitor (e.g., from 0 to 75 μM, depending on the inhibitor strength). Tranylcypromine (Biomol International) was used as a control for inhibition. Within the experiment, each concentration of inhibitor was tested in duplicate. After leaving the enzyme interacting with the inhibitor, KM of di-methylated H3-K4 peptide was added to each reaction and the experiment was left for 30 minutes at 37° C. in the dark. The enzymatic reactions were set up in a 50 mM sodium phosphate, pH 7.4 buffer. At the end of the incubation, Amplex Red reagent and horseradish peroxidase (HPR) solution were added to the reaction according to the recommendations provided by the supplier (Invitrogen), and left to incubate for 5 extra minutes at room temperature in the dark. A 1 μM H2O2 solution was used as a control of the kit efficiency. The conversion of the Amplex Red reagent to resorufin due to the presence of H2O2 in the assay, was monitored by fluorescence (excitation at 540 nm, emission at 590 nm) using a microplate reader (Infinite 200, Tecan). Arbitrary units were used to measure level of H2O2 produced in the absence and/or in the presence of inhibitor. The maximum demethylase activity of LSD1 was obtained in the absence of inhibitor and corrected for background fluorescence in the absence of LSD1. The IC50 value of each inhibitor was calculated with GraphPad Prism Software. The results presented in Table 1 below show the results of the LSD1 inhibition studies for a number of the Example compounds. In Table 2 the IC50 values for all examples tested in this assay are shown. Parnate (tranylcypromine; i.e., 2-trans phenylcyclopropylamine) was found to have a IC50 value of 35±10 micromolar. The studies show that the compounds of the invention have unexpectedly potent LSD1 inhibition. Biochemical Assay IC50 values of test compounds were determined with an enzyme activity assay using the C-domain of MALT1 (amino acids 329-824). The readout parameter is the increase of fluorescence lifetime over time, proportional to enzyme activity.The assay employs a short peptide substrate labeled with the single fluorophore PT14 as a fluorescence lifetime probe sensitive to the cleavage state of the substrate (PT14: 6-(9-oxo-9H-acridin-10-yl)-hexanoate, AssayMetrics, UK). The peptide substrate has the following sequence: Ac-Trp-Leu-Arg-Ser-Arg^Cys(PT14)-NH2 (Product number BS-9117, Biosyntan, Germany, N-terminus to C-terminus from left to right in three letter code, Ac: acetyl group, Cys(PT14): cysteine residue with the fluorophore PT14 conjugated to the cysteine sulfhydryl group via a maleimide group; C-terminus of the peptide is amidated; within the substrate sequence written above, ^ indicates the scissile bond). The assay buffer consists of 200 mM Tris/HCl at pH 7.5, 0.8 M Na citrate, 100 μM EGTA, 100 μM DTT and 0.05% (w/v) CHAPS. The kinetic characterization of the enzymatic reaction led to the determination of a Michaelis Constant (KM) of 40 μM and a kcat value of 34 s−1. The assay was established for the 384-well plate format using black microtiter round well plates (Product number 95040020, Thermo Electron Oy, Finland). Test compounds were dissolved in 100% (v/v) DMSO or a mixture containing 90% (v/v) DMSO and 10% (v/v) H2O at a stock concentration of 100 mM. Serial dilutions of test compounds were prepared using either 100% (v/v) DMSO or a mixture containing 90% (v/v) DMSO and 10% (v/v) H2O. Determination of Enzyme Inhibition in SARS-CoV-2 3-Chymotrypsin-Like Protease (3CLP) Assay A synthesized fluorescent substrate containing the cleavage site (indicated by the arrow, ↓) of SARS-CoV-2 3CLP (2-Abz-SVTLQ↓SG-Tyr(NO2) R NH2) was used for the fluorescence resonance energy transfer (FRET)-based cleavage assay. The protease reaction of SARS-CoV-2 3CLP towards fluorescent substrate was performed in activity buffer (20 mM Bis Tris, pH 7.8, 1 mM DTT) at 37 C. for 10 min. The final concentration of protease used in the assay was fixed at 80 nM and the concentrations of the substrate were varied from 0.1 to 500 μM. Reaction was started with the enzyme and the fluorescence signal of the Abz-SVTLQ peptide cleavage product was monitored at an emission wavelength of 420 nm with excitation at 320 nm, using an Flx800 fluorescence spectrophotometer (BioTek). Before kinetic calculations, it was verified that the proportionality between the fluorescence emitted and the amount of the substrate used in the assay was linear. The minimal concentration of the enzyme and time of reaction that gave a linear dependence of amount of generated product with time was chosen. Initial velocities in corresponding relative fluorescence units per unit of time (ARFU/s) were converted to the amount of the cleaved substrate per unit of time (M/s) by fitting to the calibration curve of free Aminobenzoyl-SVTLQ. All data are corrected for inner filter effects by an adopted literature protocol. In short, the fluorescence signal (RFU) at each substrate concentration was determined and defined as f(FRET). Then, 5 μL free Aminobenzoyl-SVTLQ at final 5 μM was added to each concentration and fluorescence was taken f(FRET+Aminobenzoyl-SVTLQ). PI3-Kinase HTRF Assay A PI3-Kinase HTRF assay kit (cat No. 33-016) purchased from Millipore Corporation is used to screen compounds provided herein. This assay uses specific, high affinity binding of the GRP1 pleckstrin homology (PH) domain to PIP3, the product of a Class 1A or 1B PI3 Kinase acting on its physiological substrate PIP2. During the detection phase of the assay, a complex is generated between the GST-tagged PH domain and biotinylated short chain PIP3. The biotinylated PIP3 and the GST-tagged PH domain recruited fluorophores (Streptavidin-Allophycocyanin and Europium-labeled anti-GST respectively) to form the fluorescence resonance energy transfer (FRET) architecture, generating a stable time-resolved FRET signal. The FRET complex is disrupted in a competitive manner by non-biotinylated PIP3, a product formed in the PI3 Kinase assay.PI3 Kinase α, β, γ or δ activity is assayed using the PI3 Kinase HTRF , assay kit (catalogue No. 33-016) purchased from Millipore Corporation. Purified recombinant PI3Kα (catalogue No. 14-602-K), PI3Kβ (catalogue No. 14-603-K), PI3Kγ (catalogue No. 14-558-K), and PI3Kδ (catalogue No. 14-604-K) are obtained from Millipore Corporation. Purified recombinant PI3K enzyme is used to catalyze the phosphorylation of phosphatidylinositol 4,5-bisphosphate (PIP2 at 10 μM) to phosphatidylinositol 3,4,5-trisphosphate (PIP3) in the presence of 10 μM ATP. The assay is carried out in 384-well format and detected using a Perkin Elmer EnVision Xcite Multilabel Reader. Emission ratios are converted into percent inhibitions and imported into GraphPad Prism software. The concentration necessary to achieve inhibition of enzyme activity by 50% (IC50) is calculated using concentrations ranging from 20 μM to 0.1 nM (12-point curve), IC50 values are determined using a nonlinear regression model available in GraphPad Prism 5. PI3-Kinase HTRF Assay A PI3-Kinase HTRF assay kit (cat No. 33-016) purchased from Millipore Corporation is used to screen compounds provided herein. This assay uses specific, high affinity binding of the GRP1 pleckstrin homology (PH) domain to PIP3, the product of a Class 1A or 1B PI3 Kinase acting on its physiological substrate PIP2. During the detection phase of the assay, a complex is generated between the GST-tagged PH domain and biotinylated short chain PIP3. The biotinylated PIP3 and the GST-tagged PH domain recruited fluorophores (Streptavidin-Allophycocyanin and Europium-labeled anti-GST respectively) to form the fluorescence resonance energy transfer (FRET) architecture, generating a stable time-resolved FRET signal. The FRET complex is disrupted in a competitive manner by non-biotinylated PIP3, a product formed in the PI3 Kinase assay.PI3 Kinase α, γ or δ activity is assayed using the PI3 Kinase HTRF assay kit (catalogue No. 33-016) purchased from Millipore Corporation. Purified recombinant PI3Kα (catalogue No. 14-602-K), PI3Kβ (catalogue No. 14-603-K), PI3Kγ (catalogue No. 14-558-K), and PI3Kδ (catalogue No. 14-604-K) are obtained from Millipore Corporation. Purified recombinant PI3K enzyme is used to catalyze the phosphorylation of phosphatidylinositol 4,5-bisphosphate (PIP2 at 10 μM) to phosphatidylinositol 3,4,5-trisphosphate (PIP3) in the presence of 10 μM ATP. The assay is carried out in 384-well format and detected using a Perkin Elmer EnVision Xcite Multilabel Reader. Emission ratios are converted into percent inhibitions and imported into GraphPad Prism software. The concentration necessary to achieve inhibition of enzyme activity by 50% (IC50) is calculated using concentrations ranging from 20 μM to 0.1 nM (12-point curve). IC50 values are determined using a nonlinear regression model available in GraphPad Prism 5. PI3-Kinase HTRF Assay A PI3-Kinase HTRF assay kit (cat No. 33-016) purchased from Millipore Corporation was used to screen compounds provided herein. This assay used specific, high affinity binding of the GRP1 pleckstrin homology (PH) domain to PIP3, the product of a Class 1A or 1B PI3 Kinase acting on its physiological substrate PIP2. During the detection phase of the assay, a complex was generated between the GST-tagged PH domain and biotinylated short chain PIP3. The biotinylated PIP3 and the GST-tagged PH domain recruited fluorophores (Streptavidin-Allophycocyanin and Europium-labeled anti-GST respectively) to form the fluorescence resonance energy transfer (FRET) architecture, generating a stable time-resolved FRET signal. The FRET complex was disrupted in a competitive manner by non-biotinylated PIP3, a product formed in the PI3 Kinase assay.PI3 Kinase α, β, γ or δ activity was assayed using the PI3 Kinase HTRF assay kit (catalogue No. 33-016) purchased from Millipore Corporation. Purified recombinant PI3Kα (catalogue No. 14-602-K), PI3Kβ (catalogue No. 14-603-K), PI3Kγ (catalogue No. 14-558-K), and PI3Kδ (catalogue No. 14-604-K) were obtained from Millipore Corporation. Purified recombinant PI3K enzyme was used to catalyze the phosphorylation of phosphatidylinositol 4,5-bisphosphate (PIP2 at 10 μM) to phosphatidylinositol 3,4,5-trisphosphate (PIP3) in the presence of 10 μM ATP. The assay was carried out in 384-well format and detected using a Perkin Elmer EnVision Xcite Multilabel Reader. Emission ratios were converted into percent inhibitions and imported into GraphPad Prism software. The concentration necessary to achieve inhibition of enzyme activity by 50% (IC50) was calculated using concentrations ranging from 20 μM to 0.1 nM (12-point curve). IC50 values were determined using a nonlinear regression model available in GraphPad Prism 5. PLpro Primary Assay The PLpro primary assay, which measures protease activity with the short peptide substrate Z-RLRGG-AMC (Bachem), was performed in black flat-bottom 384-well plates containing a final reaction volume of 50 uL. The assays were assembled at room temperature as follows: 40 uL of 50 nM PLpro in buffer B (50 mM HEPES, pH 7.5, 0.1 mg/mL BSA, 0.01% Triton-X 100, and 5 mM DTT) was dispensed into wells containing 0.1−1 uL of inhibitor in DMSO or appropriate controls. The enzyme was incubated with inhibitor for 10 min prior to substrate addition. Reactions were initiated with 10 uL of 62.5 uM RLRGG-AMC in buffer B. Plates were shaken vigorously for 30 s, and fluorescence from the release of AMC from peptide was monitored continuously for 15 min on a Tecan Infinite M200 Pro plate reader (λexcitation = 360 nm; λemission = 460 nm). Slopes from the linear portions of each progress curve were recorded and normalized to plate-based controls. Positive control wells, representing 100% inhibition, included 10 uM GRL0617; negative control wells, representing 0% inhibition, included the vehicle. The selectivity of the most potent inhibitors was tested against the human deubiquitinating enzymes USP7 and USP14 (Boston Biochem). Assay conditions were similar to the PLpro primary assay, with the following substitutions: USP7 assays contained 4 nM USP7 and 0.5 uM Ub-AMC (Boston Biochem); USP14 assays contained 1.7 uM USP14, 4 uM Ub-AMC, and the addition of 5% glycerol to buffer B. PLpro activity with ISG15-AMC and Ub-AMC were assayed in a manner similar to the PLpro primary assay. PLpro and substrate concentrations were modified as follows: 80 nM PLpro was assayed with 0.5 uM Ub-AMC, and 4 nM PLpro was assayed with 0.5 uM ISG15-AMC. In Vitro Inhibitory Activity Against PD-1/PD-L1 Binding The experiment process was carried out according to the flow required in the operating manual of the test reagent.The process was as follows:(1) Experiment preparation: A test compound was diluted to different concentration gradients with the dilution buffer (the highest final concentration in a 20 μL final reaction system was 10 μM). The His-PD-1 protein was diluted to 800 nM (the final concentration in the 20 final reaction system was 100 nM). The PD-L1-Fc fusion protein was diluted to 16 nM (the final concentration was 2 nM). The anti-His-XL665 antibody and the anti-hFc-Eu3+ antibody were diluted 20 times and 100 times respectively with the detection buffer according to reagent requirements.(2) First, 5 μL of the test compound, 2.5 μL of the PD-L1-Fc fusion protein and 2.5 μL of the His-PD-1 protein solution were well mixed and incubated at room temperature for 15 min; then, 5 μL of the anti-His-XL665 antibody and 5 μL of the anti-hFc-Eu3+ antibody were added to the system and further incubated for 3 h before test.(3) During the test reaction, control groups were set, including a 0% inhibition positive control without adding the test compound and a 100% inhibition negative control without adding the PD-1 protein. All tests were conducted by use of multiple holes.(4) The fluorescence detector Tecan (Spark 10M) was used to detect the fluorescence signal of each hole. The excitation wavelength was 320 nm, and the emission wavelengths for detection were 620 nm and 665 nm, respectively. The strength of PD-1/PD-L1 binding refers to a fluorescence signal ratio Em665/Em620.(5) Calculation formula of binding inhibition rate of test compound: Inhibition rate (%)=[1−(fluorescence signal ratio of detected hole−fluorescence signal ratio of 100% inhibition negative control)]/(fluorescence signal ratio of 0% inhibition positive control−fluorescence signal ratio of 100% inhibition negative control)×100%. The 50% inhibition concentration (IC50) was calculated after the PD-1/PD-L1 binding inhibition rates of the test compound with different concentration gradients were calculated respectively. LSD1 Assay The compounds of the invention can be tested for their ability to inhibit LSD1. The ability of the compounds of the invention to inhibit LSD1 can be tested as follows. Human recombinant LSD1 protein was purchased from BPS Bioscience Inc. In order to monitor LSD1 enzymatic activity and/or its inhibition rate by our inhibitor(s) of interest, di-methylated H3-K4 peptide (Millipore) was chosen as a substrate. The demethylase activity was estimated, under aerobic conditions, by measuring the release of H2O2 produced during the catalytic process, using the Amplex Red peroxide/peroxidase-coupled assay kit (Invitrogen).Briefly, a fixed amount of LSD1 was incubated on ice for 15 minutes, in the absence and/or in the presence of various concentrations of inhibitor (e.g., from 0 to 75 μM, depending on the inhibitor strength). Tranylcypromine (Biomol International) was used as a control for inhibition. Within the experiment, each concentration of inhibitor was tested in triplicate. After leaving the enzyme interacting with the inhibitor, 12.5 μM of di-methylated H3-K4 peptide was added to each reaction and the experiment was left for 1 hour at 37° C. in the dark. The enzymatic reactions were set up in a 50 mM sodium phosphate, pH 7.4 buffer. At the end of the incubation, Amplex Red reagent and horseradish peroxidase (HPR) solution were added to the reaction according to the recommendations provided by the supplier (Invitrogen), and left to incubate for 30 extra minutes at room temperature in the dark. A 1 μM H2O2 solution was used as a control of the kit efficiency. The conversion of the Amplex Red reagent to resorufin due to the presence of H2O2 in the assay, was monitored by fluorescence (excitation at 540 nm, emission at 590 nm) using a microplate reader (Infinite 200, Tecan). Arbitrary units were used to measure level of H2O2 produced in the absence and/or in the presence of inhibitor.The maximum demethylase activity of LSD1 was obtained in the absence of inhibitor and corrected for background fluorescence in the absence of LSD1. The Ki (IC50) of each inhibitor was estimated at half of the maximum activity. Monoamine Oxidase Assays for Determining the Selectivity of the Compounds of the Invention for LSD1 Human recombinant monoamine oxidase proteins MAO-A and MAO-B were purchased from Sigma Aldrich. MAOs catalyze the oxidative deamination of primary, secondary and tertiary amines. In order to monitor MAO enzymatic activities and/or their inhibition rate by inhibitor(s) of interest, a fluorescent-based (inhibitor)-screening assay was set up. 3-(2-Aminophenyl)-3-oxopropanamine (kynuramine dihydrobromide, Sigma Aldrich), a non fluorescent compound was chosen as a substrate. Kynuramine is a non-specific substrate for both MAOs activities. While undergoing oxidative deamination by MAO activities, kynuramine is converted into 4-hydroxyquinoline (4-HQ), a resulting fluorescent product.The monoamine oxidase activity was estimated by measuring the conversion of kynuramine into 4-hydroxyquinoline. Assays were conducted in 96-well black plates with clear bottom (Corning) in a final volume of 100 μL. The assay buffer was 100 mM HEPES, pH 7.5. Each experiment was performed in triplicate within the same experiment.Briefly, a fixed amount of MAO (0.25 μg for MAO-A and 0.5 μg for MAO-B) was incubated on ice for 15 minutes in the reaction buffer, in the absence and/or in the presence of various concentrations of inhibitor (e.g., from 0 to 50 μM, depending on the inhibitor strength). Tranylcypromine (Biomol International) was used as a control for inhibition.After leaving the enzyme(s) interacting with the inhibitor, 60 to 90 μM of kynuramine was added to each reaction for MAO-B and MAO-A assay respectively, and the reaction was left for 1 hour at 37° C. in the dark. The oxidative deamination of the substrate was stopped by adding 50 μL (v/v) of NaOH 2N. The conversion of kynuramine to 4-hydroxyquinoline, was monitored by fluorescence (excitation at 320 nm, emission at 360 nm) using a microplate reader (Infinite 200, Tecan). Arbitrary units were used to measure levels of fluorescence produced in the absence and/or in the presence of inhibitor.The maximum of oxidative deamination activity was obtained by measuring the amount of 4-hydroxyquinoline formed from kynuramine deamination in the absence of inhibitor and corrected for background fluorescence in the absence of MAO enzymes. Biochemical Assay Preferably, for the screening method above cited, both the PARP protein and the 5H-phenanthridin-6-one-derived probe of formula (IP) are pre-mixed, or the PARP protein and the test compound are pre-mixed. In a further preferred screening method, the PARP proteins are PARP-1, PARP-2 and PARP-3. The term PARP protein encompasses full-length native proteins as well as fragments thereof. More preferably, R11 is hydrogen or methyl, m is 0 or 1; when m is 1, n is 3 or 6, X′″ is trifluoroacetate. The 5H-phenanthridin-6-one-derived probe (IP) was selected for its capability of binding to the PARP proteins, both encompassing full-length native proteins and fragments thereof.The polarization signal can be measured, e.g., by a plate reader such as the Saphire2 (Tecan). Data analysis was performed, e.g., by using the Dynafit software. Displacement data were also fitted, e.g., by using Excel spreadsheet (Microsoft Inc. Seattle, USA) to a four parameter logistic model (4PL), or Hill-Slope model. The assay was used to test compounds of the present invention. The displacement ability of the test compounds of formula (I) is in correlation with the compounds affinity for the NAD pocket of the enzyme. Specific probes of formula (IP) used in the assay are: P1. 9-Dimethylamino-11,11-dimethyl-1-(3-{methyl-[(6-oxo-5,6-dihydro-phenanthridin-2-ylcarbamoyl)-methyl]-carbamoyl}-propyl-2,3,4,11-tetrahydro-naphtho[2,3-g]quinolinium trifluoroacetate; P2. 9-Dimethylamino-11,11-dimethyl-1-[3-(3-{[(6-oxo-5,6-dihydro-phenanthridin-2-ylcarbamoyl)-methyl]-amino}-propylcarbamoyl)-propyl])-2,3,4,11-tetrahydro-naphtho[2,3-g]quinolinium trifluoroacetate; P3. 9-Dimethylamino-11,11-dimethyl-1-[3-(6-{[(6-oxo-5,6-dihydro-phenanthridin-2-ylcarbamoyl)-methyl]-amino}-hexylcarbamoyl)-propyl]-2,3,4,11-tetrahydro-naphtho[2,3-g]quinolinium trifluoroacetate.A compound of formula (IP) as defined above can be prepared as described in WO 2010/133647.The assay is based on the use of a probe of formula (IP) that binds to the NAD binding pocket and takes advantage of the significant change in the polarization signal observed upon binding of the probe to PARP-1, -2 and -3. The ability of the probe of formula (IP) to bind full-length PARP-1, -2 and -3 has been previously reported (WO 2010/133647). The assay has been validated as described in WO 2010/133647. In Vitro M4 &M2 Functional Assay The functional activity of compounds at the M4 and M2 receptors was determined by measuring changes in the level of intracellular calcium ions caused by signalling cascades mediated by the receptor. Intracellular Calcium levels were measured using a calcium sensitive fluorescent dye, calcium 5 (Molecular Devices) The changes in fluorescence were monitored by a fluorescent imager, FLiPR Tetra (Molecular devices). Increases in intracellular calcium were readily detected upon activation of both receptors by the muscarinic receptor agonist Acetylcholine.CHOK1 cells stably expressing human M4 or M2 receptor and co-expressing the accessory g-protein Gα16 were routinely grown as monolayers in Hams-F12 medium (Invitrogen) supplemented with 10% foetal bovine serum (FBS) (Hyclone), 500 ug/mL Geneticin and 250 ug/mL zeocin (both invitrogen) in 5% CO2 at 37° C. Once confluent is cells cryopreserved by freezing at −186° C. in freezing solution (90% FBS 10% DMSO) (Sigma-Aldrich Co.). Twenty-four hours prior to testing cells resuscitated and freezing media removed via centrifugation, cells then seeded in a black walled clear bottom 384 well plates (Corning) at a density of 15,000 cells/well in Hams F12 media supplemented with 10% FBS. On the day of assay, growth media was removed and replaced with 63 μl of Calcium 5 dye solution (Molecular Devices) in assay buffer (HBSS, 20 mM HEPES, 0.1% BSA, 1 mM Probenecid pH7.4 (Sigma-Aldrich Co.)) per well (each vial of Calcium 5 resuspended in 27 mL of assay buffer). Cells were then incubated for 45 minutes at 37° C., 5% CO2. Compound was serially diluted in DMSO (log/half log) before being diluted 1:20 with assay buffer. 7 μl of compound diluted in assay buffer was then added to cells on FLiPR tetra and fluorescence intensity measured for 5 minutes. EC50 values for compounds were determined from ten point half log scale dose-response studies and represent the concentration of compound required to prevent 50% inhibition of its own maximal response. Curves were generated using the average of duplicate wells for each data point and analyzed using non-linear regression of four parameter dose response. Percentage Relative efficacy (RE) to an EC100 concentration of acetylcholine was reported for all compounds. The results are set out in Table 3 below in which the term No Response means that there was no significant response of calcium flux in the assay indicative of agonism. Biological Assay Reaction buffers used for the lipoxygenase assay were as follows: 25 mM HEPES (pH 7.5), with 0.01% Triton X-100. 1 mM 12-HPETE or 1 mM 15-HPETE stock solution was prepared in 25 mM HEPES with 0.01% Triton X-100.The standard curve of 12-HPETE was made by serial dilution of 0, 6.25, 12.5, 25, 50, 75 and 100 μM, and the final reaction volume in 96 Well Clear Flat Bottom UV-Transparent Microplate is 100 μL. The absorbance of the 12-HPETE at each concentration was measured at 234 nm.The standard curve of 15-HPETE was made by serial dilution of 0, 3.125, 6.25, 12.5, 25, 50 and 100 μM, and the final reaction volume in 96 Well Clear Flat Bottom UV-Transparent Microplate is 100 μL. The absorbance of the 12-HPETE at each concentration was measured at 234 nm.[0453]IC50 values were obtained by determining the % inhibition at various inhibitor concentrations. The final concentrations of the control inhibitors and test compounds in the IC50 determination assay are 0, 0.03, 0.1, 0.3, 1, 3, 10 and 20 μM. The final concentration of DMSO in the assay is 0.05%.12-LOX IC50 determination. The 12-LOX enzyme and AA were diluted in the HEPES buffer to 120 nM and 200 μM, respectively. Pre-incubation 50 μL of indicated test compounds and 25 μL 120 nM enzyme at room temperature for 5 min. The reaction is started by adding 25 μL 200 μM AA. After a short spin (1000 rpm, 15 s), incubate the reaction system for 5 min. The blank control was set by adding 25 μL HEPES to 50 μL of control inhibitor compound (MHL355) and 25 μL 200 μM AA. The final concentrations of 12-LOX enzyme and AA were 30 nM and 50 μM, respectively. The absorbance of the 12-HPETE at 234 nm was measured. In Vitro Measure of Sodium Channel Blocking Activity and Reversibility One assay used to assess mechanism of action and/or potency of the compounds of the present invention involves the determination of lumenal drug inhibition of airway epithelial sodium currents measured under short circuit current (ISC) using airway epithelial monolayers mounted in Using chambers. This assay is described in detail in Hirsh, A. J., Zhang, J., Zamurs, A., et al. Pharmacological properties of N-(3,5-diamino-6-chloropyrazine-2-carbonyl)-N′-4-[4-(2,3-dihydroxypropoxy)phenyl]butyl-guanidine methanesulfonate (552-02), a novel epithelial sodium channel blocker with potential clinical efficacy for CF lung disease. J. Pharmacol. Exp. Ther. 2008; 325(1): 77-88. Cells obtained from freshly excised human, dog, sheep or rodent airways are seeded onto porous 0.4 micron Snapwell Inserts (CoStar), cultured at air-liquid interface (ALI) conditions in hormonally defined media, and assayed for sodium transport activity (ISC) while bathed in Krebs Bicarbonate Ringer (KBR) in Using chambers. All test drug additions are to the lumenal bath with half-log dose addition protocols (from 1×10⁻¹¹ M to 3×10⁻⁵ M), and the cumulative change in ISC (inhibition) recorded. All drugs are prepared in dimethyl sulfoxide as stock solutions at a concentration of 1×10⁻² M and stored at −20° C. Eight preparations are typically run in parallel; two preparations per run incorporate amiloride and/or benzamil as positive controls. After the maximal concentration (5×10⁻⁵ M) is administered, the lumenal bath is exchanged three times with fresh drug-free KBR solution, and the resultant ISC measured after each wash for approximately 5 minutes in duration. Reversibility is defined as the percent return to the baseline value for sodium current after the third wash. All data from the voltage clamps are collected via a computer interface and analyzed off-line.Dose-effect relationships for all compounds are considered and analyzed by the Prism 3.0 program. IC50 values, maximal effective concentrations, and reversibility are calculated and compared to amiloride and benzamil as positive controls. PRMT5-MEP50 Enzyme Methylation Assay 1 PRMT5/MEP50 biochemical assay is a direct measurement of the methylation activity of the enzyme complex on a short peptide substrate derived from the N-terminus of H4 histone. Methylation experiment is performed with recombinant protein. The assessment of inhibitory effect (IC50) of small molecules is measured by the effectiveness of the compounds to inhibit this reaction.In this assay, the potency (IC50) of each compound was determined from a twenty-point (1:2 serial dilution; top compound concentration of 100000 nM) titration curve using the following outlined procedure. To each well of a white ProxiPlus 384 well-plate, 100 nL of compound (1% DMSO in final assay volume of 10 μL) was dispensed, followed by the addition of 8 μL of 1× assay buffer (50 mM Bicine pH 8.0, 1 mM DTT, 0.004% Tween20, 0.01% BSA) containing 0.5 nM of Full-length (FL)-PRMT5-MEP50 enzyme complex (recombinant proteins from baculovirus-transfected Sf21 cells: FL-PRMT5; MW=73837 kDa). Plates were sealed and placed in a 37° C. humidified chamber for 30 minutes pre-incubation with compounds. Subsequently, each reaction was initiated by the addition of 2 μL 1× assay buffer containing 75 nM biotinylated H4R3(Me1) peptide, and 15 μM S-(5′-Adenosyl)-L-Methionine Chloride (SAM). The final reaction in each well of 10 μL consists of 0.5 nM PRMT5-MEP50, 75 nM biotinylated-peptide, and 15 μM. Methylation reactions were allowed to proceed for 150 minutes in a sealed plate at 37° C. Reactions were immediately quenched by the addition of 1 μL of 10% formic acid. Plates were then frozen and shipped to SAMDI Tech Inc. to determine the percent conversion from K4R3(Me1) to K4R3(Me2). IC50 values were determined by 7 parameters biphasic fit model plotting the percent product conversion vs. (Log10) compound concentrations. PRMT5-MEP50 Enzyme Methylation Assay 2 PRMT5/MEP50 biochemical assay is a direct measurement of the methylation activity of the enzyme complex on a short peptide substrate derived from the N-terminus of H4 histone. Methylation experiment is performed with recombinant protein. The assessment of inhibitory effect (IC50) of small molecules is measured by the effectiveness of the compounds to inhibit this reaction.In this assay, the potency (IC50) of each compound was determined from a twenty-point (1:2 serial dilution; top compound concentration of 100000 nM) titration curve using the following outlined procedure. To each well of a white ProxiPlus 384 well-plate, 100 nL of compound (1% DMSO in final assay volume of 10 μL) was dispensed, followed by the addition of 8 μL of 1× assay buffer (50 mM Bicine pH 8.0, 1 mM DTT, 0.004% Tween20, 0.01% BSA) containing 0.5 nM of Full-length (FL)-PRMT5-MEP50 enzyme complex (recombinant proteins from baculovirus-transfected Sf21 cells: FL-MEP50; MW=38614). Plates were sealed and placed in a 37° C. humidified chamber for 30 minutes pre-incubation with compounds. Subsequently, each reaction was initiated by the addition of 2 μL 1× assay buffer containing 75 nM biotinylated H4R3(Me1) peptide, and 15 μM S-(5′-Adenosyl)-L-Methionine Chloride (SAM). The final reaction in each well of 10 μL consists of 0.5 nM PRMT5-MEP50, 75 nM biotinylated-peptide, and 15 μM. Methylation reactions were allowed to proceed for 150 minutes in a sealed plate at 37° C. Reactions were immediately quenched by the addition of 1 μL of 10% formic acid. Plates were then frozen and shipped to SAMDI Tech Inc. to determine the percent conversion from K4R3(Me1) to K4R3(Me2). IC50 values were determined by 7 parameters biphasic fit model plotting the percent product conversion vs. (Log10) compound concentrations. Biological Assay The compounds of the invention can be tested for their ability to inhibit LSD1. The ability of the compounds of the invention to inhibit LSD1 can be tested as follows. Human recombinant LSD1 protein was purchased from BPS Bioscience Inc (catalog reference number 50100: human recombinant LSD1, GenBank accession no. NM_015013, amino acids 158-end with N-terminal GST tag, MW: 103 kDa). In order to monitor LSD1 enzymatic activity and/or its inhibition rate by our inhibitor(s) of interest, di-methylated H3-K4 peptide (Anaspec) was chosen as a substrate. The demethylase activity was estimated, under aerobic conditions, by measuring the release of H2O2 produced during the catalytic process, using the Amplex Red hydrogen peroxide/peroxidase assay kit (Invitrogen).Briefly, a fixed amount of LSD1 was incubated on ice for 15 minutes, in the absence and/or in the presence of at least eight 3-fold serial dilutions of the respective inhibitor (e.g., from 0 to 75 uM, depending on the inhibitor strength). Tranylcypromine (Biomol International) was used as a control for inhibition. Within the experiment, each concentration of inhibitor was tested in duplicate. After leaving the enzyme interacting with the inhibitor, KM of di-methylated H3-K4 peptide was added to each reaction and the experiment was left for 30 minutes at 37° C. in the dark. The enzymatic reactions were set up in a 50 mM sodium phosphate, pH 7.4 buffer. At the end of the incubation, Amplex Red reagent and horseradish peroxidase (HPR) solution were added to the reaction according to the recommendations provided by the supplier (Invitrogen), and left to incubate for 5 extra minutes at room temperature in the dark. A 1 uM H2O2 solution was used as a control of the kit efficiency. The conversion of the Amplex Red reagent to resorufin due to the presence of H2O2 in the assay, was monitored by fluorescence (excitation at 540 nm, emission at 590 nm) using a microplate reader (Infinite 200, Tecan). Arbitrary units were used to measure level of H2O2 produced in the absence and/or in the presence of inhibitor. The maximum demethylase activity of LSD1 was obtained in the absence of inhibitor and corrected for background fluorescence in the absence of LSD1. The IC50 value of each inhibitor was calculated with GraphPad Prism Software. Biological Assay The compounds of the invention can be tested for their ability to inhibit LSD1. The ability of the compounds of the invention to inhibit LSD1 can be tested as follows. Human recombinant LSD1 protein was purchased from BPS Bioscience Inc (catalog reference number 50100: human recombinant LSD1, GenBank accession no. NM_015013, amino acids 158-end with N-terminal GST tag, MW: 103 kDa). In order to monitor LSD1 enzymatic activity and/or its inhibition rate by our inhibitor(s) of interest, di-methylated H3-K4 peptide (Anaspec) was chosen as a substrate. The demethylase activity was estimated, under aerobic conditions, by measuring the release of H2O2 produced during the catalytic process, using the Amplex Red hydrogen peroxide/peroxidase assay kit (Invitrogen).Briefly, a fixed amount of LSD1 was incubated on ice for 15 minutes, in the absence and/or in the presence of at least eight 3-fold serial dilutions of the respective test compound (e.g., from 0 to 75 uM, depending on the inhibitor strength). Tranylcypromine (Biomol International) was used as a control for inhibition. Within the experiment, each concentration of inhibitor was tested in duplicate. After leaving the enzyme interacting with the inhibitor, KM of di-methylated H3-K4 peptide was added to each reaction and the experiment was left for 30 minutes at 37° C. In the dark. The enzymatic reactions were set up in a 50 mM sodium phosphate, pH 7.4 buffer. At the end of the incubation, Amplex Red reagent and horseradish peroxidase (HPR) solution were added to the reaction according to the recommendations provided by the supplier (Invitrogen), and left to incubate for 5 extra minutes at room temperature in the dark. A 1 uM H2O2 solution was used as a control of the kit efficiency. The conversion of the Amplex Red reagent to resorufin due to the presence of H2O2 in the assay, was monitored by fluorescence (excitation at 540 nm, emission at 590 nm) using a microplate reader (Infinite 200, Tecan). Arbitrary units were used to measure level of H2O2 produced in the absence and/or in the presence of inhibitor. The maximum demethylase activity of LSD1 was obtained in the absence of inhibitor and corrected for background fluorescence in the absence of LSD1. The IC50 value of each inhibitor was calculated with GraphPad Prism Software. Inhibition of LSD1 The compounds of the invention can be tested for their ability to inhibit LSD1. The ability of the compounds of the invention to inhibit LSD1 can be tested as follows. Human recombinant LSD1 protein was purchased from BPS Bioscience Inc (catalog reference number 50100: human recombinant LSD1, GenBank accession no. NM_015013, amino acids 158-end with N-terminal GST tag, MW: 103 kDa). In order to monitor LSD1 enzymatic activity and/or its inhibition rate by our inhibitor(s) of interest, di-methylated H3-K4 peptide (Anaspec) was chosen as a substrate. The demethylase activity was estimated, under aerobic conditions, by measuring the release of H2O2 produced during the catalytic process, using the Amplex Red hydrogen peroxide/peroxidase assay kit (Invitrogen).Briefly, a fixed amount of LSD1 was incubated on ice for 15 minutes, in the absence and/or in the presence of at least eight 3-fold serial dilutions of the respective test compound (e.g., from 0 to 75 μM, depending on the inhibitor strength). Tranylcypromine (Biomol International) was used as a control for inhibition. Within the experiment, each concentration of inhibitor was tested in duplicate. After leaving the enzyme interacting with the inhibitor, KM of di-methylated H3-K4 peptide was added to each reaction and the experiment was left for 30 minutes at 37° C. in the dark. The enzymatic reactions were set up in a 50 mM sodium phosphate, pH 7.4 buffer. At the end of the incubation, Amplex Red reagent and horseradish peroxidase (HPR) solution were added to the reaction according to the recommendations provided by the supplier (Invitrogen), and left to incubate for 5 extra minutes at room temperature in the dark. A 1 μM H2O2 solution was used as a control of the kit efficiency. The conversion of the Amplex Red reagent to resorufin due to the presence of H2O2 in the assay, was monitored by fluorescence (excitation at 540 nm, emission at 590 nm) using a microplate reader (Infinite 200, Tecan). Arbitrary units were used to measure level of H2O2 produced in the absence and/or in the presence of inhibitor.The maximum demethylase activity of LSD1 was obtained in the absence of inhibitor and corrected for background fluorescence in the absence of LSD1. The IC50 value of each inhibitor was calculated with GraphPad Prism Software. Bioactivity Assay Preparation and Treatment. Stock Solution Preparation. A 10 mM DMSO stock solution was formulated for each compound. A 30 mM DMSO stock solution was formulated for positive control HA130. Preservation: The DMSO stock solutions were stored at room temperature in a desiccator for a short period of time or at −20° C. for a long period of time. Preparation All compounds were serially 3-fold diluted in DMSO from 10 μM to the 10th concentration.A 1000× positive control (10 mM, HA130) and a 1000× negative control (100% DMSO) were prepared. The plates were shaken for 5 min. Preparation of 1× Reaction Buffer:>5× reaction buffer and cold water were mixed well in a volume ratio of 1:4. Preparation of 20 U/mL Choline Oxidase Stock Solution:1 tube of choline oxide in a kit was dissolved in 1× reaction buffer. The aliquots were frozen at −20° C. Preparation of 200 U/mL Horseradish Peroxidase (HRP) Stock Solution:1 tube of HRP in a kit was dissolved in 1 mL of 1× reaction buffer. The aliquots were frozen at −20° C. Preparation of 20 mM Amplex Red Reagent (for Detection) Stock Solution Amplex Red reagent and DMSO were equilibrated at room temperature. 1 tube of Amplex Red reagent in a kit was dissolved in 200 μL of DMSO.Detection: a) 2×ATX (2 ng/L), 2×HRP (2 U/L), 2× choline oxidase (0.2 U/mL) were added to 1× reaction buffer. b) 20 μL of the reaction mixture was added to the plate (PE, 6007270) (refer to step a). c) 40 nL of diluent was added to the plate using Echo (refer to Preparation ). d) 2×LPC (16:0) (60 mM) and 2× Amplex Red (400 M) were prepared using 1× reaction buffer. e) 20 μL of the mixture was added to the plate (refer to step d). f) The plate was shaken for 30 s and allowed to stand at room temperature for 30 min. g) The plate was examined using Envision, and the procedure was as follows: Excitation at 530 nm; and Emission at 590 nm. SPR Binding Assay All binding assays were performed on a ProteOn XPR36 SPR Protein Interaction Array System (Bio-Rad Laboratories, Hercules, CA, USA). The instrument temperature was set at 25° C. for all kinetic analyses. ProteOn GLH sensor chips were preconditioned with two short pulses each (10 s) of 50 mM NaOH, 100 mM HCl, and 0.5% sodium dodecyl sulfide. Then the system was equilibrated with running buffer (1×PBS pH 7.4, 3% DMSO and 0.005% polysorbate 20). The surface of a GLH sensor chip was activated with a 1:100 dilution of a 1:1 mixture of 1-ethyl-3-(3-dimethylaminopropyl) carbodiimide hydrochloride (0.2 M) and sulfo-N-hydroxysuccinimide (0.05 M). Immediately after chip activation, the HIV-1 CA protein constructs were prepared at a concentration of 10 μg/mL in 10 mM sodium acetate, pH 5.5, and injected across ligand flow channels for 5 min at a flow rate of 30 μL/min. Then, after unreacted protein had been washed out, excess active ester groups on the sensor surface were capped by a 5 min injection of 1M ethanolamine HCl (pH 8.0) at a flow rate of 5 μL/min. A reference surface was similarly created by immobilizing a nonspecific protein (IgG b12 anti-HIV-1 gp120; was obtained through the NIH AIDS Reagent Program, Division of AIDS, NIAID, NIH: Anti-HIV-1 gp120 Monoclonal (IgG1 b12) from Dr. Dennis Burton and Carlos Barbas) and was used as a background to correct nonspecific binding. Serial dilutions of hACSS-2 inhibitors were then prepared in the running buffer and injected at a flow rate of 100 μL/min, for a 50 s association phase, followed by up to a 5 min dissociation phase using the “one-shot kinetics” capability of the ProteOn instrument. Data were analyzed using the ProteOn Manager Software version 3.0 (Bio-Rad). The responses from the reference flow cell were subtracted to account for the nonspecific binding and injection artifacts. Experimental data were fitted to a simple 1:1 binding model. Experiments were performed in triplicate to detect kinetic and equilibrium dissociation constants (KD). Assay on TRPM8 Modulators A test comparable with that previously described in the literature by Behrendt H. J. et al., Br. J. Pharmacol. 141, 2004, 737-745, is carried out. The agonisation or antagonisation of the receptor can be quantified by means of a Ca2+-sensitive dye (e.g. FURA, Fluo-4, etc.). Agonists on their own bring about an increase in the Ca2+-signal; antagonists in the presence of, for example, menthol bring about a reduction in the Ca2+-signal (in each case detected by means of the Fluo-4 dye, which due to the Ca2+ has other fluorescent properties).To begin with, in a manner known per se, in cell culture flasks a fresh culture of transformed HEK cells is prepared. The HEK293-TRPM8 test cells are removed using trypsin from the cell culture flasks and 40 000 cells/well are sown with 100 μl medium in 96-well plates (Greiner #655948 Poly-D-lysine coated). In order to induce the TRPM8 receptor the growth medium tetracycline is mixed in (DMEM/HG, 10% FCS tetracycline-free, 4 mM L-glutamine, 15 μg/ml blasticidin, 100 μg/ml hygromycin B, 1 μg/ml tetracycline). The next day the cells are charged with Fluo-4Am dye and the test is performed. The procedure is as follows: Addition of 100 μl/well of dye solution Ca-4 Kit (RB 141, Molecular Devices) per 100 μl of medium (DMEM/HG, 10% FCS tetracycline-free, 4 mM L-glutamine, 15 μg/ml blasticidin, 100 μg/ml hygromycin B, 1 μg/ml tetracycline). Incubation in the incubator for 30 minutes/37° C./5% CO2, 30 minutes/RT. Preparation of the test substances (different concentrations in 200 μl HBSS buffer), and of positive controls (different concentrations of menthol or icilin or ionomycin in 200 μl HBSS buffer) and negative controls (just 200 μl of HBSS buffer). Addition of the test substances in quantities of 50 μl/well and measurement of the change in fluorescence (e.g. in the FLIPR assay device, Molecular Devices or NovoStar, BMG) at 485 nm excitation, 520 nm emission, and evaluation of the effective strength of the various substances/concentrations and determination of the EC50 values.The test substances are used in triplicate in concentrations of between 0.1 and 200 μm in the assay. Normally the compounds are kept ready in DMSO solutions and diluted for the assay to a maximum DMSO concentration of 2%. LSD1 In Vitro Activity Assay Screening method: lysine-specific demethylase 1 (LSD1) activity screeningInstrument: microplate reader Envision (PerkinElmer, USA).MATERIALS: Human recombinant LSD1, the LSD1 protein fragment fused with GST (aa158-end) was expressed and purified by E. coli expression system by the laboratory in house.LSD1 Activity Detection Kit LANCE Ultra LSD1 Histone H3-Lysine 4 Demethylase Assay was purchased from Perkin Elmer;The H3 polypeptide substrate ARTK(me1)QTARKSTGGKAPRKQLA-GG-K(Biotin)-NH2 was synthesized by Jill Biochemical Company.Principle: LSD1 specifically removes the methylation modification at the K4 lysine on the H3 polypeptide substrate, making it a substrate without methylation modification. The method employs a histone H3 methylated polypeptide (1-24) as a substrate to introduce a biotin label in the C segment of the substrate. LSD1 initiates the reaction with the participation of FAD to remve the methylation modification on the substrate H3K4. The Eu-labeled H3K4 background antibody binds to the substrate by antigen-antibody reaction, while the streptavidin-labeled receptor is bounded by the specific interaction of streptavidin and biotin. This allows the Eu-labeled donor to interact with the streptavidin-labeled receptor. In fluorescence resonance energy transfer, when two fluorophores are brought close due to biomolecular interaction, part of the energy captured by the cryptate at the time of excitation will be released, the emission wavelength of which is 620 nm; the other part of the energy is transferred to the receptor (acceptor), the emission wavelength of which is 665 nm. The 665 nm emission is only produced by FRET caused by the donor. Therefore, when biomolecules interact, there are two excitation lights at 620 nm and 665 nm; when there is no interaction, there is only one excitation light at 620 nm. The LSD1 demethylation activity was reflected by detecting the ratio of the fluorescence signals at the two emission wavelengths of 665 nm and 620 nm. Meanwhile, a blank control was set to determine the strength of the enzyme activity. ORY-1001 and GSK-2879552 were employed as positive inhibitors in the experiment.Sample processing: Samples were dissolved in DMSO, stored at low temperature, and the concentration of DMSO in the final system was controlled within a range that won't affect the activity of the assay.The activity of the sample was tested by primary screening at a single concentration, for example 20 μM. For samples exhibiting activity under certain conditions, for example, the inhibition rate (% Inhibition) being greater than 50, the active dose-dependent relationship, i.e., the IC50 value, was obtained by nonlinearly fitting the sample activity vs sample concentration, the software used for the calculation was Graphpad Prism 5, the model used for fitting was sigmoidal dose-response (variable slope), and for most inhibitor screening models, the bottom and top of the fitted curve were set to 0 and 100. Assay of Co-Activator Recruitment by TR-FRET The activity of compound of the invention can be determined by a co-activator recruitment by TR-FRET (time-resolved fluorescence resonance energy transfer) assay. In general, the assay is based on the interaction between N-terminally Six-Histidine-tagged-RORC2 ligand binding domain (6-His-RORC2 LBD), expressed in E. coli and purified by affinity chromatography, and biotin-coactivator peptide SRC1-2 (biotin-aminohexanoic acid-CPSSHSSLTERHKILHRLLQEGSPS-NH2; SEQ ID NO: 1) containing the LXXLL (SEQ ID NO: 2) consensus domain which is responsible for receptor binding. This interaction is detected by addition of Europium labeled-anti-His antibody (Ex. 337 nm, Em. 620 nm, which binds to 6His) and Streptavidin-APC (Ex. 620 nm, Em. 665 nm, which binds to biotin). When receptor and coactivator are bound to each other, upon shining light at 337 nm on the sample, the Europium emits fluorescence that excites APC due to close proximity (FRET) and this signal is measured at 665 nm. Due to the long lasting fluorescence emission of Europium, the non-specific, short-lived fluorescence is time-resolved (TR) from the fluorescence of interest. Inhibitors of the interaction of receptor and coactivator peptide are detected by a decrease in TR-FRET signal.Specifically, in one embodiment the aforementioned assay was performed as outlined below. The assay was carried out in black polystyrene, 384-well plates in a total assay volume of 50.5 μL. The assay buffer contained 50 mM TRIS-HCL pH 7.5, 1 mM NaCl, 2 mM MgCl2, 0.5 mg/mL bovine serum albumin, and 5 mM dithiothreitol. The final concentration of reagents was 6.3 nM RORC2 LBD, 200 nM SRC1-2, 50 nM streptavidin APC, 1 nM Europium-labeled anti-His antibody, and varying concentrations of compounds such that final concentration of DMSO is 1% (v/v). The assay steps were: (1) dispensing 500 μL compound at 100× final concentration in DMSO (test wells) or DMSO only (control wells for no inhibition); and (2) dispensing 50 μL mixture of the other assay components including receptor (test wells) or excluding receptor (control wells for maximal inhibition).Assay mixtures were incubated are room temperature for 3 hr and read in EnVision 2100 Multilabel Reader (PerkinElmer Life Sciences) at Excitation Filter 320, Emission Europium Filter 615, Emission APC Filter 665, Dichroic Mirror D400/D630. In Vitro Activity Assay Table 1: Experimental materials: target protein RORγ with the final concentration of 200 nM; experimental buffer (10×) MOPS (500 mM) PH 7.4, CHAPS (0.5 mM), NaF (500 mM), andBSA (1 mg/ml); donor microbeads in the kit with the final concentration of 5 μg/mL, and acceptor microbeads with the final concentration of 5 μg/mL; co-agonist of RORγ, short peptide bSRC1-4(Biotin-QKPTSGPQTPQAQQKSLLQQLLTE), with the final concentration of 50 nM. 150 μL of reaction system: RORγ 15 μL, experimental buffer 15 μL, deionized water 60 μL, small molecule compound 15 μL, donor microbeads 15 μL, and acceptor microbeads 15 μL; positive inhibitors T0901317 and UA.Experimental method: The protein, co-agonist (b-SRC1-4), 10× AlphaScreen buffer, and ultra-pure water were prepared into a mixed solution with the final volumes of 15 μL, 15 μL, 15 μL, and 60 μL, respectively (the final concentration ratio of protein to co-agonist is 200:50 nM). 105 μL of the mixed solution was added to each sample to be tested in a 96-well transparent plate. If the single-point inhibition rate of the compound was tested, the compound was diluted to the final concentration of 50 μM, and 15 μL of the diluted compound was added to each sample. If the IC50 value of the compound was tested, the compound was doubling diluted (to 200 to 0.075 μM), and 15 μL of the diluted compound was added to each sample (generally, in order to save manpower and material resources, a batch of new compounds were subjected to single-point preliminary screening, and then compounds with an inhibition rate of about 50% were tested for IC50 curves). The donor microbeads and acceptor microbeads in the final concentration of 5000 g/mL should be prepared to 5 g/mL, and in the green light environment, 30 μL of the mixed solution of the two microbeads was added to each well. The mixture was centrifuged at room temperature at 1000 rpm for 1 minute to make the system fully mixed. After being wrapped in tin foil, the mixture was incubated in the dark for 1.5 hours. After that, the mixture was transferred to a 384-well white opaque plate and put into an EnSpire Alpha 2390 multifunctional microplate reader to detect the inhibitory activity of the compound. Inhibitory Activities of Compounds on DNA-PK Kinase: ADP-Glo Kinase Assay (1) Preparation of 1× kinase buffer40 mM Tris, pH 7.50.0055% Brij-3520 mM MgCl20.05 mM DTT(2) Preparation of test compound1) The compound was dissolved in DMSO to yield a stock solution. Before the assay, the stock solution of the compound was diluted with DMSO to yield a 100× solution at a concentration that is 100 times a target concentration for assay. If the target concentration was M, the stock solution should be diluted to yield a 1 mM solution at this step.2) 100 μL of DMSO was added, respectively, into two blank wells in the same 96 well plate, corresponding to the total reaction control without compound and the blank control without enzyme.3) Preparation of test plate: 50 nL of the compound solution in each of the above wells was taken to a 384-well plate as a test plate.(3) Kinase reaction1) DNA-PK kinase was dissolved in 1× kinase buffer to yield a 2× enzyme solution that is twice the final concentration. 2.5 μL of the 2× enzyme solution was taken to each well of the test plate. The blank control without enzyme was added with 2.5 μL of the 1× kinase buffer instead of the enzyme solution. The test plate was shaken for mixing evenly.2) The substrate and ATP were dissolved in the 1× kinase buffer to yield a 2× substrate solution that is twice the final concentration. 2.5 μL of the 2× substrate solution was taken to each well of the test plate. The test plate was shaken for mixing evenly.3) Kinase reactionEach well of the test plate was covered and incubated at room temperature for 3 h.(4) Kinase detection1) The ADP-Glo reagent was equilibrated at room temperature.2) 5 μL of ADP-Glo reagent was added to each well of the test plate to terminate the reaction.3) The plate was centrifuged for a short time to mix evenly, shaken gently, and equilibrated for 120 min.4) 10 μL of kinase detection reagent was added to each well, with shaking for 1 min, after equilibrating for 30 min, fluorescence detection was performed.(5) Reading of the reaction wells(6) Calculation of inhibitory rates by means of curve fitting to the read values. Inhibitory Activities of Compounds on PI3Kα, PI3Kβ, PI3Kγ, and PI3Kδ Kinase: ADP-Glo Kinase Assay (1) Preparation of 1× kinase buffer50 mM HEPES, pH 7.53 mM MgCl21 mM EGTA100 mM NaCl0.03% CHAPS2 mM DTT(2) Preparation of test compound1) Dissolution and dilution of compound:The compound was dissolved in DMSO to yield a stock solution. Before the assay, the stock solution of the compound was diluted with DMSO in a 384-well plate to yield a 100× solution at a concentration that is 100 times a target concentration for assay.50 μL of DMSO was added, respectively, into two blank wells in the same 384 well plate, corresponding to the total reaction control without compound and the blank control without enzyme.2) Preparation of test plate: 50 nL of the compound solution in each of the above wells was taken to a test plate.(3) Kinase reaction1) PI3Kα, PI3Kβ, PI3Kγ, and PI3Kδ kinases were dissolved, respectively, in 1× kinase buffer to yield a 2× enzyme solution at a concentration that is twice the final concentration. 2.5 L of the 2× enzyme solution was taken to each well of the test plate. The blank control without enzyme was added with 2.5 μL of the 1× kinase buffer instead of the enzyme solution. The test plate was shaken for mixing evenly.2) PIP2 substrate and ATP were dissolved in the 1× kinase buffer to yield a 2× substrate solution that is twice the final concentration. 2.5 μL of the 2× substrate solution was taken to each well of the test plate. The test plate was shaken for mixing evenly.3) Kinase reactionEach well of the test plate was covered and incubated at room temperature for 1 h.(4) Kinase detection1) The ADP-Glo reagent was equilibrated at room temperature.2) 5 μL of ADP-Glo reagent was added to each well of the test plate to terminate the reaction.3) The plate was centrifuged for a short time to mix evenly, shaken gently, and equilibrated for 120 min.4) 10 μL of kinase detection reagent was added to each well, with shaking for 1 min, after equilibrating for 30 min, fluorescence detection was performed.(5) Reading of the reaction wells(6) Calculation of inhibitory rates by means of curve fitting to the read values Inhibitory Activities of Compounds on mTOR Kinase (1) Preparation of 1× kinase buffer50 mM HEPES, pH 7.51 mM EGTA0.01% Tween-20(2) Preparation of test compound1) The compound was dissolved in DMSO to yield a stock solution. Before the assay, the stock solution of the compound was diluted with DMSO to yield a 100× solution at a concentration that is 100 times a target concentration for assay. If the target concentration was M, the stock solution should be diluted to yield a 1 mM solution at this step.2) 100 μL of DMSO was added, respectively, into two blank wells in the same 96 well plate, corresponding to the total reaction control without compound and the blank control without enzyme.3) Preparation of intermediate sample plate: 4 μL of the 100× solution was added into a new 96-well plate, then 96 μL of the 1× kinase buffer was added, and the plate was shaken for 10 min for mixing evenly to serve as an intermediate sample plate.4) Preparation of test plate: 2.5 nL of the compound solution was taken from each well of the intermediate sample plate to a 384-well plate.(3) Kinase reaction1) The mTOR kinase was dissolved in the 1× kinase buffer to yield a 4× enzyme solution at a concentration that is 4 times the final concentration. 2.5 μL of the 2× enzyme solution was taken to each well of the test plate. The blank control without enzyme was added with 2.5 μL of the 1× kinase buffer instead of the enzyme solution. The test plate was shaken for mixing evenly.2) ULight-4E-BP1 polypeptide substrate and ATP were dissolved in the 1× kinase buffer to yield a 2× substrate solution at a concentration that is twice the final concentration. 5 L of the 2× substrate solution was taken to each well of the test plate. The test plate was shaken for mixing evenly.3) Kinase reaction:Each well of the test plate was covered and incubated at room temperature for 30 min.(4) Kinase detection1) The kinase quench buffer (EDTA) and Eu-anti-phospho-4E-BP1 antibody were formulated into a detection buffer at a concentration that is twice the final concentration. 10 μL of the detection buffer was added to each well of the test plate.2) The plate was centrifuged for a short time to mix evenly, shaken gently, and equilibrated at room temperature for 60 min.(5) Reading of the reaction wells(6) Calculation of inhibitory rates by means of curve fitting to the read values. High Throughput Screening Assay The commercially available HEK293/TREx line (Invitrogen) was stably transfected with a TRPC6 construct and screened by conventional calcium imaging to find clones with TRPC6 expression following stimulation with 1 μg/ml tetracycline. These cells were maintained in the growth medium recommended by the manufacturer supplemented with 100 μg/ml hygromycin to promote retention of the TRPC6 construct. After growing to near confluency, cells were plated at a density of 35,000 cells/well in 384 well CellBind plates (Corning) in the presence of 1 μg/ml tetracycline, and allowed to grow for 20-30 hrs. A nearly confluent monolayer resulted. Growth media was removed from the wells and cells were then loaded with 25 mL Fluo4/AM diluted in Ringer's Solution (6.5 g NaCl, 0.42 g KCl, 0.25 g CaCl2 and 0.2 g of sodium bicarbonate; pH 7.4) supplemented with 1% Pluronic F-127 to a final concentration of 0.5 μM and incubated for 60 min, at room temperature. Dye solution was then removed from the cells by inverting plates with a sharp flick, and replaced with 25 μl Ringer's. Following 0.5 hour for recovery from loading, cells were assayed using the Hamamatsu FDSS 6000 system, which permitted illumination at 485 nm. Frames were acquired at a rate of 0.2 Hz. During the assay, the plates were continuously vortexed, with pipette mixing of wells following addition of each reagent. For the screening assay, 26 μl of a diluted compound stock (at 50 μM) was added to each well for 2 minutes following the collection of a short (4 frame) baseline. 13 μl of agonist solution consisting of 125 nM GSK1702934A diluted in high-Ca2+Ringer solution (containing 90 mm Ca2+) was then added to each well, achieving a final concentration of 20 mm Ca2+ and 10 μM test compound. Data was collected for 3 minutes following addition of high Ca2+Ringer. The fluorescent ratio for each well was divided by the initial fluorescent intensity for that well and the overall response was determined by averaging the fluorescent ratio of the last 4 frames acquired during the experiment excepting the final frame. Negative and Positive controls were included on each plate. Negative controls wells consisted of HEK293/TREx TRPC6 cells exposed to assay buffer and agonist solution, but no test compound. Positive control consisted of wells consisted of HEK293/TREx TRPC6 cells exposed to 25 μM 3-[(2-chlorophenoxy)methyl]phenyl piperidyl ketone (Chembridge) diluted in Ringer's solution and agonist solution. These controls defined zero percent and 100 percent block respectively, and intensity of each well was normalized to these values. Z′-LYTE Biochemical Aassay Z′-LYTE Assay Conditions: Test Compounds: The Test Compounds are screened in 1% DMSO (final) in the well. For 10 point titrations, 3-fold serial dilutions are conducted from the starting concentration. Peptide/Kinase Mixtures: All Peptide/Kinase Mixtures are diluted to a 2× working concentration in the appropriate Kinase Buffer. ATP Solution: All ATP Solutions are diluted to a 4× working concentration in Kinase Buffer (50 mM HEPES pH 7.5, 0.01% BRIJ-35, 10 mM MgCl2, 1 mM EGTA). ATP Km apparent is previously determined using a Z′-LYTE assay. Development Reagent Solution: The Development Reagent is diluted in Development Buffer. 10× Novel PKC Lipid Mix: 2 mg/mL Phosphatidyl Serine, 0.2 mg/mL DAG in 20 mM HEPES, pH 7.4, 0.3% CHAPS. For 5 mL 10× Novel PKC Lipid Mix: 1. Add 10 mgs Phosphatidyl Serine (Avanti Polar Lipids Part #8400032C or 840039C) and 1 mg DAG (Avanti Polar Lipids Part #800811C) to a glass tube. 2. Remove the chloroform from lipid mixture by evaporating to a clear, thin film under a stream of nitrogen. Continuous rotation of the tube, at an angle to ensure maximum surface area of the lipid solution, will promote the thinnest film. 3. Add 5 mLs resuspension buffer, 20 mM HEPES, 0.3% CHAPS, pH 7.4, to the dried lipid mix 4. Heat gently to 50-60° C. for 1-2 minutes and vortex in short intervals until the lipids are dissolved to a clear or slightly hazy solution. The lipids are typically in solution after 2-3 heat/vortex cycles. 5. Cool to room temperature, aliquot into single use volumes and store at −20° C. Assay Protocol: Bar-coded Corning, low volume NBS, black 384-well plate (Corning Cat. #4514) 1. 2.5 μL 4× Test Compound or 100 nL 100× plus 2.4 μL kinase buffer. 2. 5 μL 2× Peptide/Kinase Mixture. 3. 2.5 μL 4× ATP Solution. 4. 30-second plate shake. 5. 60-minute Kinase Reaction incubation at room temperature. 6. 5 μL Development Reagent Solution. 7. 30-second plate shake. 8. 60-minute Development Reaction incubation at room temperature. 9. Read on fluorescence plate reader and analyze the data. In a typical experiment, each data point uses 100 nL 100× test compound in 100% DMSO. Commonly, 100 nL of a 10 μM solution of test compound is used for each experiment, which is equivalent to 1 picomole of test compound. Accordingly, a 10 μM single-point assay uses 100 picomoles of test compound, and a 10-point titration uses about 200 picomoles of test compound 100 picomoles for the initial test and another 100 picomoles for the serial dilution. Assays of Enzymatic Activity Unless otherwise indicated, assays of DOT1L enzymatic activity were performed under balanced conditions (all substrates present at concentrations equal to their respective KM values) using a radiometric assay of S-[methyl-3H] adenosyl-L-methionine transfer from SAM to chicken erythrocyte nucleosomes as previously described. Reactions were initiated by addition of S-[methyl-3H] adenosyl-L-methionine and allowed to run at room temperature for 120 minutes before being quenched by the addition of 800 μM cold SAM.Compound IC50 values were determined from assays of enzymatic activity in which compound was titrated into reaction mixtures by 3-fold serial dilution from DMSO stocks. For each titration, 10 concentrations of inhibitor were used along with 100% inhibition (2.5 μM SAH) and 0% inhibition (1 μL of neat DMSO per well) controls. Plots of residual enzyme velocity as a function of inhibitor concentration were fit to a standard Langmuir isotherm equation (12) to derive estimates of the IC50 value of the compound. As described herein, the inhibition modality of key compounds within the aminonucleoside series were tested and always found to be competitive with SAM and noncompetitive with respect to nucleosome substrate. For most compounds, the Ki value was calculated from the IC50 value using the appropriate equation for competitive inhibition with respect to SAM.For selected compounds, the inhibition modality with respect to the two substrates (SAM and nucleosomes) were determined by dual titration of compound and varied substrate concentration while holding the other substrate fixed at its KM value. Plots of velocity as a function of varied substrate at multiple inhibitor concentrations were globally fit to a general equation for enzyme inhibition using Graphpad Prism. Selection of the modality for each data set was done by evaluating the value of a, a term related to the degree of cooperative or anticooperative interaction between substrate and inhibitor binding, as previously described. A value of α≥10 was taken as consistent with competitive inhibition, while a value of α≤0.1 was taken as consistent with uncompetitive inhibition. Values of α between 10 and 0.1 were considered to be consistent with noncompetitive inhibition.Compounds that displayed an IC50 value within 50-fold of the enzyme concentration used in initial assays ([E]=0.25 nM) were treated as tight binding inhibitors. In this case, the Ki value was determined by measuring the IC50 value of the compound (vide supra) at varying concentrations of enzyme from 5 nM to 0.25 nM. A plot of IC50 as a function of enzyme concentration was fit to a linear equation and the y-intercept value was equivalent to Ki(1+[S]/KM) where [S] and KM refer to SAM, the substrate with which these inhibitors compete. Knowing the values of [S] and KM used in the assay, the Ki value was then calculated from the y-intercept value.Determination of Ligand Association and Dissociation Rate ConstantsLigand association and dissociation rate constants were determined by surface plasmon resonance (SPR). DOT1L was stored in 20 mM Tris-HCl, 200 mM NaCl, 1 mM EDTA, 1 mM DTT, pH 7.8 and immobilized by direct amine coupling, diluting enzyme into coupling buffer containing 10 mM Hepes pH 7.4, 1 mM TCEP. Immobilization run buffer contained 10 mM Hepes pH 7.4, 150 mM NaCl, 500 μM TCEP, and approximately 10,000 RUs (response units) of DOT1L was captured. A reference channel of a surface that was activated in parallel and blocked was created in a second flow cell was also created. Data was captured on either a Biacore 4000 (chip CM5) or a Biorad ProteOn (chip GLM).Kd determinations were determined using run buffer containing 20 mM Tris pH 8.0, 10 mM NaCl, 100 mM KCl, 0.002% Tween-20, 500 μM TCEP, 2% DMSO, with the following injection parameters: 30 μl/min flow rate, with a 30 second association phase followed by monitoring dissociation for 30 seconds. Exp Cell-based assay of NaP2b activity The rate of phosphate (Pi) uptake into cells was measured using a modification of a literature method (see Mohrmann et al. Am. J. Phys. 250(3 pt 1):G323-30, 1986). Briefly, HEK293 cells were transiently transfected with an expression clone encoding either rat or human NaP2b. The next day, transfected cells were treated with a pharmacological agent to minimize endogenous PiT-mediated phosphate transport activity, such that the only remaining sodium-dependent phosphate transport activity is that which was bestowed by introduction of the NaP2b gene. Cells were incubated with radioactive inorganic phosphate in the presence or absence of varying concentrations of test compound. After a short time, cells were washed, harvested, and the amount of hot phosphate taken up in the cells determined by liquid scintillation counting.HEK293 cells were obtained from the American Type Culture collection and propagated per their instructions. Expression clones for rat and human NaP2b (SLC34A2) were obtained from Open Biosystems (Catalog numbers MRN1768-9510282, and MHS1010-99823026, respectively). There are two putative splice variants of human NaP2b, designated as isoform a and isoform b (NCBI Reference Sequences: NP_006415.2 and NP 001171470.1, respectively). The sequence of the open reading from in MHS1010-99823026 corresponds to isoform b; transfection with this construct was found to confer only very low levels of nonendogenous Pi transport activity. The cDNA was therefore mutated to correspond with isoform a; transfection with this sequence conferred Pi transport significantly over background. Thus, studies of the inhibition of human NaP2b used isoform a exclusively.Cells were seeded into 96-well plates at 25,000 cells/well and cultured overnight. Lipofectamine 2000 (Invitrogen) was used to introduce the NaP2b cDNA, and the cells were allowed to approach confluence during a second overnight incubation. Medium was aspirated from the cultures, and the cells were washed once with choline uptake buffer (14 mM Tris, 137 mM choline chloride, 5.4 mM KCl, 2.8 mM CaCl2, 1.2 mM MgSO4, 100 uM KH2PO4, 1 mg/mL Bovine Serum Albumin, pH 7.4). Cells were then overlayed with either choline uptake buffer or sodium uptake buffer (14 mM Tris, 137 mM sodium chloride, 5.4 mM KCl, 2.8 mM CaCl2, 1.2 mM MgSO4, 100 uM KH2PO4, PiT-silencing agent, 1 mg/mL Bovine Serum Albumin, pH 7.4) containing 6-9 uCi/mL 33P orthophosphoric acid (Perkin Elmer) and test compound. Each compound was tested at twelve concentrations ranging from 0.1 nM to 30 uM. Assays were run in duplicate and compounds of interest were tested multiple times. After incubation for 23 minutes at room temperature, assay mixtures were removed, and the cells were washed twice with ice cold stop solution (137 mM sodium chloride, 14 mM Tris, pH 7.4). Cells were lysed by addition of 20 μL 0.1% Tween 80 followed by 100 μL scintillation fluid, and counted using a TopCount (Perkin Elmer). The pIC50 (the negative log of the IC50) values of the test compounds were calculated using GraphPad Prism. Preliminary studies showed that under these conditions, sodium-dependent Pi uptake was linear for at least 30 minutes and tolerated 0.6% (v/v) DMSO without deleterious effects. High Throughput Screening Assay The commercially available HEK293/TREx line (Invitrogen) was stably transfected with a TRPC5 construct and screened by conventional calcium imaging to find clones with TRPC5 expression following stimulation with 1 μg/ml tetracycline. These cells were maintained in the growth medium recommended by the manufacturer supplemented with 100 μg/ml hygromycin to promote retention of the TRPC5 construct. After growing to near confluency, cells were plated at a density of 35,000 cells/well in 384 well CellBind plates (Corning) in the presence of 1 μg/ml tetracycline, and allowed to grow for 20-30 hrs. A nearly confluent monolayer resulted. Cells were then loaded with Ca2+ dye: Fura-2/AM or Fluo4/AM was added to the wells to a final concentration of 4 μM or 0.5 μM, respectively, and incubated for 80 min or 60 min, respectively, at room temperature. Supernatant was then removed from the cells by inverting plates with a sharp flick, and 25 μl Hank's Balanced Salt Solution (HBSS; 0.185 g/l D-glucose, 0.9767 g/l MgS04 (anhydrous), 0.4 g/l KCl, 0.06 g/l KH2PO4 (anhydrous), 0.35 g/l NaHCO3, 8.0 g/l NaCl, and 0.04788 g/l Na2HPO4 (anhydrous); pH 7.4) was then added to each well. Following 0.5 hour for recovery from loading, cells were assayed using the Hamamatsu FDSS 6000 system, which permitted illumination alternately at 340 nm and 380 nm for Fura-2 experiments, or at 485 nm for Fluo4 experiments. Frames were acquired at a rate of 0.2 Hz. During the assay, the plates were continuously vortexed, with pipette mixing of wells following addition of each reagent. For the screening assay, 26 μl of a diluted compound stock (at 50 μM) was added to each well for 2 minutes following the collection of a short (4 frame) baseline. 13 μl 62 mM high-Ca2+Ringer solution (4.17 ml of normal ringer (with 2 mM Ca2+) plus 5.83 ml of isotonic calcium ringer (105 mM Ca2+; in this ringer all sodium has been replaced with calcium)) was then added to each well, achieving a final concentration of 14 mM Ca2+ and 10 μM test compound. Data was collected for 3 minutes following addition of high Ca2+Ringer, where the fluorescent intensity (for Fluo4) and the F340/F380 ratio (for Fura-2) were proportional to the [Ca2+]i Negative controls consisted of HEK293/TREx TRPC5 cells exposed to high Ca2+ solution, but no compound. Positive control conditions consisted of addition of 2-APB, a promiscuous blocker of TRPC5 and other channels, to columns 23 and 24 of the plates, to a final concentration of 200 μM. The Fluo4 cell-based fluorescence assay was used to determine the intracellular Ca2+ concentration in the presence of varying drug concentration. Final concentrations of compounds tested were 20 μM, 6.667 μM, 2.222 μM, 0.741 μM, 0.247 μM, 0.082 μM, and 0.027 μM. Compounds were tested in triplicate at all concentrations. Human PTGES Biochemical Enzyme Inhibition Assay Recombinant proteins (human isoforms) of PTGES containing a FLAG tag, expressed in baculovirus infected insect cells (Hi-5) and purified by affinity chromatography was used as enzyme in the assay. Substrate was prostaglandin H2 (Cayman Chemicals).For the assay, 50 nl of a 100-fold concentrated solution of the test compound in DMSO was pipetted into a black microtiter plate (384 or 1536, Greiner Bio-One, Frickenhausen, Germany). 4 ul of a solution of human PTGES in assay buffer [100 mM sodium phosphate pH 7.2, 2.5 mM Glutathion reduced, 1 mM EDTA, 0.01% BSA, 0.4 mM DTT, 0.15 mM n-dodecylmaltoside] was added to the well containing test compound and incubated for 15-20 minutes to allow binding of the compound to the enzyme prior to the enzymatic reaction. The reaction was started by addition of 1 ul of an ice cold solution containing PGH2 (40 nM in assay buffer resulting in a final concentration of 8 nM PGH2 in the assay). Reaction time of the mix was 60 seconds at room temperature (PGH2 in aqueous solution quickly converts nonenyzmatically to PGE2 with a short half-life). The concentration of each isoform of PTGES was adapted to the activity of the respective enzyme preparation to maintain linear reaction properties within the reaction time. Typical concentration was around 0.75 nM. The reaction was stopped by addition of 1 ul of a solution containing 15 mM SnCl2 and 400 mM KF in water. SnCl2 converts the remaining unstable PGH2 to stable PGF2alpha. Then, 3 ul of the a first detection solution containing PGE2-D2 (Cisbio Bioassays, TR-FRET reagent, diluted according to the manufacturer's recommendation, typically 1:20 in reconstitution buffer) was added. Finally, 3 μl of the second detection solution containing Lanthanide-kryptate labelled anti-PGE2 antibody (Cisbio Bioassays, diluted according to the manufacturer's recommendation, typically 1:20 in reconstitution buffer) was added to the mix. The resulting mix was incubated overnight at 4° C. to allow the formation of a complex of PGE2 and the detection reagents. The amount of PGE2 that had been produced by PTGES from PGH2 was then determined by testing resonance energy transfer of the Lanthanide-kryptate labelled anti-PGE2 antibody to PGE2-D2. Hereby the fluorescent emissions at 620 nm and 665 nm were measured after excitation at 337-350 nm in a TR-FRE compatible microplate reader (typically BMG Pherastar or Perkin-Elmer ViewLux). The ratio of the emissions at 665 nm and 620 nm was used to determine the amount of PGE2 that was catalyzed by the enzyme. Data were normalized (enzyme reaction without inhibitor=0% inhibition, assay setup without enzyme=100% inhibition). Compounds were tested in duplicates at up to 10 concentrations (for example 20 μM, 5.7 μM, 1.6 μM, 0.47 μM, 0.13 μM, 38 nM, 11 nM, 3.1 nM, 0.89 nM, 0.25 nM and 0.073 nM). Dilution series were made prior to the assay in a 100 fold concentrated form by serial dilution. IC50 values were calculated by 4-Parameter fitting. AlphaScreen SureFire Assay The human and mouse GPR120-mediated intracellular phosphorylated ERK assays were established using CHOA12 cells stably transfected with the short form of human or mouse GPR120 receptor. Cells were cultured in growth medium consisting of F-12 media (Invitrogen Cat. #11765) with 5% Charcoal/Dextran FBS (Invitrogen Cat. #12676-029), 500 μg/mL GENETICIN (Life Technologies Cat. #10131-027) and 250 μg/mL Zeocin (Invitrogen Cat. #R250-01). Cells were cryo preserved at a concentration of 2×10⁷ cells/mL, in 90% Charcoal/Dextran FBS and 10% DMSO, and frozen in liquid nitrogen at a low passage number.For the pERK assay, 2×10⁷ cells/mL cryopreserved human and mouse cells were thawed rapidly in a 37° C. water bath and added to a T-225 flask containing 50 mL growth medium. The flasks were placed in a tissue culture incubator overnight (37° C., 5% CO2). The next day, cells were harvested with trypsin (Gibco Cat. #25300-054), resuspended in serum-containing growth medium and counted using a Cellometer and volume adjusted to a concentration of 0.6×10⁶ cells/mL. Cells were plated into 384-well clear bottom tissue culture plates (BD Cat. #353962) at 50 μL/well, for a density of 30,000 cells/well using a MULTIDROP and incubated for 16-18 hours (overnight) at 37° C. with 5% CO2. The next day, cells were serum starved in 30 μL of F-12 media without any serum or antibiotics for 2 hours at 37° C.Test compounds were 3-fold, 11-point serially diluted in DMSO in a REMP assay plate (Matrix Cat. #4307) by Tecan and 5 μL was transferred into an ECHO source plate (LabCyte Cat. #LC-0200). Cells were then stimulated with 50 nL of compound dilutions using ECHO liquid handler for 7 minutes at 37° C. Compounds ranged from final assay concentrations of 33.33 μM to 0.56 nM.The media was then dumped and cells lysed with 20 μL of 1× Lysis buffer from the AlphaScreen SureFire Phospho-ERK 1/2 Kit (Perkin Elmer Cat. #6760617M). The lysis buffer was diluted 5-fold with water before use. The plate was agitated on a shaker for 10 minutes after which 2 μL was transferred into a 384-well white proxiplate (Perkin Elmer Cat. #6008289). The SureFire assay reagent mix was prepared by mixing 60 parts Reaction Buffer, 10 parts Activation Buffer, 1 part Donor Beads, 1 part Acceptor Beads (Perkin Elmer Cat. #TGRES10K). 3.5 μL/well of this reagent mix was manually added to the proxiplate with a multichannel pipettor. Plates were spun down at 1000 rpm for 2 minutes, followed by light-protected incubation at room temperature for 2 hours. The plates were read on the Alpha-technology compatible Envision multilabel plate reader using AlphaScreen protocol according to manufacturer's specifications. The agonist effect of compounds was expressed as 100×(average sample-average blank)/(average total−average blank) where sample is the luminescence activity in the presence of test compound, blank is equal to the luminescence activity in the presence of DMSO control and the total is signal induced by 50 μM linolenic acid as reference compound. Activation data for the test compound over a range of concentrations was plotted as percentage activation of the test compound (100%=maximum response) GPR120 pERK AlphaScreen SureFire Assay The human and mouse GPR120-mediated intracellular phosphorylated ERK assays were established using CHOA12 cells stably transfected with the short form of human or mouse GPR120 receptor. Cells were cultured in growth medium consisting of F-12 media (Invitrogen Cat. #11765) with 5% Charcoal/Dextran FBS (Invitrogen Cat. #12676-029), 500 μg/mL GENETICIN (Life Technologies Cat. #10131-027) and 250 μg/mL Zeocin (Invitrogen Cat. #R250-01). Cells were cryo preserved at a concentration of 2×10⁷ cells/mL, in 90% Charcoal/Dextran FBS and 10% DMSO, and frozen in liquid nitrogen at a low passage number.For the pERK assay, 2×10⁷ cells/mL cryopreserved human and mouse cells were thawed rapidly in a 37° C. water bath and added to a T-225 flask containing 50 mL growth medium. The flasks were placed in a tissue culture incubator overnight (37° C., 5% CO2). The next day, cells were harvested with trypsin (Gibco Cat. #25300-054), resuspended in serum-containing growth medium and counted using a Cellometer and volume adjusted to a concentration of 0.6×10⁶ cells/mL. Cells were plated into 384-well clear bottom tissue culture plates (BD Cat. #353962) at 50 μL/well, for a density of 30,000 cells/well using a MULTIDROP and incubated for 16-18 hours (overnight) at 37° C. with 5% CO2. The next day, cells were serum starved in 30 μL of F-12 media without any serum or antibiotics for 2 hours at 37° C.Test compounds were 3-fold, 11-point serially diluted in DMSO in a REMP assay plate (Matrix Cat. #4307) by Tecan and 5 μL was transferred into an ECHO source plate (Labcyte Cat. #LC-0200). Cells were then stimulated with 50 nL of compound dilutions using ECHO liquid handler for 7 minutes at 37° C. Compounds ranged from final assay concentrations of 33.33 μM to 0.56 nM.The media was then dumped and cells lysed with 20 μL of 1× Lysis buffer from the AlphaScreen SureFire Phospho-ERK 1/2 Kit (Perkin Elmer Cat. #6760617M). The lysis buffer was diluted 5-fold with water before use. The plate was agitated on a shaker for 10 minutes after which 2 μL was transferred into a 384-well white proxiplate (Perkin Elmer Cat. #6008289). The SureFire assay reagent mix was prepared by mixing 60 parts Reaction Buffer, 10 parts Activation Buffer, 1 part Donor Beads, 1 part Acceptor Beads (Perkin Elmer Cat. #TGRES10K). 3.5 μL/well of this reagent mix was manually added to the proxiplate with a multichannel pipettor. Plates were spun down at 1000 rpm for 2 minutes, followed by light-protected incubation at room temperature for 2 hours. The plates were read on the Alpha-technology compatible Envision multilabel plate reader using AlphaScreen protocol according to manufacturer's specifications. The agonist effect of compounds was expressed as 100× (average sample−average blank)/(average total−average blank) where sample is the luminescence activity in the presence of test compound, blank is equal to the luminescence activity in the presence of DMSO control and the total is signal induced by 50 μM linolenic acid as reference compound. Activation data for the test compound over a range of concentrations was plotted as percentage activation of the test compound (100%=maximum response). After correcting for background, EC50 values were determined. The EC50 is defined as the concentration of test compound which produces 50% of the maximal response and was quantified using the 4 parameter logistic equation to fit the data. High Throughput Screening Assay This screening assay measures TRPC6 (transient receptor potential cation channel, subfamily C, member 6) ion channel activation via addition either of the commercially available DAG ligand analogue OAG (1-oleoyl-2-acetyl-sn-glycerol) or of the TRPC6 agonist 1-[1-(4,5,6,7,8-pentahydrocyclohepta[2,1-d]thiophen-2-ylcarbonyl)-4-piperidyl]-3-hydrobenzimidazol-2-one (GSK1702934A). The assay utilizes a FLIPR fluorescent calcium sensor 4-(6-Acetoxymethoxy-2,7-difluoro-3-oxo-9-xanthenyl)-4′-methyl-2,2′-(ethylenedioxy)dianiline-N,N,N′,N′-tetraacetic acid tetrakis(acetoxymethyl) ester (Fluo4/AM) membrane potential (FMP) dye from Molecular Devices, which is a voltage sensitive indicator with a fluorescent quencher. Changes (increases) in intracellular membrane calcium concentration potential as measured by the fluorescent signal increase during membrane depolarization provide a measurement of channel activity.The commercially available HEK293/TREx line (Invitrogen) was stably transfected with a TRPC6 construct and screened by conventional calcium imaging to find clones with TRPC6 expression following stimulation with 1 μg/ml tetracycline. These cells were maintained in the growth medium recommended by the manufacturer supplemented with 100 μg/ml hygromycin to promote retention of the TRPC6 construct. After growing to near confluency, cells were plated at a density of 35,000 cells/well in 384 well CellBind plates (Corning) in the presence of 1 μg/ml tetracycline, and allowed to grow for 20-30 hrs. A nearly confluent monolayer resulted. Growth media was removed from the wells and cells were then loaded with 25 mL Fluo4/AM diluted in Ringer's Solution (6.5 g NaCl, 0.42 g KCl, 0.25 g CaCl2) and 0.2 g of sodium bicarbonate; pH 7.4) supplemented with 1% Pluronic F-127 to a final concentration of 0.5 μM and incubated for 60 min, at room temperature. Dye solution was then removed from the cells by inverting plates with a sharp flick, and replaced with 25 μl Ringer's. Following 0.5 hour for recovery from loading, cells were assayed using the Hamamatsu FDSS 6000 system, which permitted illumination at 485 nm. Frames were acquired at a rate of 0.2 Hz. During the assay, the plates were continuously vortexed, with pipette mixing of wells following addition of each reagent. For the screening assay, 26 μl of a diluted compound stock (at 50 μM) was added to each well for 2 minutes following the collection of a short (4 frame) baseline. 13 μl of agonist solution consisting of 125 nM GSK1702934A diluted in high-Ca2+Ringer solution (containing 90 mm Ca2+) was then added to each well, achieving a final concentration of 20 mm Ca2+ and 10 μM test compound. Data was collected for 3 minutes following addition of high Ca2+Ringer. The fluorescent ratio for each well was divided by the initial fluorescent intensity for that well and the overall response was determined by averaging the fluorescent ratio of the last 4 frames acquired during the experiment excepting the final frame. Negative and Positive controls were included on each plate. Negative controls wells consisted of HEK293/TREx TRPC6 cells exposed to assay buffer and agonist solution, but no test compound. Positive control consisted of wells consisted of HEK293/TREx TRPC6 cells exposed to 25 μM 3-[(2-chlorophenoxy)methyl]phenyl piperidyl ketone (Chembridge) diluted in Ringer's solution and agonist solution. These controls defined zero percent and 100 percent block respectively, and intensity of each well was normalized to these values.IC50s were determined using the above fluorescence method with the exception that instead of testing the compounds at 10 μM, compounds were tested at final concentrations of 20 μM, 6.667 μM, 2.222 μM, 0.741 μM, 0.247 μM, 0.082 μM, and 0.027 μM. Compounds were tested in triplicate at all concentrations. Standard software was used to fit IC50 curves.
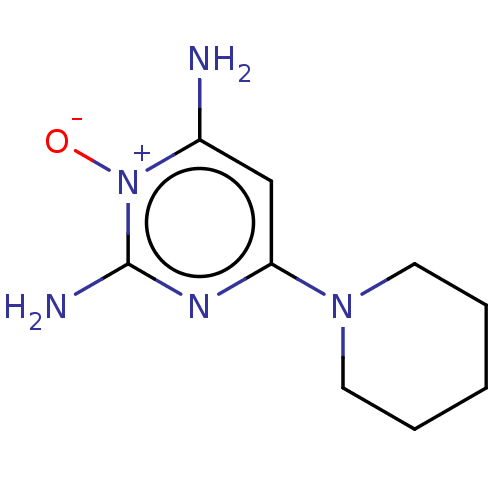 Regaine For Women U-10858 Women''s rogaine Rogaine Extra Strength Rogaine Minoxidil Men''s Rogaine Theroxidil CHEBI:6942 Lonolox Minodyl BDBM50237593 Regaine For Men Minoxidil Extra Strength Loniten
 BDBM338831 US9751885, 268 3-(trans-2- ((cyclopropylmethyl)- amino)cyclopropyl)-N- (4,4- difluorocyclohexyl)- benzamide hydrochloride (optical isomer, retention time short)
 N-cyclopentyl-3-(trans- 2-(tetrahydro-2H-pyran- 4-ylamino)- cyclopropyl)benzamide hydrochloride (optical isomer, retention time short) BDBM338827 US9751885, 264
 N-(4,4- difluorocyclohexyl)-3- (trans-2-(tetrahydro- 2H-pyran-4- ylamino)cyclopropyl)- benzamide hydrochloride (optical isomer, retention time short) US9751885, 266 BDBM338829
 3-(trans-2- ((cyclopropylmethyl)- amino)cyclopropyl)-N-(5- methyl-1,3,4-thiadiazol-2- yl)benzamide hydrochloride (optical isomer, retention time short) BDBM338663 US9751885, 97
 BDBM338833 3-(trans-2- ((cyclopropylmethyl)- amino)cyclopropyl)-N- (1-(2,2,2- trifluoroethyl)- piperidin-4- yl)benzamide dihydrochloride(optical isomer,retention time short) US9751885, 270
 US9751885, 104 3-(trans-2- ((cyclopropylmethyl)- amino)cyclopropyl)-N-(5- methyl-1,2-oxazol-3- yl)benzamide hydrochloride (optical isomer, retention time short) BDBM338670
 US9751885, 258 BDBM338821 3-(trans-2-((1- cyclopropylpiperidin-4- yl)amino)cyclopropyl)-N- (5-methyl-1,3,4- thiadiazol-2- yl)benzamide difumarate (optical isomer, retention time short)
 US9751885, 248 3-(trans-2- aminocyclopropyl)-N- cyclopentylbenzamide hydrochloride [optical isomer, compound derived from methyl 3- (trans-2-((tert-butoxycarbonyl)amino)-cyclopropyl)benzoate(optical isomer,retention time short)] BDBM338811
 3-(trans-2- aminocyclopropyl)-N- (4,4- difluorocyclohexyl)- benzamide hydrochloride [optical isomer, compound derived from methyl 3-(trans-2-((tert-butoxycarbonyl)amino)-cyclopropyl)benzoate(optical isomer,retention time short)] BDBM338813 US9751885, 250
 US9751885, 252 BDBM338815 3-(trans-2- aminocyclopropyl)-N-(1- (2,2,2-trifluoro- ethyl)piperidin-4- yl)benzamide dihydrochloride [optical isomer, compound derivedfrom methyl 3-(trans-2-((tert-butoxycarbonyl)amino)-cyclopropyl)benzoate(optical isomer,retention time short)]
 US9751885, 256 3-(trans-2-((1- cyclopropylpiperidin-4- yl)amino)cyclopropyl)-N- (5-methyl-1,3,4- thiadiazol-2- yl)benzamide acetate [optical isomer, compound derived frommethyl 3-(trans-2-((tert-butoxycarbonyl)amino)-cyclopropyl)benzoate(optical isomer,retention time short)] BDBM338819
 BDBM338756 N-(1-(cyclopropylmethyl)- 1H-pyrazol-4-yl)-3-(trans- 2-(tetrahydro-2H-pyran-4- ylamino)cyclopropyl)- benzamide dihydrochloride [optical isomer, compound derived from N-(1- (cyclopropylmethyl)-1H- pyrazol-4-yl)-3-(trans-2-(tetrahydro-2H-pyran-4-ylamino)cyclopropyl)-benzamide (optical isomer,retention time short)] US9751885, 191
 BDBM338753 N-(1-(cyclopropylmethyl)- 1H-pyrazol-4-yl)-3-(trans- 2-((1-cyclopropyl- piperidin-4-yl)amino)- cyclopropyl)benzamide trihydrochloride [optical isomer, compound derived from N-(1-(cyclopropyl- methyl)-1H-pyrazol-4-yl)- 3-(trans-2-((1-cyclo-propylpiperidin-4-yl)-amino)cyclopropyl)-benzamide (optical isomer,retention time short)] US9751885, 188