 glucose dextrose BDBM34103 D-glucose
 CHEMBL458193 2,3-hexahydroxydiphenoyl-D-glucose 2,3-O-(S)-hexahydroxydiphenoyl-D-glucose 2,3-(S)-hexahydroxydiphenoyl-D-glucose BDBM50250987 2, 3-(S)-hexahydroxydiphenoyl-D-glucose
 (glucose)n glycogen BDBM24362
 UDPG BDBM50423218 Udp-Glucose URIDINE DIPHOSPHATE GLUCOSE 5''-Diphosphoglucose Uridine-5''-Diphosphoglucose
 BDBM197174 Glucose-6-phosphate (G6P)
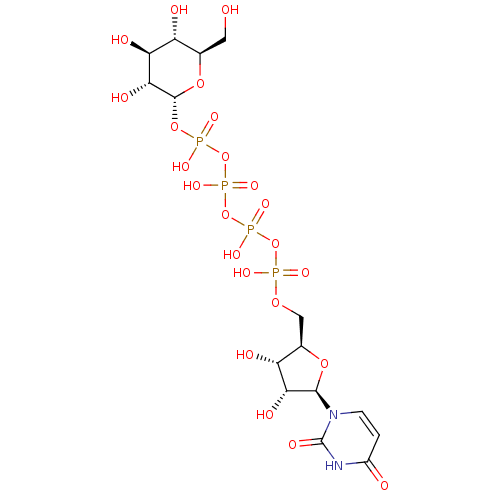 Uridine-5'-glucose-1'-tetraphosphate BDBM50270545 CHEMBL499138
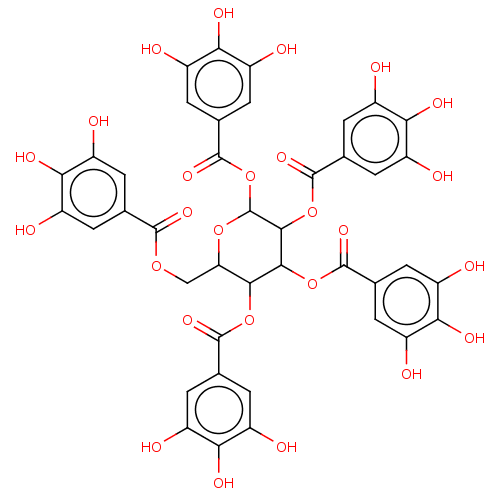 BDBM420321 Penta-O-galloyl-beta-D-glucose hydrate
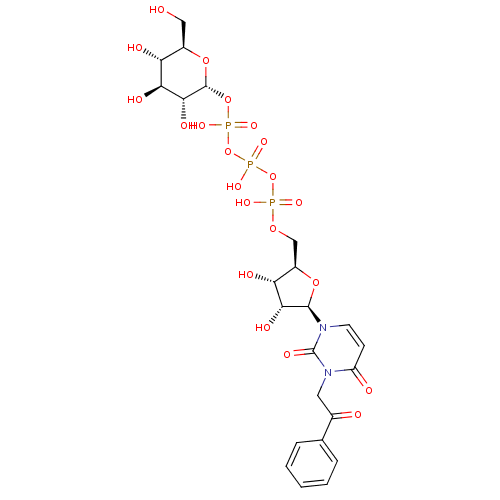 BDBM50319133 3-Phenacyluridine5'-Glucose-1'-triphosphate TriethylammoniumSalt CHEMBL1083262
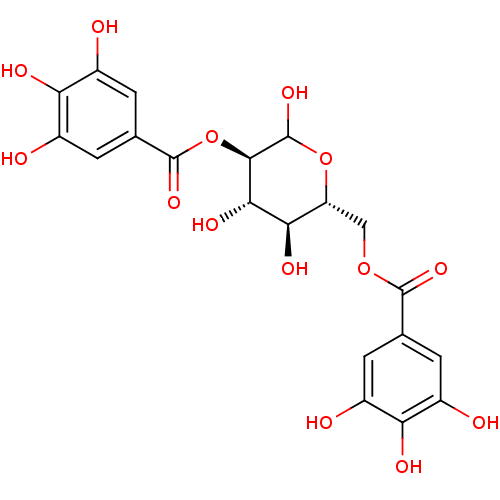 2, 6-di-O-galloyl-D-glucose BDBM50269545 CHEMBL458684
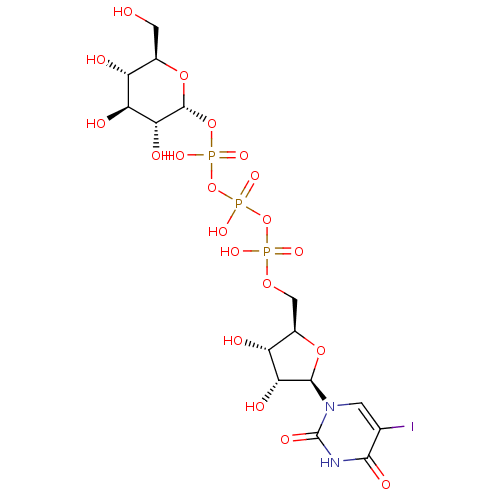 5-Iodouridine 5'-Glucose-1'-triphosphate TriethylammoniumSalt BDBM50319127 CHEMBL1083261
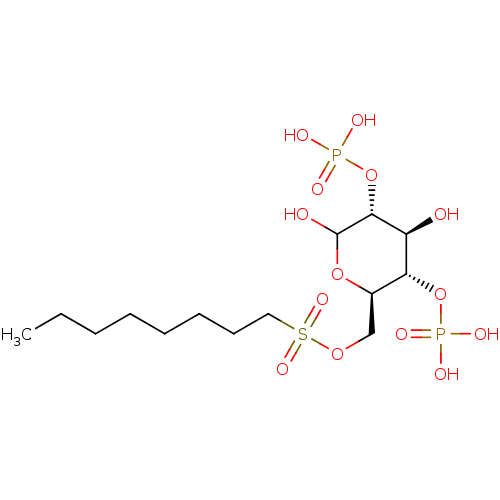 BDBM50308980 6-O-Octylsulfonyl-D-glucose-2,4-bisphosphate CHEMBL600442
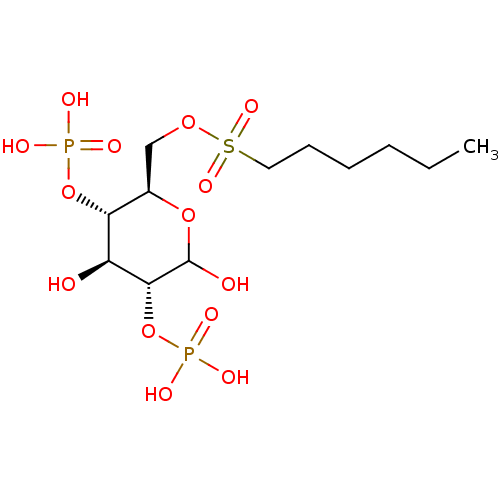 BDBM50308981 CHEMBL600243 6-O-Hexylsulfonyl-D-glucose-2,4-bisphosphate
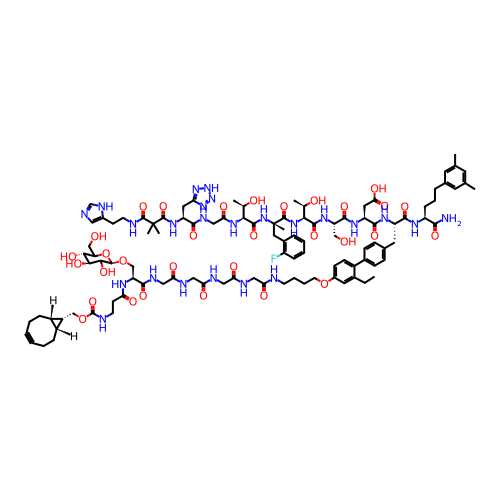 BDBM741327 BCN-NHC2H4CO- (glucose) SG4-P9 US20250161476, LP# LP18
 CHEMBL1614854 beta-D-glucopyranose Glucoside BDBM50240803 beta-D-glucose
 CHEMBL454230 Uridine-5'-(2'-deoxy-glucose)-6'-tetraphosphate BDBM50270548
 CHEMBL590082 BDBM50308978 6-O-Ethylsulfonyl-D-glucose-2,4-bisphosphate
 CHEMBL590347 6-O-Dodecylsulfonyl-D-glucose-2,4-bisphosphate BDBM50308979
 N4-Methoxycytidine 5'-Glucose-1'-triphosphate TriethylammoniumSalt CHEMBL1083264 BDBM50319136
 US20250161476, LP# LP20 BDBM741329 DIBAC-suc- (glucose) SG4-P9
 BDBM226188 dihydrodehydrodiconifeyl alcohol 9'-O-β-D-glucose (19)
 BDBM50319134 Uridine 5'-Glucose-1'-alpha,beta-methylenetriphosphate TriethylammoniumSalt CHEMBL1083263
 cori ester glucose-1-phosphate alpha-glucose-1-phosphate {[(2R,3R,4S,5S,6R)-3,4,5-trihydroxy-6-(hydroxymethyl)oxan-2-yl]oxy}phosphonic acid BDBM23188
 P1-Uridine 5'-P3-[1]Glucose-1'-Triphosphate TriethylammoniumSalt BDBM50319132 CHEMBL1083260
 uridine 5'-[3-alpha-D-glucopyranosyl dihydrogen diphosphate] UDP-alpha-D-glucose BDBM50209659
 CHEMBL498485 Icaritin 3-hydroxy-7-o-beta-glucose-8-prenyl-4'-methoxy Chrysin BDBM50272527
 1,2,6-tris-O-galloyl-beta-D-glucose BDBM50250504 CHEMBL447974 1,2,6-tris-O-(3,4,5-trihydroxybenzoyl)-beta-D-glucopyranose
 BDBM645364 pinocembrin 7-O-(3$#8243;- galloyl-4$#8243;,6$#8243;-(S)- hexahydroxydiphenoyl)- beta-D-glucose (PGHG) US20240016777, Table3.6
 1,2,3,4,6-pentakis-O-(3,4,5-trihydroxybenzoyl)-beta-D-glucopyranose beta-D-glucopyranose pentakis(3,4,5-trihydroxybenzoate) BDBM50241052 1,2,3,4,6-pentakis-O-galloyl-beta-D-glucose 1,2,3,4,6-Pgg CHEMBL382408 acs.jmedchem.1c00409_ST.650
 URIDINE-5'-DIPHOSPHATE-2-DEOXY-2-FLUORO-ALPHA-D-GLUCOSE CHEMBL593830 BDBM50304032 Diphosphoric Acid 1''-alpha-D-[1''](2''-Fluoro-2''-Deoxy)Glucopyranosyl Ester 2-(uridin-5'-yl)ester
- Kruse, T; Kofod-Hansen, M; Muenzel, MW; Thoegersen, H; Sauerberg, P; Rasmussen, JE; Behrens, C; Hoeg-Jensen, T; Balsanek, V; Drobnakova, Z; Droz, L; Havranek, M; Kotek, V; Stengl, M; Snajdr, I; Drusanova, H Glucose-sensitive albumin-binding derivatives US Patent US11767332 (2023)
- Gynther, M; Ropponen, J; Laine, K; Leppänen, J; Haapakoski, P; Peura, L; Järvinen, T; Rautio, J Glucose promoiety enables glucose transporter mediated brain uptake of ketoprofen and indomethacin prodrugs in rats. J Med Chem 52: 3348-53 (2009)
- Carson, KG; Goodwin, NC; Harrison, BA; Rawlins, DB; Strobel, E; Zambrowicz, B Inhibitors of sodium glucose cotransporter 1 US Patent US9688710 (2017)
- Chu, KF; Yao, CH; Song, JS; Chen, CT; Yeh, TK; Hsieh, TC; Huang, CY; Wang, MH; Wu, SH; Chang, WE; Chao, YS; Lee, JC N-Indolylglycosides bearing modifications at the glucose C6-position as sodium-dependent glucose co-transporter 2 inhibitors. Bioorg Med Chem 24: 2242-50 (2016)
- Liu, KG; Kim, JI; Olszewski, K; Barsotti, AM; Morris, K; Lamarque, C; Yu, X; Gaffney, J; Feng, XJ; Patel, JP; Poyurovsky, MV Discovery and Optimization of Glucose Uptake Inhibitors. J Med Chem 63: 5201-5211 (2020)
- PubChem, PC Human Glucose-6-Phosphate Dehydrogenase Dose Response Selectivity Assay for Inhibitors of Plasmodium falciparum Glucose-6-Phosphate Dehydrogenase PubChem Bioassay (2011)
- Shipton, ML; Riley, AM; Rossi, AM; Brearley, CA; Taylor, CW; Potter, BVL Both d- and l-Glucose Polyphosphates Mimic d- J Med Chem 63: 5442-5457 (2020)
- Hamilton, NM; Dawson, M; Fairweather, EE; Hamilton, NS; Hitchin, JR; James, DI; Jones, SD; Jordan, AM; Lyons, AJ; Small, HF; Thomson, GJ; Waddell, ID; Ogilvie, DJ Novel steroid inhibitors of glucose 6-phosphate dehydrogenase. J Med Chem 55: 4431-45 (2012)
- Olszewski, K; Poyurovsky, M; Barsotti, A; Kim, J; Liu, KG Treatment of infectious diseases with glucose uptake inhibitors US Patent US10729691 (2020)
- Wang, D; Chu, PC; Yang, CN; Yan, R; Chuang, YC; Kulp, SK; Chen, CS Development of a novel class of glucose transporter inhibitors. J Med Chem 55: 3827-36 (2012)
- Jacobson, PB; von Geldern, TW; Ohman, L; Osterland, M; Wang, J; Zinker, B; Wilcox, D; Nguyen, PT; Mika, A; Fung, S; Fey, T; Goos-Nilsson, A; Grynfarb, M; Barkhem, T; Marsh, K; Beno, DW; Nga-Nguyen, B; Kym, PR; Link, JT; Tu, N; Edgerton, DS; Cherrington, A; Efendic, S; Lane, BC; Opgenorth, TJ Hepatic glucocorticoid receptor antagonism is sufficient to reduce elevated hepatic glucose output and improve glucose control in animal models of type 2 diabetes. J Pharmacol Exp Ther 314: 191-200 (2005)
- Nagy, V; Benltifa, M; Vidal, S; Berzsényi, E; Teilhet, C; Czifrák, K; Batta, G; Docsa, T; Gergely, P; Somsák, L; Praly, JP Glucose-based spiro-heterocycles as potent inhibitors of glycogen phosphorylase. Bioorg Med Chem 17: 5696-707 (2009)
- Wang, Y; Ma, L; Pang, C; Huang, M; Huang, Z; Gu, L Synergetic inhibition of genistein and D-glucose on alpha-glucosidase. Bioorg Med Chem Lett 14: 2947-50 (2004)
- Yamamoto, Y; Kawanishi, E; Koga, Y; Sakamaki, S; Sakamoto, T; Ueta, K; Matsushita, Y; Kuriyama, C; Tsuda-Tsukimoto, M; Nomura, S N-Glucosides as human sodium-dependent glucose cotransporter 2 (hSGLT2) inhibitors. Bioorg Med Chem Lett 23: 5641-5 (2013)
- Fredo Naciuk, F; do Nascimento Faria, J; Gonçalves Eufrásio, A; Torres Cordeiro, A; Bruder, M Development of Selective Steroid Inhibitors for the Glucose-6-phosphate Dehydrogenase from ACS Med Chem Lett 11: 1250-1256 (2020)
- Benltifa, M; Hayes, JM; Vidal, S; Gueyrard, D; Goekjian, PG; Praly, JP; Kizilis, G; Tiraidis, C; Alexacou, KM; Chrysina, ED; Zographos, SE; Leonidas, DD; Archontis, G; Oikonomakos, NG Glucose-based spiro-isoxazolines: a new family of potent glycogen phosphorylase inhibitors. Bioorg Med Chem 17: 7368-80 (2009)
- Sato, S; Takeo, J; Aoyama, C; Kawahara, H Na+-glucose cotransporter (SGLT) inhibitory flavonoids from the roots of Sophora flavescens. Bioorg Med Chem 15: 3445-9 (2007)
- Bowler, JM; Hervert, KL; Kearley, ML; Miller, BG Small-Molecule Allosteric Activation of Human Glucokinase in the Absence of Glucose. ACS Med Chem Lett 4: 580-4 (2013)
- Maccari, R; Ottanà, R Sodium-Glucose Cotransporter Inhibitors as Antidiabetic Drugs: Current Development and Future Perspectives. J Med Chem 65: 10848-10881 (2022)
- Kang, C; Han, JH; Oh, J; Kulkarni, R; Zhou, W; Ferreira, D; Jang, TS; Myung, CS; Na, M Steroidal Alkaloids from Veratrum nigrum Enhance Glucose Uptake in Skeletal Muscle Cells. J Nat Prod 78: 803-10 (2015)
- Pasternak, A; Feng, Z; de Jesus, R; Ye, Z; He, S; Dobbelaar, P; Bradley, SA; Chicchi, GG; Tsao, KL; Trusca, D; Eiermann, GJ; Li, C; Feng, Y; Wu, M; Shao, Q; Zhang, BB; Nargund, R; Mills, SG; Howard, AD; Yang, L; Zhou, YP Stimulation of Glucose-Dependent Insulin Secretion by a Potent, Selective sst3 Antagonist. ACS Med Chem Lett 3: 289-293 (2012)
- Kato, E; Kimura, S; Kawabata, J Ability of higenamine and related compounds to enhance glucose uptake in L6 cells. Bioorg Med Chem 25: 6412-6416 (2017)
- Ellsworth, BA; Meng, W; Patel, M; Girotra, RN; Wu, G; Sher, PM; Hagan, DL; Obermeier, MT; Humphreys, WG; Robertson, JG; Wang, A; Han, S; Waldron, TL; Morgan, NN; Whaley, JM; Washburn, WN Aglycone exploration of C-arylglucoside inhibitors of renal sodium-dependent glucose transporter SGLT2. Bioorg Med Chem Lett 18: 4770-3 (2008)
- Alphey, MS; Pirrie, L; Torrie, LS; Boulkeroua, WA; Gardiner, M; Sarkar, A; Maringer, M; Oehlmann, W; Brenk, R; Scherman, MS; McNeil, M; Rejzek, M; Field, RA; Singh, M; Gray, D; Westwood, NJ; Naismith, JH Allosteric competitive inhibitors of the glucose-1-phosphate thymidylyltransferase (RmlA) from Pseudomonas aeruginosa. ACS Chem Biol 8: 387-96 (2013)
- Koga, Y; Sakamaki, S; Hongu, M; Kawanishi, E; Sakamoto, T; Yamamoto, Y; Kimata, H; Nakayama, K; Kuriyama, C; Matsushita, Y; Ueta, K; Tsuda-Tsukimoto, M; Nomura, S C-Glucosides with heteroaryl thiophene as novel sodium-dependent glucose cotransporter 2 inhibitors. Bioorg Med Chem 21: 5561-72 (2013)
- Tsuji, T; Yamaguchi, M; Kuroyanagi, J; Furuzono, S; Konishi, M; Terayama, K; Tanaka, J; Saito, M; Kobayashi, Y Discovery of novel pyridazine derivatives as glucose transporter type 4 (GLUT4) translocation activators. Bioorg Med Chem Lett 29: 1785-1790 (2019)
- GLUT4 expression and glucose transport in human induced pluripotent stem cell-derived cardiomyocytes.
- Dudash, J; Zhang, X; Zeck, RE; Johnson, SG; Cox, GG; Conway, BR; Rybczynski, PJ; Demarest, KT Glycosylated dihydrochalcones as potent and selective sodium glucose co-transporter 2 (SGLT2) inhibitors. Bioorg Med Chem Lett 14: 5121-5 (2004)
- Zhang, X; Urbanski, M; Patel, M; Zeck, RE; Cox, GG; Bian, H; Conway, BR; Pat Beavers, M; Rybczynski, PJ; Demarest, KT Heteroaryl-O-glucosides as novel sodium glucose co-transporter 2 inhibitors. Part 1. Bioorg Med Chem Lett 15: 5202-6 (2005)
- Zhang, X; Urbanski, M; Patel, M; Cox, GG; Zeck, RE; Bian, H; Conway, BR; Beavers, MP; Rybczynski, PJ; Demarest, KT Indole-glucosides as novel sodium glucose co-transporter 2 (SGLT2) inhibitors. Part 2. Bioorg Med Chem Lett 16: 1696-701 (2006)
- Madsen, P; Jakobsen, P; Westergaard, N N,N-dibenzyl-N'-benzylidenehydrazines: potent competitive glucose-6-phosphatase catalytic enzyme inhibitors. Bioorg Med Chem Lett 11: 2165-7 (2001)
- Tuccinardi, T; Granchi, C; Iegre, J; Paterni, I; Bertini, S; Macchia, M; Martinelli, A; Qian, Y; Chen, X; Minutolo, F Oxime-based inhibitors of glucose transporter 1 displaying antiproliferative effects in cancer cells. Bioorg Med Chem Lett 23: 6923-7 (2013)
- Fayolle, M; Ionita, M; Krishna, S; Morin, C; Patel, AP Probing structure/affinity relationships for the Plasmodium falciparum hexose transporter with glucose derivatives. Bioorg Med Chem Lett 16: 1267-71 (2006)
- Ohkubo, M; Nishimura, T; Kawamoto, H; Nakano, M; Honma, T; Yoshinari, T; Arakawa, H; Suda, H; Morishima, H; Nishimura, S Synthesis and biological activities of NB-506 analogues modified at the glucose group. Bioorg Med Chem Lett 10: 419-22 (2000)
- Liang, D; Fan, Y; Yang, Z; Zhang, Z; Liu, M; Liu, L; Jiang, C Discovery of coumarin-based selective aldehyde dehydrogenase 1A1 inhibitors with glucose metabolism improving activity. Eur J Med Chem 187: (2020)
- Park, EJ; Kong, Y; Lee, JS; Lee, SH; Lee, J Exploration of SAR regarding glucose moiety in novel C-aryl glucoside inhibitors of SGLT2. Bioorg Med Chem Lett 21: 742-6 (2011)
- Ogawa, AK; Willoughby, CA; Bergeron, R; Ellsworth, KP; Geissler, WM; Myers, RW; Yao, J; Harris, G; Chapman, KT Glucose-lowering in a db/db mouse model by dihydropyridine diacid glycogen phosphorylase inhibitors. Bioorg Med Chem Lett 13: 3405-8 (2003)
- D''Antonio, E Monosaccharide amine and 3-nitro-2-phenyl-2H-chromene based inhibitors of glucose kinases US Patent US11059842 (2021)
- Kodra, JT; Jørgensen, AS; Andersen, B; Behrens, C; Brand, CL; Christensen, IT; Guldbrandt, M; Jeppesen, CB; Knudsen, LB; Madsen, P; Nishimura, E; Sams, C; Sidelmann, UG; Pedersen, RA; Lynn, FC; Lau, J Novel glucagon receptor antagonists with improved selectivity over the glucose-dependent insulinotropic polypeptide receptor. J Med Chem 51: 5387-96 (2008)
- Giordanetto, F; Revell, JD; Knerr, L; Hostettler, M; Paunovic, A; Priest, C; Janefeldt, A; Gill, A Stapled Vasoactive Intestinal Peptide (VIP) Derivatives Improve VPAC2 Agonism and Glucose-Dependent Insulin Secretion. ACS Med Chem Lett 4: 1163-8 (2013)
- Ngoc Toan, V; Dinh Thanh, N; Minh Tri, N; Thi Thu Huong, N Synthesis and biological screening of thiosemicarbazones of substituted 3-acetylcoumarins having d-glucose moiety. Bioorg Med Chem Lett 30: (2020)
- Macias, AT; Williamson, DS; Allen, N; Borgognoni, J; Clay, A; Daniels, Z; Dokurno, P; Drysdale, MJ; Francis, GL; Graham, CJ; Howes, R; Matassova, N; Murray, JB; Parsons, R; Shaw, T; Surgenor, AE; Terry, L; Wang, Y; Wood, M; Massey, AJ Adenosine-derived inhibitors of 78 kDa glucose regulated protein (Grp78) ATPase: insights into isoform selectivity. J Med Chem 54: 4034-41 (2011)
- Arai, H; Hirasawa, Y; Rahman, A; Kusumawati, I; Zaini, NC; Sato, S; Aoyama, C; Takeo, J; Morita, H Alstiphyllanines E-H, picraline and ajmaline-type alkaloids from Alstonia macrophylla inhibiting sodium glucose cotransporter. Bioorg Med Chem 18: 2152-8 (2010)
- Liu, J; Huang, Z; Ma, W; Peng, S; Li, Y; Miranda, KM; Tian, J; Zhang, Y Design and synthesis of rosiglitazone-ferulic acid-nitric oxide donor trihybrids for improving glucose tolerance. Eur J Med Chem 162: 650-665 (2019)
- Crowley, VM; Khandelwal, A; Mishra, S; Stothert, AR; Huard, DJ; Zhao, J; Muth, A; Duerfeldt, AS; Kizziah, JL; Lieberman, RL; Dickey, CA; Blagg, BS Development of Glucose Regulated Protein 94-Selective Inhibitors Based on the BnIm and Radamide Scaffold. J Med Chem 59: 3471-88 (2016)
- Akkemik, E; Budak, H; Ciftci, M Effects of some drugs on human erythrocyte glucose 6-phosphate dehydrogenase: an in vitro study. J Enzyme Inhib Med Chem 25: 871-5 (2010)
- Xu, B; Lv, B; Feng, Y; Xu, G; Du, J; Welihinda, A; Sheng, Z; Seed, B; Chen, Y O-Spiro C-aryl glucosides as novel sodium-dependent glucose co-transporter 2 (SGLT2) inhibitors. Bioorg Med Chem Lett 19: 5632-5 (2009)
- Zhang, J; Xu, X; Zhao, Y; Ren, C; Gu, M; Zhang, H; Wu, P; Wang, Y; Kong, L; Han, C Target Separation and Potential Anticancer Activity of Withanolide-Based Glucose Transporter Protein 1 Inhibitors from J Nat Prod 87: 2-13 (2024)
- Rodriguez Lavado, J; Sestito, SE; Cighetti, R; Aguilar Moncayo, EM; Oblak, A; Lainšcek, D; Jiménez Blanco, JL; García Fernández, JM; Ortiz Mellet, C; Jerala, R; Calabrese, V; Peri, F Trehalose- and glucose-derived glycoamphiphiles: small-molecule and nanoparticle Toll-like receptor 4 (TLR4) modulators. J Med Chem 57: 9105-23 (2014)
- Bokor, É; Kun, S; Docsa, T; Gergely, P; Somsák, L 4(5)-Aryl-2-C-glucopyranosyl-imidazoles as New Nanomolar Glucose Analogue Inhibitors of Glycogen Phosphorylase. ACS Med Chem Lett 6: 1215-9 (2015)
- Luo, Z; Du, D; Liu, Y; Lu, T; Liu, L; Jiang, H; Chen, K; Shan, C; Luo, C Discovery and characterization of a novel glucose-6-phosphate dehydrogenase (G6PD) inhibitor via high-throughput screening. Bioorg Med Chem Lett 40: (2021)
- Goyard, D; Kónya, B; Chajistamatiou, AS; Chrysina, ED; Leroy, J; Balzarin, S; Tournier, M; Tousch, D; Petit, P; Duret, C; Maurel, P; Somsák, L; Docsa, T; Gergely, P; Praly, JP; Azay-Milhau, J; Vidal, S Glucose-derived spiro-isoxazolines are anti-hyperglycemic agents against type 2 diabetes through glycogen phosphorylase inhibition. Eur J Med Chem 108: 444-54 (2016)
- Ueda, T; Ito, T; Tomita, K; Togame, H; Fumoto, M; Asakura, K; Oshima, T; Nishimura, S; Hanasaki, K Identification of glycosylated exendin-4 analogue with prolonged blood glucose-lowering activity through glycosylation scanning substitution. Bioorg Med Chem Lett 20: 4631-4 (2010)
- Recent advances in small molecule and peptide inhibitors of glucose-regulated protein 78 for cancer therapy.
- Yao, CH; Song, JS; Chen, CT; Yeh, TK; Hsieh, TC; Wu, SH; Huang, CY; Huang, YL; Wang, MH; Liu, YW; Tsai, CH; Kumar, CR; Lee, JC Synthesis and biological evaluation of novel C-indolylxylosides as sodium-dependent glucose co-transporter 2 inhibitors. Eur J Med Chem 55: 32-8 (2012)
- Granchi, C ATP citrate lyase (ACLY) inhibitors: An anti-cancer strategy at the crossroads of glucose and lipid metabolism. Eur J Med Chem 157: 1276-1291 (2018)
- Wu, JS; Peng, YH; Wu, JM; Hsieh, CJ; Wu, SH; Coumar, MS; Song, JS; Lee, JC; Tsai, CH; Chen, CT; Liu, YW; Chao, YS; Wu, SY Discovery of non-glycoside sodium-dependent glucose co-transporter 2 (SGLT2) inhibitors by ligand-based virtual screening. J Med Chem 53: 8770-4 (2010)
- Ionita, M; Krishna, S; Léo, PM; Morin, C; Patel, AP Interaction of O-(undec-10-en)-yl-D-glucose derivatives with the Plasmodium falciparum hexose transporter (PfHT). Bioorg Med Chem Lett 17: 4934-7 (2007)
- Washburn, WN Development of the renal glucose reabsorption inhibitors: a new mechanism for the pharmacotherapy of diabetes mellitus type 2. J Med Chem 52: 1785-94 (2009)
- Ma, Z; Jiang, L; Li, B; Liang, D; Feng, Y; Liu, L; Jiang, C Discovery of benzimidazole derivatives as potent and selective aldehyde dehydrogenase 1A1 (ALDH1A1) inhibitors with glucose consumption improving activity. Bioorg Med Chem 46: (2021)
- Kuroda, S; Kobashi, Y; Oi, T; Kawabe, K; Shiozawa, F; Okumura-Kitajima, L; Sugisaki-Kitano, M; Io, F; Yamamoto, K; Kakinuma, H Discovery of potent, low-absorbable sodium-dependent glucose cotransporter 1 (SGLT1) inhibitor SGL5213 for type 2 diabetes treatment. Bioorg Med Chem 27: 394-409 (2019)
- Angeli, A; Ferraroni, M; Granchi, C; Minutolo, F; Chen, X; Shriwas, P; Russo, E; Leo, A; Selleri, S; Carta, F; Supuran, CT First-in-Class Dual Targeting Compounds for the Management of Seizures in Glucose Transporter Type 1 Deficiency Syndrome. J Med Chem 66: 10010-10026 (2023)
- Yuan, MC; Yeh, TK; Chen, CT; Song, JS; Huang, YC; Hsieh, TC; Huang, CY; Huang, YL; Wang, MH; Wu, SH; Yao, CH; Chao, YS; Lee, JC Identification of an oxime-containing C-glucosylarene as a potential inhibitor of sodium-dependent glucose co-transporter 2. Eur J Med Chem 143: 611-620 (2018)
- Huang, Y; Xu, Y; Song, R; Ni, S; Liu, J; Xu, Y; Ren, Y; Rao, L; Wang, Y; Wei, L; Feng, L; Su, C; Peng, C; Li, J; Wan, J Identification of the New Covalent Allosteric Binding Site of Fructose-1,6-bisphosphatase with Disulfiram Derivatives toward Glucose Reduction. J Med Chem 63: 6238-6247 (2020)
- Admyre, T; Amrot-Fors, L; Andersson, M; Bauer, M; Bjursell, M; Drmota, T; Hallen, S; Hartleib-Geschwindner, J; Lindmark, B; Liu, J; Löfgren, L; Rohman, M; Selmi, N; Wallenius, K Inhibition of AMP deaminase activity does not improve glucose control in rodent models of insulin resistance or diabetes. Chem Biol 21: 1486-96 (2014)
- Ovarian Cancer Relies on Glucose Transporter 1 to Fuel Glycolysis and Growth: Anti-Tumor Activity of BAY-876.
- Nguyen, PH; Ji, DJ; Han, YR; Choi, JS; Rhyu, DY; Min, BS; Woo, MH Selaginellin and biflavonoids as protein tyrosine phosphatase 1B inhibitors from Selaginella tamariscina and their glucose uptake stimulatory effects. Bioorg Med Chem 23: 3730-7 (2015)
- Lin, TS; Liw, YW; Song, JS; Hsieh, TC; Yeh, HW; Hsu, LC; Lin, CJ; Wu, SH; Liang, PH Synthesis and biological evaluation of novel C-aryl d-glucofuranosides as sodium-dependent glucose co-transporter 2 inhibitors. Bioorg Med Chem 21: 6282-91 (2013)
- Ye, GJ; Lan, T; Huang, ZX; Cheng, XN; Cai, CY; Ding, SM; Xie, ML; Wang, B Design and synthesis of novel xanthone-triazole derivatives as potential antidiabetic agents: α-Glucosidase inhibition and glucose uptake promotion. Eur J Med Chem 177: 362-373 (2019)
- Clairmont, KB; Buckholz, TM; Pellegrino, CM; Buxton, JM; Barucci, N; Bell, A; Ha, S; Li, F; Claus, TH; Salhanick, AI; Lumb, KJ Engineering of a VPAC2 receptor peptide agonist to impart dipeptidyl peptidase IV stability and enhance in vivo glucose disposal. J Med Chem 49: 7545-8 (2006)
- Lv, B; Xu, B; Feng, Y; Peng, K; Xu, G; Du, J; Zhang, L; Zhang, W; Zhang, T; Zhu, L; Ding, H; Sheng, Z; Welihinda, A; Seed, B; Chen, Y Exploration of O-spiroketal C-arylglucosides as novel and selective renal sodium-dependent glucose co-transporter 2 (SGLT2) inhibitors. Bioorg Med Chem Lett 19: 6877-81 (2009)
- Nomura, S; Yamamoto, Y; Matsumura, Y; Ohba, K; Sakamaki, S; Kimata, H; Nakayama, K; Kuriyama, C; Matsushita, Y; Ueta, K; Tsuda-Tsukimoto, M Novel Indole-N-glucoside, TA-1887 As a Sodium Glucose Cotransporter 2 Inhibitor for Treatment of Type 2 Diabetes. ACS Med Chem Lett 5: 51-5 (2014)
- Cai, X; Sun, L; Dai, Y; Avraham, Y; Liu, C; Han, J; Liu, Y; Feng, D; Huang, W; Qian, H Novel fatty acid chain modified GLP-1 derivatives with prolonged in vivo glucose-lowering ability and balanced glucoregulatory activity. Bioorg Med Chem 26: 2599-2609 (2018)
- Thanh, ND; Lan, PH; Hai, DS; Anh, HH; Giang, NTK; Van, HTK; Toan, VN; Tri, NM; Toan, DN Thiourea derivatives containing 4-arylthiazoles and d-glucose moiety: design, synthesis, antimicrobial activity evaluation, and molecular docking/dynamics simulations. RSC Med Chem 14: 1114-1130 (2023)
- Vernaleken, A; Veyhl, M; Gorboulev, V; Kottra, G; Palm, D; Burckhardt, BC; Burckhardt, G; Pipkorn, R; Beier, N; van Amsterdam, C; Koepsell, H Tripeptides of RS1 (RSC1A1) inhibit a monosaccharide-dependent exocytotic pathway of Na+-D-glucose cotransporter SGLT1 with high affinity. J Biol Chem 282: 28501-13 (2007)
- Xu, B; Feng, Y; Lv, B; Xu, G; Zhang, L; Du, J; Peng, K; Xu, M; Dong, J; Zhang, W; Zhang, T; Zhu, L; Ding, H; Sheng, Z; Welihinda, A; Seed, B; Chen, Y ortho-Substituted C-aryl glucosides as highly potent and selective renal sodium-dependent glucose co-transporter 2 (SGLT2) inhibitors. Bioorg Med Chem 18: 4422-32 (2010)
- Bai, X; Niu, Y; Zhu, J; Yang, AQ; Wu, YF; Ye, XS A new GLP-1 analogue with prolonged glucose-lowering activity in vivo via backbone-based modification at the N-terminus. Bioorg Med Chem 24: 1163-70 (2016)
- Shin, ES; Park, J; Shin, JM; Cho, D; Cho, SY; Shin, DW; Ham, M; Kim, JB; Lee, TR Catechin gallates are NADP+-competitive inhibitors of glucose-6-phosphate dehydrogenase and other enzymes that employ NADP+ as a coenzyme. Bioorg Med Chem 16: 3580-6 (2008)
- Kong, YK; Song, KS; Jung, ME; Kang, M; Kim, HJ; Kim, MJ Discovery of GCC5694A: A potent and selective sodium glucose co-transporter 2 inhibitor for the treatment of type 2 diabetes. Bioorg Med Chem Lett 56: (2022)
- PubChem, PC Dose Response confirmation of uHTS small molecule inhibitors of Plasmodium falciparum Glucose-6-phosphate dehydrogenase via a fluorescence intensity assay PubChem Bioassay (2011)
- Cordeiro, AT; Thiemann, OH; Michels, PA Inhibition of Trypanosoma brucei glucose-6-phosphate dehydrogenase by human steroids and their effects on the viability of cultured parasites. Bioorg Med Chem 17: 2483-9 (2009)
- Goodwin, NC; Mabon, R; Harrison, BA; Shadoan, MK; Almstead, ZY; Xie, Y; Healy, J; Buhring, LM; DaCosta, CM; Bardenhagen, J; Mseeh, F; Liu, Q; Nouraldeen, A; Wilson, AG; Kimball, SD; Powell, DR; Rawlins, DB Novel L-xylose derivatives as selective sodium-dependent glucose cotransporter 2 (SGLT2) inhibitors for the treatment of type 2 diabetes. J Med Chem 52: 6201-4 (2009)
- Lin, H; Han, H; Yang, M; Wen, Z; Chen, Q; Ma, Y; Wang, X; Wang, C; Yin, T; Wang, X; Lu, G; Chen, H; Qi, J; Yang, Y PKM2/PDK1 dual-targeted shikonin derivatives restore the sensitivity of EGFR-mutated NSCLC cells to gefitinib by remodeling glucose metabolism. Eur J Med Chem 249: (2023)
- Zhao, X; Sun, B; Zheng, H; Liu, J; Qian, L; Wang, X; Lou, H Synthesis and biological evaluation of 6-hydroxyl C-aryl glucoside derivatives as novel sodium glucose co-transporter 2 (SGLT2) inhibitors. Bioorg Med Chem Lett 28: 2201-2205 (2018)
- Obianom, ON; Ai, Y; Li, Y; Yang, W; Guo, D; Yang, H; Sakamuru, S; Xia, M; Xue, F; Shu, Y Triazole-Based Inhibitors of the Wnt/β-Catenin Signaling Pathway Improve Glucose and Lipid Metabolisms in Diet-Induced Obese Mice. J Med Chem 62: 727-741 (2019)
- Koperniku, A; Garcia, AA; Mochly-Rosen, D Boosting the Discovery of Small Molecule Inhibitors of Glucose-6-Phosphate Dehydrogenase for the Treatment of Cancer, Infectious Diseases, and Inflammation. J Med Chem 65: 4403-4423 (2022)
- Meng, W; Ellsworth, BA; Nirschl, AA; McCann, PJ; Patel, M; Girotra, RN; Wu, G; Sher, PM; Morrison, EP; Biller, SA; Zahler, R; Deshpande, PP; Pullockaran, A; Hagan, DL; Morgan, N; Taylor, JR; Obermeier, MT; Humphreys, WG; Khanna, A; Discenza, L; Robertson, JG; Wang, A; Han, S; Wetterau, JR; Janovitz, EB; Flint, OP; Whaley, JM; Washburn, WN Discovery of Dapagliflozin: A Potent, Selective Renal Sodium-Dependent Glucose Cotransporter 2 (SGLT2) Inhibitor for the Treatment of Type 2 Diabetes. J Med Chem 51: 1145-9 (2008)
- Goodwin, NC; Ding, ZM; Harrison, BA; Strobel, ED; Harris, AL; Smith, M; Thompson, AY; Xiong, W; Mseeh, F; Bruce, DJ; Diaz, D; Gopinathan, S; Li, L; O'Neill, E; Thiel, M; Wilson, AG; Carson, KG; Powell, DR; Rawlins, DB Discovery of LX2761, a Sodium-Dependent Glucose Cotransporter 1 (SGLT1) Inhibitor Restricted to the Intestinal Lumen, for the Treatment of Diabetes. J Med Chem 60: 710-721 (2017)
- Li, Y; Shi, Z; Chen, L; Zheng, S; Li, S; Xu, B; Liu, Z; Liu, J; Deng, C; Ye, F Discovery of a Potent, Selective Renal Sodium-Dependent Glucose Cotransporter 2 (SGLT2) Inhibitor (HSK0935) for the Treatment of Type 2 Diabetes. J Med Chem 60: 4173-4184 (2017)
- Mascitti, V; Maurer, TS; Robinson, RP; Bian, J; Boustany-Kari, CM; Brandt, T; Collman, BM; Kalgutkar, AS; Klenotic, MK; Leininger, MT; Lowe, A; Maguire, RJ; Masterson, VM; Miao, Z; Mukaiyama, E; Patel, JD; Pettersen, JC; Préville, C; Samas, B; She, L; Sobol, Z; Steppan, CM; Stevens, BD; Thuma, BA; Tugnait, M; Zeng, D; Zhu, T Discovery of a clinical candidate from the structurally unique dioxa-bicyclo[3.2.1]octane class of sodium-dependent glucose cotransporter 2 inhibitors. J Med Chem 54: 2952-60 (2011)
- Kuroda, S; Kobashi, Y; Oi, T; Amada, H; Okumura-Kitajima, L; Io, F; Yamamto, K; Kakinuma, H Discovery of a potent, low-absorbable sodium-dependent glucose cotransporter 1 (SGLT1) inhibitor (TP0438836) for the treatment of type 2 diabetes. Bioorg Med Chem Lett 28: 3534-3539 (2018)
- Alencar, N; Sola, I; Linares, M; Juárez-Jiménez, J; Pont, C; Viayna, A; Vílchez, D; Sampedro, C; Abad, P; Pérez-Benavente, S; Lameira, J; Bautista, JM; Muñoz-Torrero, D; Luque, FJ First homology model of Plasmodium falciparum glucose-6-phosphate dehydrogenase: Discovery of selective substrate analog-based inhibitors as novel antimalarial agents. Eur J Med Chem 146: 108-122 (2018)
- Nathubhai, A; Haikarainen, T; Koivunen, J; Murthy, S; Koumanov, F; Lloyd, MD; Holman, GD; Pihlajaniemi, T; Tosh, D; Lehtiö, L; Threadgill, MD Highly Potent and Isoform Selective Dual Site Binding Tankyrase/Wnt Signaling Inhibitors That Increase Cellular Glucose Uptake and Have Antiproliferative Activity. J Med Chem 60: 814-820 (2017)
- Jesus, AR; Vila-Viçosa, D; Machuqueiro, M; Marques, AP; Dore, TM; Rauter, AP Targeting Type 2 Diabetes with C-Glucosyl Dihydrochalcones as Selective Sodium Glucose Co-Transporter 2 (SGLT2) Inhibitors: Synthesis and Biological Evaluation. J Med Chem 60: 568-579 (2017)
- Wen, W; Cao, H; Xu, Y; Ren, Y; Rao, L; Shao, X; Chen, H; Wu, L; Liu, J; Su, C; Peng, C; Huang, Y; Wan, J -Acylamino Saccharin as an Emerging Cysteine-Directed Covalent Warhead and Its Application in the Identification of Novel FBPase Inhibitors toward Glucose Reduction. J Med Chem 65: 9126-9143 (2022)
- Ohtake, Y; Sato, T; Matsuoka, H; Nishimoto, M; Taka, N; Takano, K; Yamamoto, K; Ohmori, M; Higuchi, T; Murakata, M; Kobayashi, T; Morikawa, K; Shimma, N; Suzuki, M; Hagita, H; Ozawa, K; Yamaguchi, K; Kato, M; Ikeda, S 5a-Carba-ß-D-glucopyranose derivatives as novel sodium-dependent glucose cotransporter 2 (SGLT2) inhibitors for the treatment of type 2 diabetes. Bioorg Med Chem 19: 5334-41 (2011)
- Ohtake, Y; Sato, T; Matsuoka, H; Kobayashi, T; Nishimoto, M; Taka, N; Takano, K; Yamamoto, K; Ohmori, M; Higuchi, T; Murakata, M; Morikawa, K; Shimma, N; Suzuki, M; Hagita, H; Ozawa, K; Yamaguchi, K; Kato, M; Ikeda, S C-Aryl 5a-carba-ß-d-glucopyranosides as novel sodium glucose cotransporter 2 (SGLT2) inhibitors for the treatment of type 2 diabetes. Bioorg Med Chem 20: 4117-27 (2012)
- Putapatri, SR; Kanwal, A; Banerjee, SK; Kantevari, S Synthesis of novel l-rhamnose derived acyclic C-nucleosides with substituted 1,2,3-triazole core as potent sodium-glucose co-transporter (SGLT) inhibitors. Bioorg Med Chem Lett 24: 1528-31 (2014)
- Lasalle, M; Hoguet, V; Hennuyer, N; Leroux, F; Piveteau, C; Belloy, L; Lestavel, S; Vallez, E; Dorchies, E; Duplan, I; Sevin, E; Culot, M; Gosselet, F; Boulahjar, R; Herledan, A; Staels, B; Deprez, B; Tailleux, A; Charton, J Topical Intestinal Aminoimidazole Agonists of G-Protein-Coupled Bile Acid Receptor 1 Promote Glucagon Like Peptide-1 Secretion and Improve Glucose Tolerance. J Med Chem 60: 4185-4211 (2017)
- Robbins, JD; Laurenza, A; Kosley, RW; O'Malley, GJ; Spahl, B; Seamon, KB (Aminoalkyl)carbamates of forskolin: intermediates for the synthesis of functionalized derivatives of forskolin with different specificities for adenylyl cyclase and the glucose transporter. J Med Chem 34: 3204-12 (1991)
- Discovery of a Novel Thienopyrimidine Compound as a Urate Transporter 1 and Glucose Transporter 9 Dual Inhibitor with Improved Efficacy and Favorable Druggability.
- Semple, G; Ren, A; Fioravanti, B; Pereira, G; Calderon, I; Choi, K; Xiong, Y; Shin, YJ; Gharbaoui, T; Sage, CR; Morgan, M; Xing, C; Chu, ZL; Leonard, JN; Grottick, AJ; Al-Shamma, H; Liang, Y; Demarest, KT; Jones, RM Discovery of fused bicyclic agonists of the orphan G-protein coupled receptor GPR119 with in vivo activity in rodent models of glucose control. Bioorg Med Chem Lett 21: 3134-41 (2011)
- Chang, CC; Chao, YS; Chen, CT; Chiu, CH; Chu, KF; Hsiao, WC; Hsieh, CJ; Yuan, MC; Hsieh, TC; Huang, CY; Hung, MS; Lee, JC; Liu, YW; Song, JS; Tsai, CH; Wang, MH; Wu, SH; Yao, CH; Yeh, TK Discovery of novel N-ß-D-xylosylindole derivatives as sodium-dependent glucose cotransporter 2 (SGLT2) inhibitors for the management of hyperglycemia in diabetes. J Med Chem 54: 166-78 (2011)
- PubChem, PC Dose Response orthogonal kinetic assay utilizing the direct detection of NADPH for uHTS small molecule inhibitors of Plasmodium falciparum Glucose-6-phosphate dehydrogenase PubChem Bioassay (2011)
- Oyugi, MA; Bashiri, G; Baker, EN; Johnson-Winters, K Investigating the Reaction Mechanism of F420-Dependent Glucose-6-phosphate Dehydrogenase from Mycobacterium tuberculosis: Kinetic Analysis of the Wild-Type and Mutant Enzymes. Biochemistry 55: 5566-5577 (2016)
- PubChem, PC Dose Response orthogonal assay utilizing the direct end-point detection of NADPH for uHTS small molecule inhibitors of Plasmodium falciparum Glucose-6-phosphate dehydrogenase PubChem Bioassay (2011)
- Zhang, P; Li, S; Gao, Y; Lu, W; Huang, K; Ye, D; Li, X; Chu, Y Novel benzothiazinones (BTOs) as allosteric modulator or substrate competitive inhibitor of glycogen synthase kinase 3ß (GSK-3ß) with cellular activity of promoting glucose uptake. Bioorg Med Chem Lett 24: 5639-43 (2014)
- Nomura, S; Sakamaki, S; Hongu, M; Kawanishi, E; Koga, Y; Sakamoto, T; Yamamoto, Y; Ueta, K; Kimata, H; Nakayama, K; Tsuda-Tsukimoto, M Discovery of canagliflozin, a novel C-glucoside with thiophene ring, as sodium-dependent glucose cotransporter 2 inhibitor for the treatment of type 2 diabetes mellitus. J Med Chem 53: 6355-60 (2010)
- Honda, T; Kaneno-Urasaki, Y; Murai, T; Kakuta, M; Nasu, H; Namba, E; Koga, T; Okuno, A; Izumi, T Absorption, elimination, and metabolism of CS-1036, a novela-amylase inhibitor in rats and monkeys, and the relationship between gastrointestinal distribution and suppression of glucose absorption. Drug Metab Dispos 41: 878-87 (2013)
- Fan, Y; Jiang, T; Cashion, DK; Sun, Z; Tian, F; DaRe, J; Lemus, R Discovery of a series of phosphonic acid-containing thiazoles and orally bioavailable diamide prodrugs that lower glucose in diabetic animals through inhibition of fructose-1,6-bisphosphatase. J Med Chem 54: 153-65 (2011)
- Thanh, ND; Hai, DS; Ngoc Bich, VT; Thu Hien, PT; Ky Duyen, NT; Mai, NT; Dung, TT; Toan, VN; Kim Van, HT; Dang, LH; Toan, DN; Thanh Van, TT Efficient click chemistry towards novel 1H-1,2,3-triazole-tethered 4H-chromene-d-glucose conjugates: Design, synthesis and evaluation of in vitro antibacterial, MRSA and antifungal activities. Eur J Med Chem 167: 454-471 (2019)
- Bülbül, M; Erat, M Investigation of the effects of some sulfonamide derivatives on the activities of glucose-6-phosphate dehydrogenase, 6-phospho gluconate dehydrogenase and glutathione reductase from human erythrocytes. J Enzyme Inhib Med Chem 23: 418-23 (2008)
- Xu, B; Feng, Y; Cheng, H; Song, Y; Lv, B; Wu, Y; Wang, C; Li, S; Xu, M; Du, J; Peng, K; Dong, J; Zhang, W; Zhang, T; Zhu, L; Ding, H; Sheng, Z; Welihinda, A; Roberge, JY; Seed, B; Chen, Y C-aryl glucosides substituted at the 4'-position as potent and selective renal sodium-dependent glucose co-transporter 2 (SGLT2) inhibitors for the treatment of type 2 diabetes. Bioorg Med Chem Lett 21: 4465-70 (2011)
- Harada, H; Asano, O; Hoshino, Y; Yoshikawa, S; Matsukura, M; Kabasawa, Y; Niijima, J; Kotake, Y; Watanabe, N; Kawata, T; Inoue, T; Horizoe, T; Yasuda, N; Minami, H; Nagata, K; Murakami, M; Nagaoka, J; Kobayashi, S; Tanaka, I; Abe, S 2-Alkynyl-8-aryl-9-methyladenines as novel adenosine receptor antagonists: their synthesis and structure-activity relationships toward hepatic glucose production induced via agonism of the A(2B) receptor. J Med Chem 44: 170-9 (2001)
- Wang, Y; Lou, Y; Wang, J; Li, D; Chen, H; Zheng, T; Xia, C; Song, X; Dong, T; Li, J; Li, J; Liu, H Design, synthesis and biological evaluation of 6-deoxy O-spiroketal C-arylglucosides as novel renal sodium-dependent glucose cotransporter 2 (SGLT2) inhibitors for the treatment of type 2 diabetes. Eur J Med Chem 180: 398-416 (2019)
- Xu, G; Lv, B; Roberge, JY; Xu, B; Du, J; Dong, J; Chen, Y; Peng, K; Zhang, L; Tang, X; Feng, Y; Xu, M; Fu, W; Zhang, W; Zhu, L; Deng, Z; Sheng, Z; Welihinda, A; Sun, X Design, synthesis, and biological evaluation of deuterated C-aryl glycoside as a potent and long-acting renal sodium-dependent glucose cotransporter 2 inhibitor for the treatment of type 2 diabetes. J Med Chem 57: 1236-51 (2014)
- Ohtake, Y; Sato, T; Kobayashi, T; Nishimoto, M; Taka, N; Takano, K; Yamamoto, K; Ohmori, M; Yamaguchi, M; Takami, K; Yeu, SY; Ahn, KH; Matsuoka, H; Morikawa, K; Suzuki, M; Hagita, H; Ozawa, K; Yamaguchi, K; Kato, M; Ikeda, S Discovery of tofogliflozin, a novel C-arylglucoside with an O-spiroketal ring system, as a highly selective sodium glucose cotransporter 2 (SGLT2) inhibitor for the treatment of type 2 diabetes. J Med Chem 55: 7828-40 (2012)
- Imamura, M; Nakanishi, K; Suzuki, T; Ikegai, K; Shiraki, R; Ogiyama, T; Murakami, T; Kurosaki, E; Noda, A; Kobayashi, Y; Yokota, M; Koide, T; Kosakai, K; Ohkura, Y; Takeuchi, M; Tomiyama, H; Ohta, M Discovery of Ipragliflozin (ASP1941): a novel C-glucoside with benzothiophene structure as a potent and selective sodium glucose co-transporter 2 (SGLT2) inhibitor for the treatment of type 2 diabetes mellitus. Bioorg Med Chem 20: 3263-79 (2012)
- Fushimi, N; Fujikura, H; Shiohara, H; Teranishi, H; Shimizu, K; Yonekubo, S; Ohno, K; Miyagi, T; Itoh, F; Shibazaki, T; Tomae, M; Ishikawa-Takemura, Y; Nakabayashi, T; Kamada, N; Ozawa, T; Kobayashi, S; Isaji, M Structure-activity relationship studies of 4-benzyl-1H-pyrazol-3-ylß-d-glucopyranoside derivatives as potent and selective sodium glucose co-transporter 1 (SGLT1) inhibitors with therapeutic activity on postprandial hyperglycemia. Bioorg Med Chem 20: 6598-612 (2012)
- Kakinuma, H; Oi, T; Hashimoto-Tsuchiya, Y; Arai, M; Kawakita, Y; Fukasawa, Y; Iida, I; Hagima, N; Takeuchi, H; Chino, Y; Asami, J; Okumura-Kitajima, L; Io, F; Yamamoto, D; Miyata, N; Takahashi, T; Uchida, S; Yamamoto, K (1S)-1,5-anhydro-1-[5-(4-ethoxybenzyl)-2-methoxy-4-methylphenyl]-1-thio-D-glucitol (TS-071) is a potent, selective sodium-dependent glucose cotransporter 2 (SGLT2) inhibitor for type 2 diabetes treatment. J Med Chem 53: 3247-61 (2010)
- Fushimi, N; Teranishi, H; Shimizu, K; Yonekubo, S; Ohno, K; Miyagi, T; Itoh, F; Shibazaki, T; Tomae, M; Ishikawa-Takemura, Y; Nakabayashi, T; Kamada, N; Yamauchi, Y; Kobayashi, S; Isaji, M Design, synthesis, and structure-activity relationships of a series of 4-benzyl-5-isopropyl-1H-pyrazol-3-ylß-D-glycopyranosides substituted with novel hydrophilic groups as highly potent inhibitors of sodium glucose co-transporter 1 (SGLT1). Bioorg Med Chem 21: 748-65 (2013)
- Negoro, N; Sasaki, S; Mikami, S; Ito, M; Tsujihata, Y; Ito, R; Suzuki, M; Takeuchi, K; Suzuki, N; Miyazaki, J; Santou, T; Odani, T; Kanzaki, N; Funami, M; Morohashi, A; Nonaka, M; Matsunaga, S; Yasuma, T; Momose, Y Optimization of (2,3-dihydro-1-benzofuran-3-yl)acetic acids: discovery of a non-free fatty acid-like, highly bioavailable G protein-coupled receptor 40/free fatty acid receptor 1 agonist as a glucose-dependent insulinotropic agent. J Med Chem 55: 3960-74 (2012)
- Devasthale, PV; Chen, S; Jeon, Y; Qu, F; Shao, C; Wang, W; Zhang, H; Cap, M; Farrelly, D; Golla, R; Grover, G; Harrity, T; Ma, Z; Moore, L; Ren, J; Seethala, R; Cheng, L; Sleph, P; Sun, W; Tieman, A; Wetterau, JR; Doweyko, A; Chandrasena, G; Chang, SY; Humphreys, WG; Sasseville, VG; Biller, SA; Ryono, DE; Selan, F; Hariharan, N; Cheng, PT Design and synthesis of N-[(4-methoxyphenoxy)carbonyl]-N-[[4-[2-(5- methyl-2-phenyl-4-oxazolyl)ethoxy]phenyl]methyl]glycine [Muraglitazar/BMS-298585], a novel peroxisome proliferator-activated receptor alpha/gamma dual agonist with efficacious glucose and lipid-lowering activities. J Med Chem 48: 2248-50 (2005)
- Preuss, J; Maloney, P; Peddibhotla, S; Hedrick, MP; Hershberger, P; Gosalia, P; Milewski, M; Li, YL; Sugarman, E; Hood, B; Suyama, E; Nguyen, K; Vasile, S; Sergienko, E; Mangravita-Novo, A; Vicchiarelli, M; McAnally, D; Smith, LH; Roth, GP; Diwan, J; Chung, TD; Jortzik, E; Rahlfs, S; Becker, K; Pinkerton, AB; Bode, L Discovery of a Plasmodium falciparum glucose-6-phosphate dehydrogenase 6-phosphogluconolactonase inhibitor (R,Z)-N-((1-ethylpyrrolidin-2-yl)methyl)-2-(2-fluorobenzylidene)-3-oxo-3,4-dihydro-2H-benzo[b][1,4]thiazine-6-carboxamide (ML276) that reduces parasite growth in vitro. J Med Chem 55: 7262-72 (2012)
- ChEMBL_486571 (CHEMBL1018340) Inhibition of rat intestinal maltase assessed as glucose release by Glucose B-test
- ChEMBL_486577 (CHEMBL1020971) Inhibition of rat intestinal sucrase assessed as glucose release by Glucose B-test
- ChEMBL_486579 (CHEMBL1020973) Inhibition of rat intestinal isomaltase assessed as glucose release by Glucose B-test
- ChEMBL_501266 (CHEMBL976168) Inhibition of glucose-6-phosphatase
- ChEMBL_1664958 (CHEMBL4014754) Activation of recombinant human glucokinase assessed as conversion of D-glucose to D-glucose-6-phosphate in presence of 2.5 mM glucose by G6PDH coupled spectrophotometric assay
- ChEMBL_1664960 (CHEMBL4014756) Activation of recombinant human glucokinase assessed as conversion of D-glucose to D-glucose-6-phosphate in presence of 10 mM glucose by G6PDH coupled spectrophotometric assay
- ChEMBL_1664995 (CHEMBL4014791) Activation of recombinant human glucokinase assessed as conversion of D-glucose to D-glucose-6-phosphate in presence of 10 mM glucose by G6PDH coupled spectrophotometric assay
- ChEMBL_545872 (CHEMBL1034387) Inhibition of yeast alpha-glucosidase assessed as D-glucose release after 30 mins by Glucose B-test
- ChEMBL_545873 (CHEMBL1034388) Inhibition of rat intestinal maltase assessed as D-glucose release after 30 mins by Glucose B-test
- ChEMBL_545875 (CHEMBL1034390) Inhibition of Caldocellum saccharolyticum beta-glucosidase assessed as D-glucose release after 30 mins by Glucose B-test
- ChEMBL_545874 (CHEMBL1034389) Inhibition of rat liver lysosome alpha-glucosidase assessed as D-glucose release after 30 mins by Glucose B-test
- ChEMBL_565878 (CHEMBL959301) Activation of human glucokinase by glucose-6-phosphate dehydrogenase coupled continuous spectrophotometric assay in presence of 2.5 mM glucose
- ChEMBL_565879 (CHEMBL959302) Activation of human glucokinase by glucose-6-phosphate dehydrogenase coupled continuous spectrophotometric assay in presence of 10 mM glucose
- ChEMBL_1924594 (CHEMBL4427550) Activation of human recombinant glucokinase using 5 mM glucose monitored over 5 mins in presence of NAD+ and glucose 6-phosphate 4% human serum albumin by glucose 6-phosphate dehydrogenase coupled assay
- ChEMBL_447975 (CHEMBL898227) Inhibition of glucose 6 phosphate translocase 1
- ChEMBL_575563 (CHEMBL1036406) Inhibition of rat liver glucose-6-phosphatase
- ChEMBL_1519497 (CHEMBL3625683) Inhibition of rat intestinal Maltase using maltose as substrate assessed as glucose release after 10 mins by glucose oxidase method
- ChEMBL_1519498 (CHEMBL3625684) Inhibition of rat intestinal Sucrase using sucrose as substrate assessed as glucose release after 40 mins by glucose oxidase method
- Inhibition Assay Inhibition assay using glucose-1-phosphate thymidylyltransferase (RmlA).
- ChEMBL_1554316 (CHEMBL3766855) Inhibition of glycogen phosphorylase in human hepatocytes assessed as decrease in glucagon stimulated glucose release after 3 hrs by glucose oxidase method
- ChEMBL_1924392 (CHEMBL4427348) Activation of human recombinant glucokinase using 5 mM glucose as substrate in presence of NAD+ by glucose 6-phosphate dehydrogenase coupled assay
- ChEMBL_602872 (CHEMBL1065927) Activation of human liver glucokinase expressed in CHO cells at 2.5 mM glucose concentration by glucose-6-phosphate coupled continuous spectrophotometric assay
- ChEMBL_602874 (CHEMBL1038417) Activation of human liver glucokinase expressed in CHO cells at 10 mM glucose concentration by glucose-6-phosphate coupled continuous spectrophotometric assay
- ChEMBL_1554315 (CHEMBL3766854) Inhibition of glycogen phosphorylase in Wistar rat hepatocytes assessed as decrease in glucagon stimulated glucose release after 3 hrs by glucose oxidase method
- ChEMBL_1297748 (CHEMBL3131380) Activation of glucokinase (unknown origin) using glucose as substrate
- ChEMBL_304261 (CHEMBL829031) Effective concentration for glucokinase activation with 5 mM glucose
- ChEMBL_304263 (CHEMBL829033) Effective concentration for glucokinase activation with 15 mM glucose
- ChEMBL_424350 (CHEMBL909553) Inhibition of human liver GPa in presence of glucose
- ChEMBL_424351 (CHEMBL909554) Inhibition of human liver GPa in absence of glucose
- ChEMBL_1924593 (CHEMBL4427549) Activation of human recombinant glucokinase using 5 mM glucose monitored over 5 mins in presence of NAD+ by glucose 6-phosphate dehydrogenase coupled assay
- ChEMBL_1924393 (CHEMBL4427349) Activation of human recombinant glucokinase using 5 mM glucose as substrate in presence of NAD+ and 4% HSA by glucose 6-phosphate dehydrogenase coupled assay
- ChEMBL_34553 (CHEMBL646886) Inhibition of yeast alpha-glucosidase after addition of D-glucose
- ChEMBL_491666 (CHEMBL946384) Inhibition of human glycogen phosphorylase alpha in presence of glucose
- ChEMBL_491667 (CHEMBL946385) Inhibition of human glycogen phosphorylase alpha in absence of glucose
- ChEMBL_550868 (CHEMBL1007667) Inhibition of Wistar rat intestinal isomaltase by glucose B-test
- ChEMBL_566717 (CHEMBL961709) Inhibition of human kidney SGLT2 assessed as renal glucose reabsorption
- ChEMBL_1436697 (CHEMBL3384773) Activation of purified human glucokinase isoform 3 (13 to 466 aa) using 5 mM glucose by spectrophotometry in presence of NAD+ and glucose 6-phosphate dehydrogenase
- ChEMBL_1554117 (CHEMBL3768919) Activation of recombinant human glucokinase assessed as NADPH formation using glucose as substrate incubated for 30 mins in presence of NADP+ and glucose 6-phosphate dehydrogenase
- ChEMBL_1645848 (CHEMBL3994904) Inhibition of sucrase in rat small intestinal mucosa assessed as reduction in glucose production using sucrose as substrate measured after 40 mins by glucose oxidase assay
- ChEMBL_1758345 (CHEMBL4193353) Activation of recombinant human liver glucokinase 2 assessed as assessed as reduction in Km for glucose in presence of 5 mM glucose by G6PDH coupled assay
- ChEMBL_1909269 (CHEMBL4411715) Inhibition of glucose-6-phosphatase in rat H42E cells using glucose-6-phosphate as substrate preincubated overnight followed by substrate addition and measured after 40 mins
- ChEMBL_566832 (CHEMBL957641) Activation of flag-tagged human recombinant liver glucokinase expressed in Escherichia coli by glucose-6-phosphate dehydrogenase coupled continuous spectrophotometric assay in presence of 2.5 mM glucose
- ChEMBL_566834 (CHEMBL957643) Activation of flag-tagged human recombinant liver glucokinase expressed in Escherichia coli by glucose-6-phosphate dehydrogenase coupled continuous spectrophotometric assay in presence of 10 mM glucose
- ChEMBL_576767 (CHEMBL1032034) Activation of flag-tagged human recombinant liver glucokinase expressed in Escherichia coli by glucose-6-phosphate dehydrogenase coupled continuous spectrophotometric assay in presence of 2.5 mM glucose
- ChEMBL_576768 (CHEMBL1032035) Activation of flag-tagged human recombinant liver glucokinase expressed in Escherichia coli by glucose-6-phosphate dehydrogenase coupled continuous spectrophotometric assay in presence of 10 mM glucose
- ChEMBL_557775 (CHEMBL953284) Inhibition of human liver glycogen phosphorylase a in absence of glucose
- ChEMBL_557776 (CHEMBL953285) Inhibition of human liver glycogen phosphorylase a in presence of glucose
- ChEMBL_701783 (CHEMBL1656920) Inhibition of sucrase in mouse intestinal input by glucose release assay
- ChEMBL_701784 (CHEMBL1656921) Inhibition of lactase in mouse intestinal input by glucose release assay
- ChEMBL_701785 (CHEMBL1656922) Inhibition of maltase in mouse intestinal input by glucose release assay
- ChEMBL_750244 (CHEMBL1788085) Activation of human recombinant glucokinase using 6.5 mM glucose by spectrophotometry
- ChEMBL_873671 (CHEMBL2188787) Agonist activity at rat P2Y1R assessed as glucose-dependent insulin secretion
- ChEMBL_935336 (CHEMBL2318453) Induction of human hepatic glucokinase activity at 5 mM glucose concentration
- ChEMBL_935338 (CHEMBL2318649) Induction of human pancreatic glucokinase activity at 5 mM glucose concentration
- ChEMBL_979855 (CHEMBL2422398) Inhibition of Fas-mediated cell death in oxygen and glucose deprived rat H9c2 cells treated 30 mins before oxygen and glucose deprivation measured after 6 hrs by DAPI staining
- ChEMBL_1339208 (CHEMBL3243402) Activation of recombinant human pancreatic glucokinase using 10 mM glucose by spectrophotometry
- ChEMBL_2284250 Inhibition of FBPase in rat Primary hepatocyte assessed as reduction in glucose production
- ChEMBL_338364 (CHEMBL866544) Inhibition of D-glucose uptake mediated by PfHT expressed in Xenopus oocytes
- ChEMBL_745322 (CHEMBL1775397) Activation of FFA1 in mouse islets assessed as glucose-dependent insulin secretion
- ChEMBL_858378 (CHEMBL2168593) Activation of human recombinant glucokinase using 6.5 mM glucose by spectrophotometric analysis
- ChEMBL_974049 (CHEMBL2410527) Activation of human recombinant glucokinase by matrix assay in presence of glucose
- ChEMBL_1878663 (CHEMBL4380057) Inhibition of human recombinant CYP1B1 using 7-ethoxyresorufin as substrate in presence of glucose-6-phosphate, glucose-6-phosphate dehydrogenase and NADPH-generating system incubated for 35 mins by fluorometry
- ChEMBL_1878664 (CHEMBL4380058) Inhibition of human recombinant CYP1A1 using 7-ethoxyresorufin as substrate in presence of glucose-6-phosphate, glucose-6-phosphate dehydrogenase and NADPH-generating system incubated for 15 mins by fluorometry
- ChEMBL_1878665 (CHEMBL4380059) Inhibition of human recombinant CYP1A2 using 7-ethoxyresorufin as substrate in presence of glucose-6-phosphate, glucose-6-phosphate dehydrogenase and NADPH-generating system incubated for 50 mins by fluorometry
- ChEMBL_1436698 (CHEMBL3384774) Activation of purified human glucokinase isoform 3 (13 to 466 aa) using 5 mM glucose by spectrophotometry in presence of NAD+ and glucose 6-phosphate dehydrogenase in presence of 4% HSA
- ChEMBL_588966 (CHEMBL1056161) Activation of N-terminal His-tagged human recombinant liver glucokinase expressed in Escherichia coli BL21 (DE3) by glucose-6-phosphate dehydrogenase coupled continuous spectrophotometric assay in presence of 2.5 mM glucose
- ChEMBL_588968 (CHEMBL1056163) Activation of N-terminal His-tagged human recombinant liver glucokinase expressed in Escherichia coli BL21 (DE3) by glucose-6-phosphate dehydrogenase coupled continuous spectrophotometric assay in presence of 10 mM glucose
- ChEBML_71573 Inhibition of [125I]7-IHPP-Fsk binding to glucose transporter of human erythrocyte membrane
- ChEMBL_1518286 (CHEMBL3620261) Antagonist activity against human glucose dependent insulinotropic peptide receptor by cAMP accumulation assay
- ChEMBL_202730 (CHEMBL809058) Binding affinity against Sodium/glucose co-transporter of isolated renal brush border membranes.
- ChEMBL_438958 (CHEMBL889301) Inhibition of cPEPCK in rat H4IIE cells assessed as effect on glucose production
- ChEMBL_456667 (CHEMBL924048) Inhibition of [3H]glucose uptake at mammalian GLUT1 expressed in Xenopus laevis oocytes
- ChEMBL_744250 (CHEMBL1772057) Inhibition of rat small intestinal maltase after 30 mins by glucose-oxidase method
- ChEMBL_744251 (CHEMBL1772058) Inhibition of rat small intestinal sucrase after 30 mins by glucose-oxidase method
- ChEMBL_744252 (CHEMBL1772059) Inhibition of rat small intestinal isomaltase after 30 mins by glucose-oxidase method
- ChEMBL_857274 (CHEMBL2160769) Inhibition of rat small intestinal isomaltase after 30 mins by glucose-oxidase method
- ChEMBL_857275 (CHEMBL2160770) Inhibition of rat small intestinal sucrase after 30 mins by glucose-oxidase method
- ChEMBL_857276 (CHEMBL2160771) Inhibition of rat small intestinal maltase after 30 mins by glucose-oxidase method
- ChEMBL_1767894 (CHEMBL4220006) Agonist activity at B6D2F1 mouse insulin receptor assessed as increase in glucose incorporation into lipid phase after 2 hrs in presence of D-[3-3H]glucose by TopCount microplate scintillation counting method
- ChEMBL_1279808 (CHEMBL3095509) Activation of glucokinase in rat INS-1 cells assessed as glucose-stimulated insulin secretion
- ChEMBL_1554435 (CHEMBL3767566) Competitive inhibition of rabbit muscle glycogen phosphorylase b in presence of glucose 1-phosphate
- ChEMBL_456666 (CHEMBL924047) Inhibition of [3H]glucose uptake at Plasmodium falciparum HT expressed in Xenopus laevis oocytes
- ChEMBL_542431 (CHEMBL1011499) Inhibition of human G6PDH using glucose-6-phosphate as substrate by Lineweaver-Burke plot
- ChEMBL_626547 (CHEMBL1108920) Inhibition of human SGLT2 expressed in CHOK1 cells assessed as inhibition of glucose uptake
- ChEMBL_626548 (CHEMBL1108921) Inhibition of human SGLT1 expressed in CHOK1 cells assessed as inhibition of glucose uptake
- ChEMBL_775861 (CHEMBL1912402) Inhibition of GCS assessed as amount of UDP-glucose consumed during enzyme-catalyzed reaction
- ChEMBL_862643 (CHEMBL2174116) Inhibition of human glucose-6-phosphate dehydrogenase after 90 mins by resazurin/diaphorasecoupled assay
- ChEMBL_862644 (CHEMBL2174117) Inhibition of Plasmodium falciparum glucose-6-phosphate dehydrogenase after 45 mins by orthogonal assay
- ChEMBL_1619019 (CHEMBL3861188) Inhibition of human recombinant liver glycogen phosphorylase A expressed in baculovirus infected Sf9 insect cells assessed as release of phosphate from glucose-1- phosphate in presence of 7.5 mM glucose by malachite green based assay
- ChEMBL_1619017 (CHEMBL3861186) Inhibition of rabbit muscle glycogen phosphorylase b using alpha-D-glucose-1-phosphate as substrate
- ChEMBL_206287 (CHEMBL808824) Inhibition of Sucrase in rat intestinal brush border membranes by D-glucose oxidase-peroxidase method
- ChEMBL_306715 (CHEMBL832300) Inhibitory concentration against human glutathione reductase in the absence of glucose-6-phosphate dehydrogenase (G6PDH)
- ChEMBL_479543 (CHEMBL931539) Agonist activity at glucocorticoid receptor assessed as glucose response element transcriptional transactivation by luciferase assay
- ChEMBL_498540 (CHEMBL973516) Inhibition of GluT1-mediated [14C]D-glucose uptake in Wistar rat brain by perfusion technique
- ChEMBL_527710 (CHEMBL975068) Inhibition of topoisomerase 1 in Saccharomyces cerevisiae RS321N in glucose medium by microtiter plate assay
- ChEMBL_542429 (CHEMBL1010666) Inhibition of Trypanosoma brucei G6PDH using glucose-6-phosphate as substrate by Lineweaver-Burke plot
- ChEMBL_556521 (CHEMBL956516) Inhibition of rabbit muscle glycogen phosphorylase assessed as release of phosphate from glucose 1 phosphate
- ChEMBL_800636 (CHEMBL1947668) Activation of SUR1 in rat pancreatic islets assessed as inhibition of glucose-induced insulin secretion
- ChEMBL_859947 (CHEMBL2167350) Inhibition of GCS assessed as amount of UDP glucose after 3 hrs by Fluorometry analysis
- ChEMBL_862647 (CHEMBL2174120) Inhibition of Plasmodium falciparum glucose-6-phosphate dehydrogenase after 2 hrs by resazurin/diaphorasecoupled assay
- ChEMBL_959585 (CHEMBL2382530) Agonist activity at GPR40 in rat INS-1 cells assessed as glucose-stimulated insulin secretion
- ChEMBL_2027541 (CHEMBL4681699) Inhibition of active recombinant human N-terminal His-tagged 11-betaHSD1 expressed in Escherichia coli using cortisone, NADPH and glucose-6-phosphate incubated for 2 hrs by glucose-6-phosphate dehydrogenase based coupled HTRF immuno-competitive assay
- Metabolic Measurements Glucose in tail blood was measured using a glucometer (One-Touch Basic; Lifescan, CA). For glucose tolerance tests (GTTs), mice were fasted for 10 hours and then injected with 20% D-glucose (2 mg/g body weight) and the blood glucose was monitored immediately before and at 15, 30, 60 and 120 mins following the injection. For insulin tolerance tests (ITTs), 4-h fasted animals were given insulin (0.75 mU/g) and blood glucose was measured immediately before and at 30, 60 and 120 minutes postinjection. Serum insulin, cholesterol, triglycerides (Stanbio Labs, TX), BDNF (Abnova), IGF1 and IGFBPs (R&D Systems) were determined by enzyme-linked immunosorbent assay.
- ChEBML_71686 Compound was evaluated for inhibition of Glucose-6-Phosphatase from Triton X-100 disrupted pig liver microsomes.
- ChEMBL_101863 (CHEMBL710106) Inhibition of Glycosidases (maltase) in rat intestinal brush border membranes by D-glucose oxidase-peroxidase method
- ChEMBL_1495696 (CHEMBL3578684) Activation of recombinant human pancreatic glucokinase using 10 mM glucose as substrate by G6PDH coupled assay
- ChEMBL_1546979 (CHEMBL3748082) Binding affinity to Salmonella typhi glucose-1-phosphate cytidylyl-transferase assessed as dissociation constant by spectrophotometry
- ChEMBL_208284 (CHEMBL813582) Inhibition of Glycosidases (trehalase)in rat intestinal brush border membranes by D-glucose oxidase-peroxidase method
- ChEMBL_515050 (CHEMBL1034792) Inhibition of human liver glycogen phosphorylase A by fluorescence intensity endpoint assay in presence of glucose
- ChEMBL_515051 (CHEMBL1034793) Inhibition of human liver glycogen phosphorylase A by fluorescence intensity endpoint assay in absence of glucose
- ChEMBL_599699 (CHEMBL1045565) Inhibition of GLUT2-mediated [14C]D-glucose uptake in human MCF7 cells by liquid scintillation counting
- ChEMBL_748047 (CHEMBL1781588) Activation of His-tagged recombinant glucokinase expressed in Escherichia coli using [14C]-glucose substrate by spectrophotometrically
- ChEMBL_759809 (CHEMBL1809870) Antiglycation activity in bovine serum albumin assessed as inhibition of fructosamines formation in presence of glucose
- ChEMBL_858381 (CHEMBL2168596) Activation of glucokinase in rat INS-1 cells assessed as stimulation of glucose-induced insulin secretion
- ChEMBL_88829 (CHEMBL698884) Inhibition of Glycosidases (isomaltase)in rat intestinal brush border membranes by D-glucose oxidase-peroxidase method
- ChEMBL_96426 (CHEMBL706374) Inhibition of Glycosidases (lactase)in rat intestinal brush border membranes by D-glucose oxidase-peroxidase method
- ChEMBL_984799 (CHEMBL2432301) Allosteric activation of human glucokinase using glucose as substrate measured every 10 secs for 5 mins
- ChEMBL_1279734 (CHEMBL3095124) Inhibition of GLUT1 in human H1299 cells assessed as inhibition of 2-deoxy-D-[3H]-glucose uptake incubated for 15 mins prior to 2-deoxy-D-[3H]-glucose addition measured after 30 mins by liquid scintillation counting analysis
- ChEMBL_1828995 (CHEMBL4328869) Inhibition of C-terminal 6-His tagged recombinant Clostridium difficile toxin B glucosyltransferase domain assessed as reduction in UDP-glucose hydrolysis activity using UDP-glucose substrate and ADP Alexa633 tracer incubated for 3 hrs by fluorescence polarization assay
- ChEMBL_101864 (CHEMBL710107) Inhibition of Glycosidases (maltase) in rat intestinal brush border membranes by D-glucose oxidase-peroxidase method maltase
- ChEMBL_1554222 (CHEMBL3766261) Inhibition of rat intestinal sucrase using sucrose as substrate incubated for 30 mins by glucose-oxidase method
- ChEMBL_31929 (CHEMBL642972) Compound was tested for the inhibition of the rat lens aldose reductase using the substrate as glucose.
- ChEMBL_477692 (CHEMBL931372) Inhibition of Trypanosoma cruzi hexokinase in presence of ATP, 2 mM D-glucose and 3 mM MgCl2
- ChEMBL_477693 (CHEMBL931373) Inhibition of Trypanosoma cruzi hexokinase in presence of D-glucose, 1 mM ATP and 3 mM MgCl2
- ChEMBL_664635 (CHEMBL1260349) Inhibition of human recombinant N-terminal domain of maltase-glucoamylase after 60 mins by glucose oxidase assay
- ChEMBL_684093 (CHEMBL1286470) Inhibition of human recombinant N-terminal subunit of maltase-glucoamylase after 60 mins by glucose oxidase assay
- ChEMBL_71572 (CHEMBL684233) Binding activity against Glucose transporter in human erythrocyte membrane using [125I]7-IHPP-Fsk as the radioligand.
- ChEMBL_885380 (CHEMBL2215682) Activation of recombinant rat glucokinase assessed measuring rate of glucose 6-phosphate formation using G6PDH/NADP coupling
- ChEMBL_885387 (CHEMBL2216128) Activation of recombinant human glucokinase assessed measuring rate of glucose 6-phosphate formation using G6PDH/NADP coupling
- ChEMBL_1717901 (CHEMBL4132901) Antagonist activity at human GLUT1 expressed in HEK293 cells transfected with GLUT1 shRNA assessed as inhibition of [3H]2-deoxy-D-glucose uptake preincubated for 5 mins followed by [3H]2-deoxy-D-glucose addition and measured after 6 mins
- ChEMBL_1717902 (CHEMBL4132902) Antagonist activity at human GLUT3 expressed in HEK293 cells transfected with GLUT1 shRNA assessed as inhibition of [3H]2-deoxy-D-glucose uptake preincubated for 5 mins followed by [3H]2-deoxy-D-glucose addition and measured after 6 mins
- ChEMBL_1717903 (CHEMBL4132903) Antagonist activity at human GLUT4 expressed in HEK293 cells transfected with GLUT1 shRNA assessed as inhibition of [3H]2-deoxy-D-glucose uptake preincubated for 5 mins followed by [3H]2-deoxy-D-glucose addition and measured after 6 mins
- ChEMBL_1717904 (CHEMBL4132904) Antagonist activity at human GLUT8 expressed in HEK293 cells transfected with GLUT1 shRNA assessed as inhibition of [3H]2-deoxy-D-glucose uptake preincubated for 5 mins followed by [3H]2-deoxy-D-glucose addition and measured after 6 mins
- ChEMBL_1453753 (CHEMBL3364468) Inhibition of Wistar rat intestinal maltase assessed as inhibition of D-glucose release after 30 mins by spectrophotometry
- ChEMBL_1454615 (CHEMBL3366727) Inhibition of Wistar rat intestinal isomaltase assessed as inhibition of D-glucose release after 30 mins by spectrophotometry
- ChEMBL_1454616 (CHEMBL3366728) Inhibition of Wistar rat intestinal sucrase assessed as inhibition of D-glucose release after 30 mins by spectrophotometry
- ChEMBL_1583831 (CHEMBL3815263) Inhibition of rat small intestinal sucrase using sucrose as substrate incubated for 30 mins by glucose-oxidase method
- ChEMBL_1583832 (CHEMBL3815264) Inhibition of rat small intestinal isomaltase using isomaltose as substrate incubated for 30 mins by glucose-oxidase method
- ChEMBL_1630545 (CHEMBL3873251) Competitive inhibition of rabbit muscle glycogen phosphorylase-b in presence of varying glucose-1-phosphate levels and NADP
- ChEMBL_208279 (CHEMBL813414) Inhibitory activity measured against trehalase of porcine kidney by colorimetric assay using the D-glucose oxidase-peroxidase method
- ChEMBL_216816 (CHEMBL816395) Inhibitory activity measured against alpha-glucosidase of rice by colorimetric assay using the D-glucose oxidase-peroxidase method
- ChEMBL_2222060 (CHEMBL5135394) Inhibition of rat intestinal maltase assessed as release of D-glucose using maltose as substrate by colorimetric analysis
- ChEMBL_34390 (CHEMBL649260) Inhibitory activity measured against alpha-glucosidase of rice by colorimetric assay using the D-glucose oxidase-peroxidase method
- ChEMBL_477720 (CHEMBL931369) Inhibition of glycosomal Trypanosoma cruzi hexokinase in presence of ATP, 2 mM D-glucose and 3 mM MgCl2
- ChEMBL_477721 (CHEMBL927019) Inhibition of glycosomal Trypanosoma cruzi hexokinase in presence of D-glucose, 1 mM ATP and 3 mM MgCl2
- ChEMBL_599700 (CHEMBL1045566) Inhibition of GLUT2-mediated [14C]D-glucose uptake in human MDA-MB-231 cells by liquid scintillation counting
- ChEMBL_620083 (CHEMBL1108551) Inhibition of rabbit muscle glycogen phosphorylase assessed as release of phosphate from glucose-1-phosphate after 25 mins
- ChEMBL_639182 (CHEMBL1168035) Inhibition of rice alpha-glucosidase assessed as D-glucose release at pH 5 after 10 to 30 mins
- In Vitro Inhibition Assay In vitro inhibition assay using human nampt, NMN adenylytransferase (nmant1)and UDP-glucose dehdryogenase (ugdh) genes.
- ChEMBL_1670145 (CHEMBL4020033) Competitive inhibition of human liver glycogen phosphorylase-a assessed as release of inorganic phosphate using varying levels of glucose-1-phosphate and constant concentration of AMP and glycogen preincubated for 15 mins with AMP and glycogen followed by glucose-1-phosphate addition
- ChEMBL_1670148 (CHEMBL4020036) Competitive inhibition of rabbit muscle glycogen phosphorylase-b in presence of varying levels of glucose-1-phosphate and constant concentration of glycogen and AMP preincubated for 15 mins with AMP and glycogen followed by glucose-1-phosphate addition by Lineweaver-Burk plot method
- ChEMBL_1670149 (CHEMBL4020037) Competitive inhibition of rabbit muscle glycogen phosphorylase-a in presence of varying levels of glucose-1-phosphate and constant concentration of glycogen and AMP preincubated for 15 mins with AMP and glycogen followed by glucose-1-phosphate addition by Lineweaver-Burk plot method
- ChEMBL_1752667 (CHEMBL4187427) Inhibition of C-terminal 6-His tagged recombinant Clostridium difficile toxin B catalytic fragment (Met1 to Leu543 residues) assessed as reduction in glucosyltransferase domain UDP-glucose hydrolysis activity using UDP-glucose and ADP Alexa633 tracer incubated fore 3 hrs by fluorescence polarization assay
- ChEMBL_1554437 (CHEMBL3767568) Competitive inhibition of rabbit muscle glycogen phosphorylase b by Lineweaver-Burk plot analysis in presence of glucose 1-phosphate
- ChEMBL_1558648 (CHEMBL3771525) Inhibition of rabbit muscle glycogen phosphorylase-a assessed as formation of inorganic phosphate from glucose-1-phosphate by colorimetry
- ChEMBL_1583833 (CHEMBL3815265) Inhibition of human small intestine microsomal maltase using maltose as substrate incubated for 30 mins by glucose-oxidase method
- ChEMBL_2270628 Inhibition of PFKFB3 in human HCT-116 cells assessed as inhibition of glucose induced lactate production by absorbance based analysis
- ChEMBL_2476702 Inhibition of rat intestinal alpha-glucosidase using p-nitrophenyl glycoside as substrate assessed as D-glucose release by colorimetric analysis
- ChEMBL_479545 (CHEMBL931541) Antagonist activity at glucocorticoid receptor assessed as inhibition of dexamethasone-induced glucose response element transcriptional transactivation by luciferase assay
- ChEMBL_499902 (CHEMBL978960) Inhibition of 1,3-beta-D-glucan synthase EMFR-S678P mutant from Aspergillus fumigatus assessed as incorporation of [3H]glucose
- ChEMBL_595113 (CHEMBL1050600) Inhibition of rabbit muscle glycogen phosphorylase A assessed as release of phosphate from glucose-1-phosphate after 25 mins
- ChEMBL_70513 (CHEMBL679754) Inhibitory activity measured against alpha-galactosidase of coffee bean by colorimetric assay using the D-glucose oxidase-peroxidase method
- ChEMBL_762684 (CHEMBL1817502) Inhibition of rabbit muscle glycogen phosphorylase 1a assessed as release of phosphate from glucose-1- phosphate after 20 mins
- ChEMBL_762685 (CHEMBL1817503) Inhibition of human liver glycogen phosphorylase 1a assessed as release of phosphate from glucose-1- phosphate after 20 mins
- ChEMBL_1445934 (CHEMBL3377918) Activation of human recombinant Glucokinase measured over 5 mins by G6-PD coupled assay in presence of 5 mM glucose
- ChEMBL_1455264 (CHEMBL3362270) Agonist activity at mouse FFA4 receptor in mouse MIN6 cells assessed as induction of glucose-induced insulin secretion by AlphaLISA
- ChEMBL_1541190 (CHEMBL3745192) Displacement of UDP-[3H]glucose from beta-1,3-glucan synthase in Candida albicans MY1055 microsomal membranes incubated for 2 hrs
- ChEMBL_1557478 (CHEMBL3771809) Competitive inhibition of rabbit muscle glycogen phosphorylase-b using alpha-D-glucose-1-phosphate as substrate by Dixon plot analysis
- ChEMBL_1623252 (CHEMBL3865604) Agonist activity at GPR40 in rat RINm cells assessed as increase glucose-stimulated insulin secretion after 1 hr by ELISA
- ChEMBL_1821937 (CHEMBL4321597) Inhibition of HK2 (unknown origin) using glucose-6-phosphate dehydrogenase as substrate preincubated for 10 mins followed by substrate addition
- ChEMBL_2164214 (CHEMBL5049075) Inhibition of human GCS using C8-ceramide and UDP-glucose as substrate incubated for 1 hr by RapidFire mass spectrometry
- ChEMBL_2164220 (CHEMBL5049081) Inhibition of mouse GCS using C8-ceramide and UDP-glucose as substrate incubated for 1 hr by RapidFire mass spectrometry
- ChEMBL_2226820 (CHEMBL5140333) Inhibition of rat small intestinal maltase assessed as reduction of D-glucose release using maltose as substrate by colorimetric analysis
- ChEMBL_2335138 Inhibition of GLUT1 in human MCF7 cells assessed as ATP production incubated for 24 hrs in presence of 0.1 mM glucose
- ChEMBL_2335139 Inhibition of GLUT1 in human MCF7 cells assessed as ATP production incubated for 24 hrs in presence of 10 mM glucose
- ChEMBL_308699 (CHEMBL834934) In vitro inhibition of Na-dependent [14C]AMG uptake in CHO-K1 cells expressing human sodium glucose co-transporter 1
- ChEMBL_308700 (CHEMBL834935) In vitro inhibition of Na-dependent [14C]AMG uptake in CHO-K1 cells expressing human sodium glucose co-transporter 2
- ChEMBL_31457 (CHEMBL643939) Inhibition of aldose reductase activity was measured on partially purified bovine lens preparations incubated in presence of 50 mM glucose.
- ChEMBL_33948 (CHEMBL884024) Inhibitory activity measured against alpha-L-fucosidase of bovine epididymis by colorimetric assay using the D-glucose oxidase-peroxidase method
- ChEMBL_33966 (CHEMBL649591) Inhibitory activity measured against alpha-L-fucosidase of bovine epididymis by colorimetric assay using the D-glucose oxidase-peroxidase method
- ChEMBL_34094 (CHEMBL649723) Inhibitory activity measured against alpha-L-fucosidase of rat epididymis by colorimetric assay using the D-glucose oxidase-peroxidase method
- ChEMBL_34419 (CHEMBL649423) Inhibitory activity measured against alpha-glucosidase of rat intestinal isomaltase by colorimetric assay using the D-glucose oxidase-peroxidase method
- ChEMBL_34420 (CHEMBL649424) Inhibitory activity measured against alpha-glucosidase of rat intestinal maltase by colorimetric assay using the D-glucose oxidase-peroxidase method
- ChEMBL_34421 (CHEMBL649425) Inhibitory activity measured against alpha-glucosidase of rat intestinal sucrase by colorimetric assay using the D-glucose oxidase-peroxidase method
- ChEMBL_34526 (CHEMBL648167) Inhibitory activity measured against alpha-glucosidase of rat liver lysosomal by colorimetric assay using the D-glucose oxidase-peroxidase method
- ChEMBL_584072 (CHEMBL1058313) Activation of flag-tagged recombinant human liver glucokinase expressed in Escherichia coli assessed as glucose-6-phosphate dehydrogenase by spectrophotometry
- ChEMBL_659928 (CHEMBL1247186) Inhibition of GLUT1-mediated [3H]2-deoxy-glucose uptake in rat L6 cells after 15 mins by liquid scintillation counting
- ChEMBL_830545 (CHEMBL2061357) Inhibition of rat intestinal maltase using maltose as substrate preincubated for 10 mins before substrate addition by glucose oxidase method
- ChEMBL_959319 (CHEMBL2384006) Activation of human recombinant muscle GYS1 expressed in insect sf9 cells using glycogen and UDP-glucose as substrates by spectrophotometry
- ChEMBL_99040 (CHEMBL712593) In vitro inhibitory activity against recombinant human liver glycogen phosphorylase a (rHLGPa) catalyzed release of phosphate from glucose-1-phosphate.
- ChEMBL_2521267 Inhibition of human GLUT4 expressed in CHO cells assessed as reduction in glucose uptake by measuring decrease in ATP production preincubated for 20 mins followed by glucose addition and measured after 15 mins in presence of oxidative phosphorylation inhibitor rotenone by CellTiter-Glo Luminescent Cell Viability Assay
- ChEMBL_1297731 (CHEMBL3131191) Inhibition of human recombinant FBPase expressed in Escherichia coli BL21(DE3) by phosphoglucose isomerase and glucose-6-phosphate dehydrogenase coupled assay
- ChEMBL_1856573 (CHEMBL4357302) Inhibition of Listeria monocytogenes NAD kinase assessed as suppression of reduced NADP formation by yeast glucose-6-phosphate dehydrogenase coupled assay
- ChEMBL_1883833 (CHEMBL4385332) Agonist activity at GPR40 in human islets assessed as induction of glucose-stimulated insulin secretion after 1 hr by HTRF assay
- ChEMBL_2107526 (CHEMBL4816201) Competitive inhibition of G6PD (unknown origin) using glucose-6-phosphate and varying concentrations of NADP+ as substrate by Michaelis-Menten analysis
- ChEMBL_2238979 (CHEMBL5152875) Inhibition of human GCS using C8-ceramide and UDP-glucose as substrate incubated for 1 hrs by Rapidfire mass spectrometric analysis
- ChEMBL_2238985 (CHEMBL5152881) Inhibition of mouse GCS using C8-ceramide and UDP-glucose as substrate incubated for 1 hrs by Rapidfire mass spectrometric analysis
- ChEMBL_31922 (CHEMBL642965) Inhibitory activity was measured against rat lens aldose reductase in the presence of 1 uM compound with D-glucose as substrates
- ChEMBL_32097 (CHEMBL884015) Inhibitory activity was measured against rat lens aldose reductase in the presence of 1 uM compound with D-glucose as substrates
- ChEMBL_477694 (CHEMBL931371) Inhibition of Trypanosoma cruzi hexokinase in presence of ATP, 2 mM D-glucose and 3 mM MgCl2 by competitive inhibition assay
- ChEMBL_477695 (CHEMBL931370) Inhibition of Trypanosoma cruzi hexokinase in presence of D-glucose, 1 mM ATP and 3 mM MgCl2 by competitive inhibition assay
- ChEMBL_835198 (CHEMBL2072457) Inhibition of glucose-6-phosphatase enzymatic activity in rat H42E cells using G6P substrate incubated for 18 hrs by colorimetric assay
- ChEBML_1645791 Agonist activity at GLP1R in rat INS-1 cells assessed as increase in glucose-stimulated insulin secretion after 1 hr by HTRF assay
- ChEMBL_1519500 (CHEMBL3625686) Competitive inhibition of rat intestinal Maltase using maltose as substrate assessed as glucose release after 10 mins by Lineweaver-Burk plot analysis
- ChEMBL_1519502 (CHEMBL3625688) Competitive inhibition of rat intestinal Sucrase using sucrose as substrate assessed as glucose release after 40 mins by Lineweaver-Burk plot analysis
- ChEMBL_1832268 (CHEMBL4332276) Inhibition of recombinant human N-terminal GST-fused glucokinase expressed in Escherichia coli using glucose-6-phosphatedehydrogenase as substrate by spectrophotometric assay
- ChEMBL_2069557 (CHEMBL4724810) Agonist activity at GPR119 in glucose-induced mouse L cells assessed as induction of GLP-1 secretion after 2 hrs by ELISA
- ChEMBL_2107522 (CHEMBL4816197) Non-competitive inhibition of G6PD (unknown origin) using glucose-6-phosphate and varying concentrations of NADP+ as substrate by Michaelis-Menten analysis
- ChEMBL_2290740 Inhibition of sucrase in rat small intestinal brush border membrane vesicles using sucrose as substrate incubated for 30 mins by glucose-oxidase method
- ChEMBL_2290741 Inhibition of maltase in rat small intestinal brush border membrane vesicles using maltose as substrate incubated for 30 mins by glucose-oxidase method
- ChEMBL_34525 (CHEMBL648166) Inhibitory activity measured against alpha-glucosidase of rat liver ER glucosidase II by colorimetric assay using the D-glucose oxidase-peroxidase method
- ChEMBL_477722 (CHEMBL927020) Inhibition of glycosomal Trypanosoma cruzi hexokinase in presence of ATP, 2 mM D-glucose and 3 mM MgCl2 by competitive inhibition assay
- ChEMBL_477723 (CHEMBL927021) Inhibition of glycosomal Trypanosoma cruzi hexokinase in presence of D-glucose, 1 mM ATP and 3 mM MgCl2 by competitive inhibition assay
- ChEMBL_639399 (CHEMBL1167931) Induction of glucokinase-mediated 2-deoxy-D-[3H]glucose uptake in Sprague-Dawley rat hepatocytes after 4 hrs by liquid scintillation countingl
- ChEMBL_815664 (CHEMBL2025594) Activation of human recombinant glucokinase expressed in Escherichia coli BL21(DE3) coexpressing G6PDH assessed as glucose 6-phosphate formation by spectrometric analysis
- Biological Assays The SGLT2 functional assay was designed to detect the inhibition of methyl-alpha-D glucopyranoside (AMG a non-metabolizable form of glucose) uptake via the SGLT2 transporter. The SGLT2 transporter recovers glucose from the proximal tubules of the kidney; its inhibition results in sugar wasted in the urine. The positive control compound, Phlorizin, is a known inhibitor of glucose uptake for SGLT2 and was used for comparing the high percent effect of SGLT2 inhibition of the test compounds.
- ChEMBL_1445951 (CHEMBL3377935) Activation of human recombinant Glucokinase measured over 5 mins by G6-PD coupled assay in presence of 5 mM glucose and 4% HSA
- ChEMBL_1460187 (CHEMBL3369412) Inhibition of rabbit muscle glycogen phosphorylase a assessed as inhibition of release of phosphate from glucose-1-phosphate after 30 mins by spectrophotometry
- ChEMBL_1519501 (CHEMBL3625687) Non-competitive inhibition of rat intestinal Maltase using maltose as substrate assessed as glucose release after 10 mins by Lineweaver-Burk plot analysis
- ChEMBL_1519503 (CHEMBL3625689) Non-competitive inhibition of rat intestinal Sucrase using sucrose as substrate assessed as glucose release after 40 mins by Lineweaver-Burk plot analysis
- ChEMBL_1630551 (CHEMBL3873257) Inhibition of rabbit muscle glycogen phosphorylase-b assessed as release of inorganic phosphate from glucose-1-phosphate in presence of AMP and glycogen
- ChEMBL_1645791 (CHEMBL3994847) Agonist activity at GLP1R in rat INS-1 cells assessed as increase in glucose-stimulated insulin secretion after 1 hr by HTRF assay
- ChEMBL_1670144 (CHEMBL4020032) Competitive inhibition of rabbit muscle glycogen phosphorylase b using glucose-1-phosphate as substrate in presence of constant concentrations of glycogen and AMP
- ChEMBL_1757473 (CHEMBL4192481) Antiglycation activity in bovine serum albumin assessed as inhibition of advanced glycated end product formation in presence of D-glucose by spectrofluorimetric analysis
- ChEMBL_1758339 (CHEMBL4193347) Activation of recombinant human liver glucokinase 2 assessed as reduction in NADH production in presence of 5 mM glucose by G6PDH coupled assay
- ChEMBL_2025601 (CHEMBL4679414) Inhibition of human intestinal maltase using maltose as substrate incubated for 30 mins and immediately heated for 2 mins by glucose oxidase method
- ChEMBL_2069558 (CHEMBL4724811) Agonist activity at GPR119 in glucose-induced golden hamster HIT-T15 cells assessed as increase in insulin secretion after 2 hrs by A1phaLISA
- ChEMBL_2348349 Inhibition of GCS in human A-375 cell golgi body preparations using ceramide and UDP-glucose as substrate by UDP-Glo based luminometric analysis
- ChEMBL_797827 (CHEMBL1942413) Inhibition of rabbit muscle glycogen phosphorylase a assessed as release of phosphate from glucose-1-phosphate after 25 mins using malachite green staining
- ChEMBL_798628 (CHEMBL1942617) Inhibition of GSK3-beta in human HepG2 cells assessed as incorporation of [3H]glucose into glycogen after 3 hrs by liquid scintillation counting
- ChEMBL_1619018 (CHEMBL3861187) Inhibition of rabbit skeletal muscle glycogen phosphorylase b assessed as inorganic phosphate release using glucose-1-phosphate as substrate by double-reciprocal plot analysis
- ChEMBL_1619029 (CHEMBL3861198) Inhibition of rabbit skeletal muscle glycogen phosphorylase b assessed as reduction in inorganic phosphate release using glucose-1-phosphate as substrate at pH 6.8
- ChEMBL_2104460 (CHEMBL4812963) Agonist activity at rat GPR119 in golden hamster HIT-T15 cells assessed as induction of glucose-induced insulin secretion after 2 hrs by A1phaLISA
- ChEMBL_2164064 (CHEMBL5048925) Displacement of fluorescent labeled derivative from recombinant human hepatic glucokinase incubated for 30 mins in presence of 12 mM glucose by fluorescent polarization assay
- ChEMBL_745158 (CHEMBL1772337) Antagonist activity at mouse P2Y14 expressed in human HEK cells coexpressing Galphai5 assessed as inhibition of UDP-glucose stimulated calcium release by FLIPR assay
- ChEMBL_753234 (CHEMBL1799389) Inhibition of rabbit muscle glycogen phosphorylase A assessed as release of phosphate from glucose-1-phosphate after 25 mins by microplate reader based method
- ChEMBL_934194 (CHEMBL2319454) Inhibition of glycation of bovine serum albumin assessed as advanced glycated end product measured after 7 days by spectrofluorimeter in presence of glucose anhydrous
- ChEMBL_976220 (CHEMBL2415869) Inhibition of rat intestinal sucrase using sucrose as substrate assessed as D-glucose release from substrate preincubated for 15 mins measured after 60 mins
- ChEMBL_976221 (CHEMBL2415870) Inhibition of rat intestinal maltase using maltose as substrate assessed as D-glucose release from substrate preincubated for 15 mins measured after 60 mins
- Inhibition Activity Assay Human liver glycogen phsphorylase (HLGP) activity was measured in the direction of glycogen synthesis by the release of phosphate from glucose-1-phosphate.
- ChEMBL_1670147 (CHEMBL4020035) Competitive inhibition of 6xHis-tagged human liver glycogen phosphorylase-a expressed in Escherichia coli BL21 Gold (DE3) assessed as release of inorganic phosphate using varying levels of glucose-1-phosphate and constant concentration of AMP and glycogen preincubated for 15 mins with AMP and glycogen followed by glucose-1-phosphate addition by Lineweaver-Burk plot method
- ChEMBL_538724 (CHEMBL1035035) Activation of insulin receptor tyrosine kinase in mouse 3T3-L1 cells assessed as increase in 2-deoxy-D-[14C]glucose transport in presence of insulin
- ChEMBL_960446 (CHEMBL2389097) Inhibition of wild type Candida albicans 1,3-beta-D-glucan synthase using UDP[6,3H]-glucose as substrate after 60 mins by liquid scintillation counting analysis
- ChEMBL_972473 (CHEMBL2412843) Binding affinity to recombinant wild-type human pancreatic glucokinase expressed in Escherichia coli K-12 by isothermal titration calorimetry in presence of 200 mM glucose
- Dose Response confirmation of inhibitors of hexokinase domain containing I (HKDC1) Data Source: Sanford-Burnham Center for Chemical Genomics (SBCCG) Source Affiliation: Sanford-Burnham Medical Research Institute (SBMRI, San Diego, CA) Network: NIH Molecular Libraries Probe Production Centers Network (MLPCN) Grant Proposal Number: R21 NS061703-01S1 Assay Provider: Dr. Jeff Johnson, Metabolex, Inc., Hayward, CA. The gene HKDC1 (HexoKinase Domain Containing I) was found to encode a fifth mammalian hexokinase. Since hexokinases are the first step in glucose metabolism, they play a major role in regulating the metabolic fate of glucose in the tissues they are expressed. Understanding both the proper and pathological metabolism of glucose is obviously of critical importance to deciphering the dysregulation of glucose metabolism that leads to Type 2 diabetes, a disorder of glucose metabolism that morbidly afflicts 35 million Americans and perhaps close to 200 million worldwide. It is our expectation that HTS to find small molecule inhibitors for HKDC1 will begin the proce
- ChEMBL_1630547 (CHEMBL3873253) Competitive inhibition of rabbit muscle glycogen phosphorylase-a in presence of varying levels of glucose-1-phosphate and constant concentration of glycogen by Hill plot analysis
- ChEMBL_1733215 (CHEMBL4148751) Inhibition of rabbit muscle glycogen phosphorylase-a assessed as release of inorganic phosphate using glucose-1-phosphate as substrate in presence of glycogen by spectrophotometric method
- ChEMBL_1733216 (CHEMBL4148752) Inhibition of human liver glycogen phosphorylase-a assessed as release of inorganic phosphate using glucose-1-phosphate as substrate in presence of glycogen by spectrophotometric method
- ChEMBL_1856378 (CHEMBL4357107) Inhibition of human GLUT1 expressed in DLD1 cells assessed as glucose uptake by measuring ATP incubated for 15 mins by CellTiter-Glo Luminescent Cell Viability Assay
- ChEMBL_2163994 (CHEMBL5048855) Activation of recombinant human full length liver glucokinase expressed in Escherichia coli incubated for 10 mins in presence of 5 mM glucose by plate reader analysis
- ChEMBL_2164066 (CHEMBL5048927) Activation of recombinant human full length liver glucokinase expressed in Escherichia coli incubated for 10 mins in presence of 2 mM glucose by plate reader analysis
- ChEMBL_2164068 (CHEMBL5048929) Activation of recombinant mouse full length liver glucokinase expressed in Escherichia coli incubated for 10 mins in presence of 12 mM glucose by plate reader analysis
- ChEMBL_218251 (CHEMBL819219) In vitro beta-adrenergic activity against beta-1 adrenergic receptor by the inhibition of insulin stimulated [14C]- glucose incorporation into glycogen in isolated rat soleus muscle
- ChEMBL_749005 (CHEMBL1781790) Inhibition of human SGLT2 expressed in CHO cells assessed as inhibition of [14C]-Glucose uptake using [14C]-methyl glucopyranoside after 60 mins by microbeta plate counting
- ChEMBL_764140 (CHEMBL1821351) Competitive inhibition of rabbit muscle glycogen phosphorylase b assessed as inorganic phosphate release using alphaD glucose-1-phosphate as substrate at pH 6.8 by spectrophotometric analysis
- ChEMBL_960449 (CHEMBL2389100) Inhibition of wild type Candida albicans MY1055 1,3-beta-D-glucan synthase using UDP[6,3H]-glucose as substrate after 60 mins by liquid scintillation counting analysis
- ChEMBL_979092 (CHEMBL2421548) Inhibition of rat intestine sucrase using sucrose as substrate incubated for 10 mins prior to substrate addition measured after 40 mins by glucose oxidase colorimetric method
- ChEMBL_979094 (CHEMBL2421550) Inhibition of rat intestine maltase using maltose as substrate incubated for 10 mins prior to substrate addition measured after 40 mins by glucose oxidase colorimetric method
- ChEMBL_1632098 (CHEMBL3874804) Inhibition of rat small intestinal brush border membrane isomaltase assessed as reduction in production of D-glucose using disaccharides as substrate incubated for 10 to 30 mins
- ChEMBL_1632099 (CHEMBL3874805) Inhibition of rat small intestinal brush border membrane sucrase assessed as reduction in production of D-glucose using disaccharides as substrate incubated for 10 to 30 mins
- ChEMBL_1713759 (CHEMBL4123808) Antiglycation activity in bovine serum albumin assessed as inhibition of advanced glycated end product formation after 24 hrs in presence of alpha-D-glucose by fluorescence assay
- ChEMBL_1886417 (CHEMBL4388094) Inhibition of ALR2 in rat sciatic nerve assessed as reduction in sorbitol accumulation incubated for 3 hrs in presence of 28 mM glucose by gas chromatographic analysis
- ChEMBL_1902577 (CHEMBL4404799) Inhibition of C-terminal 6His-tagged wild type human GYS1 using UDPG as substrate in presence of 1 mM G-6-P by 14C-glucose incorporation assay
- ChEMBL_2290742 Binding affinity to maltase in rat small intestinal brush border membrane vesicles assessed as inhibition constant using maltose as substrate incubated for 30 mins by glucose-oxidase method
- ChEMBL_2290743 Binding affinity to sucrase in rat small intestinal brush border membrane vesicles assessed as inhibition constant using sucrose as substrate incubated for 30 mins by glucose-oxidase method
- ChEMBL_2300654 Activation of recombinant human glucokinase assessed as increase in maximal activation by measuring accumulation of NADH in presence of S0.5 of glucose and NAD by plate reader analysis
- ChEMBL_2576991 Inhibition of GLUT1 in human HEY cells assessed as decrease in conversion of D-[5-3H(N)]-glucose to 3H2O incubated for 24 hrs by liquid scintillation counting
- ChEMBL_321698 (CHEMBL872321) Logarithmic inhibitory concentration against human liver glycogen phosphorylase enzyme by the addition of glucose-1-phosphate and incubated for 40 min at 25 degree C, pH 7.2
- ChEMBL_631134 (CHEMBL1107398) Antagonist activity at human GPR17 expressed in human 1321N1 cells assessed as inhibition of UDP-glucose-induced [35S]GTPgammaS binding after 30 mins by rapid filtration assay
- ELISA-based Correlate-EIA Direct cAMP Assay INS-1E insulinoma cells were incubated in 2.5 mM glucose Krebs-Ringer buffer (pH 7.5) supplemented with 2 mM sodium bicarbonate, 10 mM HEPES, and 0.1% BSA for 2 h before start of the experiment. At time zero for each experiment, media was switched to Krebs-Ringer buffer containing 2.5 mM glucose or 16 mM glucose in the presence of 500 μM IBMX and inhibitor at the shown concentrations. After 10 min cells were lysed in 200 μl 0.1 M HCl. Intracellular cAMP contents were determined using Correlate-EIA Direct Assay (Assay Designs, Inc).
- Glucokinase Enzyme Assay The GK activity was assessed spectrometrically by a coupled reaction with glucose-6-phosphate dehydrogenase (G6PDH). Briefly, GK catalyzes glucose phosphorylation to generate glucose-6-P, which was oxidized by the G6PDH with the concomitant reduction of NADP. The product NADPH was then monitored by the increase rate of absorbance at 340 nm in a plate reader (SpectraMax 190; Molecular Devices, USA). For EC50 determination, different concentrations of compounds were tested in the assay, and the fold changes in activity versus controls were fitted to sigmoidal curve using a four parameter logistic model in GraphPad Prism 4.
- ChEMBL_1619020 (CHEMBL3861189) Inhibition of rabbit muscle glycogen phosphorylase b using 10 mM of glucose-1-phosphate as substrate preincubated for 60 mins followed by substrate addition in presence of glycogen
- ChEMBL_1733214 (CHEMBL4148750) Inhibition of rabbit muscle glycogen phosphorylase-b assessed as release of inorganic phosphate using glucose-1-phosphate as substrate in presence of AMP and glycogen by spectrophotometric method
- ChEMBL_1902586 (CHEMBL4404808) Competitive inhibition of C-terminal 6His-tagged human GYS1 using UDPG as substrate in presence of G-6-P by 14C-glucose incorporation based Michaelis-Menton plot analysis
- ChEMBL_2576990 Inhibition of GLUT1 in human OVCAR-3 cells assessed as decrease in conversion of D-[5-3H(N)]-glucose to 3H2O incubated for 24 hrs by liquid scintillation counting
- ChEMBL_2576997 Inhibition of GLUT1 in human OVCR-429 cells assessed as decrease in conversion of D-[5-3H(N)]-glucose to 3H2O incubated for 24 hrs by liquid scintillation counting
- ChEMBL_2576998 Inhibition of GLUT1 in human OVCA-432 cells assessed as decrease in conversion of D-[5-3H(N)]-glucose to 3H2O incubated for 24 hrs by liquid scintillation counting
- ChEMBL_972468 (CHEMBL2412838) Binding affinity to recombinant wild-type human pancreatic glucokinase expressed in Escherichia coli K-12 at 11 uM by isothermal titration calorimetry in presence of 200 mM glucose
- ChEMBL_972469 (CHEMBL2412839) Binding affinity to recombinant wild-type human pancreatic glucokinase expressed in Escherichia coli K-12 at 100 uM by isothermal titration calorimetry in presence of 200 mM glucose
- ChEMBL_1291068 (CHEMBL3119630) Induction of GK translocation from nucleus to cytoplasm of mouse hepatocytes preincubated for 20 mins followed by glucose challenge measured after 40 mins by Hoechst 33342 staining-based assay
- ChEMBL_1455573 (CHEMBL3364950) Induction of GK translocation from nucleus to cytoplasm of mouse hepatocytes preincubated for 20 mins followed by glucose challenge measured after 40 mins by Hoechst 33342 staining-based assay
- ChEMBL_1630555 (CHEMBL3873261) Competitive inhibition of rabbit muscle glycogen phosphorylase-b in presence of varying levels of glucose-1-phosphate and constant concentration of glycogen and AMP by double reciprocal plot method
- ChEMBL_1649508 (CHEMBL3998642) Inhibition of rat muscle glycogen phosphorylase A assessed as release of inorganic phosphate from glucose-1- phosphate in presence of glycogen after 30 mins by malachite green based assay
- ChEMBL_1873887 (CHEMBL4375176) Inhibition of PHGDH in human MDA-MB-468 cells assessed as reduction in [13C]-serine incubated for 1 hr using [13C]glucose as substrate by LC-MS/MS analysis
- ChEMBL_1873888 (CHEMBL4375177) Inhibition of PHGDH in human MDA-MB-468 cells assessed as reduction in [13C]-serine incubated for 72 hrs using [13C]glucose as substrate by LC-MS/MS analysis
- ChEMBL_1886412 (CHEMBL4388089) Inhibition of ALR2 in rat erythrocytes assessed as reduction in sorbitol accumulation incubated for 3 hrs in presence of 28 mM glucose by gas chromatographic analysis relative to control
- ChEMBL_1886422 (CHEMBL4388099) Inhibition of ALR2 in rat lens assessed as reduction in sorbitol accumulation incubated for 3 hrs in presence of 28 mM glucose by gas chromatographic analysis relative to control
- ChEMBL_2576989 Inhibition of GLUT1 in human SK-OV-3 cells assessed as decrease in conversion of D-[5-3H(N)]-glucose to 3H2O incubated for 24 hrs by liquid scintillation counting
- ChEMBL_628629 (CHEMBL1106395) Inhibition of pig kidney fructose-1,6-bisphosphatase expressed in Escherichia coli BL21 (DE3) assessed as reduction of NADP+ to NADPH by phosphoglucose isomerase/glucose-6-phosphate dehydrogenase coupled assay
- ChEMBL_628630 (CHEMBL1106396) Inhibition of human liver fructose-1,6-bisphosphatase expressed in Escherichia coli BL21 (DE3) assessed as reduction of NADP+ to NADPH by phosphoglucose isomerase/glucose-6-phosphate dehydrogenase coupled assay
- ChEMBL_1338436 (CHEMBL3240702) Inhibition of GKRP-GK interaction in mouse hepatocytes assessed as induction of GK translocation from nucleus to cytoplasm incubated for 20 mins prior to glucose addition measured after 40 mins
- ChEMBL_1633189 (CHEMBL3875981) Inhibition of human NADK expressed in Escherichia coli BL21(DE3) assessed as reduction in NADP production using NAD as substrate by glucose-6-phosphate dehydrogenase coupled enzyme based spectrophotometric method
- ChEBML_1565336 Inhibition of human GLUT1 expressed in DLD1 cells assessed as ATP production co-incubated with 100 mM glucose for 16 hrs by CellTiter-Glo assay in presence of oxidative phosphorylation inhibitor rotenone
- ChEMBL_1460519 (CHEMBL3395429) Inhibition of human liver FBPase expressed in Escherichia coli BL21(DE3) Rosetta cells assessed as reduction of NADP+ to NADPH by phosphoglucose isomerase and glucose-6-phosphate dehydrogenase coupling based spectrophotometry
- ChEMBL_1557476 (CHEMBL3771807) Competitive inhibition of rabbit muscle glycogen phosphorylase-b using glucose-1-phosphate as substrate preincubated with glycogen for 15 mins followed by substrate addition measured every 1 min for 5 mins
- ChEMBL_1577557 (CHEMBL3807033) Inhibition of His-tagged human HK1 (11 to 917 residues) expressed in Escherichia coli BL21(DE3) using glucose as substrate after 45 mins by ADP-glo assay in presence of MgATP
- ChEMBL_1577558 (CHEMBL3807034) Inhibition of His-tagged human HK2 (17 to 916 residues) expressed in Escherichia coli BL21(DE3) using glucose as substrate after 45 mins by ADP-glo assay in presence of MgATP
- ChEMBL_1630552 (CHEMBL3873258) Inhibition of rabbit muscle glycogen phosphorylase-b after 1 min in presence of varying levels of glucose-1-phosphate and constant concentration of glycogen and AMP by double reciprocal plot method
- ChEMBL_1755230 (CHEMBL4189990) Antagonist activity at P2Y14R in rat C6 cells assessed as suppression of UDP-glucose-mediated inhibition of forskolin-stimulated [3H]cyclic-AMP accumulation after 15 mins in presence of [3H]-adenine
- ChEMBL_1812249 (CHEMBL4311709) Inhibition of human SGLT1 expressed in CHOK1 cells assessed as reduction in sodium-dependent glucose uptake after 30 mins in presence of [14C]-methyl-alpha -D-glucopyranoside by microbeta counting method
- ChEMBL_1812250 (CHEMBL4311710) Inhibition of human SGLT2 expressed in CHOK1 cells assessed as reduction in sodium-dependent glucose uptake after 1 hr in presence of [14C]-methyl-alpha -D-glucopyranoside by microbeta counting method
- ChEMBL_2266215 Inhibition of Glucosylceramide synthase (unknown origin) using C6-ceramide and UDP-glucose as substrate preincubated for 30 mins followed by substrate addition and measured after 2 hrs by UDP-Glo luminometer analysis
- ChEMBL_321596 (CHEMBL883911) Inhibitory concentration against human liver glycogen phosphorylase enzyme by the addition of glucose-1-phosphate upon incubating for 40 min at 25 degree C, pH 7.2 with compound dissolved in DMSO
- ChEMBL_1295136 (CHEMBL3128637) Inhibition of SGLT1 (unknown origin) expressed in HEK293 cells using 2-NBDG as substrate incubated for 30 mins prior to substrate addition measured after 30 mins by nonradioactive fluorescence glucose uptake assay
- ChEMBL_1295137 (CHEMBL3128638) Inhibition of SGLT2 (unknown origin) expressed in HEK293 cells using 2-NBDG as substrate incubated for 30 mins prior to substrate addition measured after 30 mins by nonradioactive fluorescence glucose uptake assay
- ChEMBL_1565336 (CHEMBL3782730) Inhibition of human GLUT1 expressed in DLD1 cells assessed as ATP production co-incubated with 100 mM glucose for 16 hrs by CellTiter-Glo assay in presence of oxidative phosphorylation inhibitor rotenone
- ChEMBL_1577563 (CHEMBL3807039) Competitive inhibition of His-tagged human HK2 (17 to 916 residues) expressed in Escherichia coli BL21(DE3) assessed as formation of G6P by continuous G6P dehydrogenase coupled assay in presence of glucose
- ChEMBL_1633194 (CHEMBL3875986) Inhibition of Staphylococcus aureus COL NADK expressed in Escherichia coli BL21(DE3) assessed as reduction in NADP production using NAD as substrate by glucose-6-phosphate dehydrogenase coupled enzyme based spectrophotometric method
- ChEMBL_1848778 (CHEMBL4349319) Inhibition of recombinant human HK2 expressed in Escherichia coli BL21(DE3) using glucose as substrate preincubated for 10 mins followed by substrate addition in presence of ATP by G6PDH/NADP coupled assay
- Electrophysiology Assay For TRPC6 current recording, the intracellular solution contained (in mM): 120 CsOH, 120 Aspartate, 20 CsCl, 2 MgCl2, 0.4 CaCl2, 10 HEPES, 2 Na2ATP, 0.1 Na3GTP, 10 Glucose, 1 EGTA (pH 7.2-7.25, adjusted with CsOH). The extracellular solution contained (in mM): 145 NaCl, 5 KCl, 1 CaCl2, 1 MgCl2, 10 HEPES, 10 Glucose (pH 7.4 adjusted with NaOH).For TRPC3 current recording, the intracellular solution contained (in mM): 130 CsCl, 5 HEPES, 5 EGTA, 5 Na2ATP, Na3GTP, 5.5 MgCl2 (pH 7.2-7.25, adjusted with CsOH). The extracellular solution contained (in mM): 140 NaCl, 4 KCl, 1 MgCl2, 10 HEPES, 0.2 CaCl2, 10 Glucose, 2 Na4EDTA (pH7.4 adjusted with NaOH).
- ChEMBL_1296098 (CHEMBL3131527) Inhibition of GKRP-GK interaction in rat primary hepatocytes assessed as translocation of GK from nucleus to cytoplasm preincubated for 20 mins followed by glucose addition measured after 40 mins by fluorescence assay
- ChEMBL_1795340 (CHEMBL4267457) Inhibition of recombinant Trypanosoma cruzi trans-sialidase expressed in Escherichia coli BL21 (DE3) using MuNANA as substrate after 10 mins in presence of [D-glucose-1-14C]lactose by liquid scintillation counting method
- Dose Response confirmation of activators of hexokinase domain containing I (HKDC1) Data Source: Sanford-Burnham Center for Chemical Genomics (SBCCG) Source Affiliation: Sanford-Burnham Medical Research Institute (SBMRI, San Diego, CA) Network: NIH Molecular Libraries Probe Production Centers Network (MLPCN) Grant Proposal Number: R21 NS061703-01S1 Assay Provider: Dr. Jeff Johnson, Metabolex, Inc., Hayward, CA. The gene HKDC1 (HexoKinase Domain Containing I) was found to encode a fifth mammalian hexokinase. Since hexokinases (HKs) are the first step in glucose metabolism, they play a major role in regulating the metabolic fate of glucose in the tissues they are expressed. Understanding both the proper and pathological metabolism of glucose is obviously of critical importance to deciphering the dysregulation of glucose that leads to Type 2 diabetes, a disorder of metabolism that morbidly afflicts 35 million Americans and perhaps close to 200 million worldwide. It is our expectation that HTS to find small molecule activators for HKDC1 will begin the process of identif
- Dose Response confirmation of activators of hexokinase domain containing I (HKDC1) in the hexokinase 1 selectivity assay Data Source: Sanford-Burnham Center for Chemical Genomics (SBCCG) Source Affiliation: Sanford-Burnham Medical Research Institute (SBMRI, San Diego, CA) Network: NIH Molecular Libraries Probe Production Centers Network (MLPCN) Grant Proposal Number: R21 NS061703-01S1 Assay Provider: Dr. Jeff Johnson, Metabolex, Inc., Hayward, CA. Since hexokinases (HKs) are the first step in glucose metabolism, they play a major role in regulating the metabolic fate of glucose in the tissues they are expressed. Understanding both the proper and pathological metabolism of glucose is obviously of critical importance to deciphering the dysregulation of glucose that leads to Type 2 diabetes, a disorder of metabolism that morbidly afflicts 35 million Americans and perhaps close to 200 million worldwide. One member of HK enzyme family, Hexokinase IV or glucokinase, has been the subject of intense pharmaceutical development of small molecule activators for treatment of Type 2 diabetes. The other members of
- Dose Response confirmation of inhibitors of hexokinase domain containing I (HKDC1) in the hexokinase 1 selectivity assay Data Source: Sanford-Burnham Center for Chemical Genomics (SBCCG) Source Affiliation: Sanford-Burnham Medical Research Institute (SBMRI, San Diego, CA) Network: NIH Molecular Libraries Probe Production Centers Network (MLPCN) Grant Proposal Number: R21 NS061703-01S1 Assay Provider: Dr. Jeff Johnson, Metabolex, Inc., Hayward, CA. Since hexokinases (HKs) are the first step in glucose metabolism, they play a major role in regulating the metabolic fate of glucose in the tissues they are expressed. Understanding both the proper and pathological metabolism of glucose is obviously of critical importance to deciphering the dysregulation of glucose that leads to Type 2 diabetes, a disorder of metabolism that morbidly afflicts 35 million Americans and perhaps close to 200 million worldwide. The gene HKDC1 (HexoKinase Domain Containing I) was found to encode a fifth mammalian hexokinase. Its expression pattern is unique among hexokinases, providing some initial clues to its function in biolog
- Human Glucose-6-Phosphate Dehydrogenase Dose Response Selectivity Assay for Inhibitors of Plasmodium falciparum Glucose-6-Phosphate Dehydrogenase Data Source: Sanford-Burnham Center for Chemical Genomics (SBCCG) Source Affiliation: Sanford-Burnham Medical Research Institute (SBMRI, San Diego CA) Network: NIH Molecular Libraries Probe Production Centers Network (MLPCN) Grant Number: 1R21AI082434-01 Assay Provider: Lars Bode, Ph.D., University of California San Diego, San Diego, CA Tropical malaria caused by the protozoan parasite Plasmodium falciparum is responsible for up to three million deaths annually. Due to increasing regional distribution and resistances against the clinically used antimalarials, novel antimalarial drugs - which have new mechanisms of action and are suitable for combination therapies - are urgently required. Plasmodium falciparum Glucose-6-phosphate dehydrogenase (PfGluPho) is a potential novel target for antimalarial drug design. Glucose-6-Phosphate Dehydrogenase (G6PD) reaction is the first and rate-limiting step in the pentose phosphate pathway (PPP), catalyzed by a bifunctional enzyme Plasmodium fal
- ChEBML_1672254 Activation of full length human C-terminal FLAG-tagged glucokinase (12 to 465 residues) expressed in Escherichia coli DH10b using glucose as substrate after 60 mins in presence of ATP by kinase-glo luminescence assay
- ChEMBL_1909270 (CHEMBL4411716) Activation of insulin-stimulated glycogen synthase in human HepG2 cells using [U-14C]UDP glucose as substrate preincubated for 18 hrs followed by insulin stimulation and measured after 15 mins by beta-counting method
- ChEMBL_1914052 (CHEMBL4416635) Inhibition of C-terminal His10-tagged Staphylococcus aureus seg50 SerRS expressed in Lemo21(DE3) using Ap4A as substrate in presence of serine by leuconostoc mesenteroides hexokinase/glucose 6-Phosphate dehydrogenase coupled UV-visible spectrophotometry
- ChEMBL_1914053 (CHEMBL4416636) Inhibition of human N-terminal polyHis-tagged SerRS expressed in Escherichia coli BL21 (DE3) using Ap4A as substrate in presence of serine by leuconostoc mesenteroides hexokinase/glucose 6-Phosphate dehydrogenase coupled UV-visible spectrophotometry
- ATP Assay HT1080 cells (as well as other cell types) were plated to confluency in 96-well plates. Cells were exposed to the combination of 10 μM Oligomycin (to block mitochondrial-derived ATP), and the glucose uptake inhibitor compounds for one-hour, after which glycolytically-dervied ATP was measured with the Cell Titer-Glo assay kit (Promega). Dose-response curves of the glucose uptake inhibitor compounds were used to determine the IC50 for GLUT activity.
- ChEMBL_1565338 (CHEMBL3782732) Inhibition of human GLUT3 expressed in GLUT1 knock-out DLD1 cells assessed as ATP production co-incubated with 300 mM glucose for 16 hrs by CellTiter-Glo assay in presence of oxidative phosphorylation inhibitor rotenone
- ChEMBL_1914051 (CHEMBL4416634) Inhibition of C-terminal His10-tagged Escherichia coli B ER2560 SerRS expressed in Lemo21(DE3) using Ap4A as substrate in presence of serine by leuconostoc mesenteroides hexokinase/glucose 6-Phosphate dehydrogenase coupled UV-visible spectrophotometry
- ChEMBL_2107524 (CHEMBL4816199) Inhibition of G6PD (unknown origin) assessed as reduction in 6-phospho-D-glucono-1,5-lactone and NADPH production using glucose-6-phosphate and NADP+ as substrate incubated for 15 mins by UV absorption photometry assay
- ChEMBL_2248960 (CHEMBL5163170) Positive allosteric modulator activity at GLP-1R in rat INS1 beta-cells assessed potentiation of GLP-1(7-36)NH2 induced insulin secretion incubated for 30 mins in presence of high glucose condition by ELISA
- ChEMBL_2545794 Inhibition of PI3Kbeta in human adipocytes assessed as reduction in insulin-induced 2-deoxy-[U-14C]-glucose uptake preincubated for 3 hrs followed by insulin addition and measured after 30 mins by microbeta scintillation counting analysis
- ChEMBL_1630550 (CHEMBL3873256) Competitive inhibition of rabbit muscle glycogen phosphorylase-a assessed as release of inorganic phosphate using varying levels of glucose-1-phosphate and constant concentration of AMP and glycogen measured after 1 min by Dixon plot method
- ChEMBL_2223201 (CHEMBL5136535) Inhibition of GCS in human A-375 cells using C6-ceramide and UDP-glucose as substrate preincubated for 30 mins followed by substrate addition measured after 20 hrs by UDP-Glo glucosylceramide synthase based luminometer analysis
- ChEMBL_2282176 Inhibition of human MCT4 in human SNU-398 cells assessed as inhibition of lactate efflux preincubated for 30 mins followed by D(+)glucose and measured after 4 hrs by dialysis based UHPLC-ESI-Q-Orbitrap-MS analysis
- ChEMBL_2282177 Inhibition of human MCT4 in human NCI-H358 cells assessed as inhibition of lactate efflux preincubated for 30 mins followed by D(+)glucose and measured after 4 hrs by dialysis based UHPLC-ESI-Q-Orbitrap-MS analysis
- ChEMBL_2282178 Inhibition of human MCT4 in human NCI-H441 cells assessed as inhibition of lactate efflux preincubated for 30 mins followed by D(+)glucose and measured after 4 hrs by dialysis based UHPLC-ESI-Q-Orbitrap-MS analysis
- ChEMBL_2282192 Inhibition of human MCT4 in human RT-4 cells assessed as inhibition of lactate efflux preincubated for 30 mins followed by D(+)glucose and measured after 4 hrs by dialysis based UHPLC-ESI-Q-Orbitrap-MS analysis
- ChEMBL_2282159 Inhibition of human MCT4 in human MDA-MB-231 cells assessed as inhibition of lactate efflux preincubated for 30 mins followed by D(+)glucose and measured after 4 hrs by dialysis based UHPLC-ESI-Q-Orbitrap-MS analysis
- ChEMBL_2282175 Inhibition of human MCT4 in human SNU-398 cells assessed as inhibition of radioactive lactate efflux preincubated for 30 mins followed by D(+)glucose and measured after 4 hrs by dialysis based UHPLC-ESI-Q-Orbitrap-MS analysis
- ChEMBL_2282191 Inhibition of human MCT4 in human MIA PaCa-2 cells assessed as inhibition of lactate efflux preincubated for 30 mins followed by D(+)glucose and measured after 4 hrs by dialysis based UHPLC-ESI-Q-Orbitrap-MS analysis
- ChEMBL_2282174 Inhibition of human MCT4 in human MDA-MB-231 cells assessed as inhibition of radioactive lactate efflux preincubated for 30 mins followed by D(+)glucose and measured after 4 hrs by dialysis based UHPLC-ESI-Q-Orbitrap-MS analysis
- ChEMBL_2521264 Inhibition of human GLUT1 expressed in human DLD-1 cells assessed as reduction in glucose uptake by measuring decrease in ATP production incubated for 15 mins in presence of oxidative phosphorylation inhibitor rotenone by CellTiter-Glo Luminescent Cell Viability Assay
- ChEMBL_2354156 Inhibition of GCS in human A-375 cell golgi body using C6-ceramide and UDP-glucose as substrate assessed as reduction in UDP production preincubated for 30 mins followed by substrate addition and measured after 20 hrs by UDP-Glo luminometer analysis
- ChEMBL_2521266 Inhibition of human GLUT3 expressed in human GLUT1-/- DLD-1 cells assessed as reduction in glucose uptake by measuring decrease in ATP production incubated for 15 mins in presence of oxidative phosphorylation inhibitor rotenone by CellTiter-Glo Luminescent Cell Viability Assay
- SyncroPatch 384 (Nanion) High Throughput Electrophysiology Assay Solutions were of the following composition:Earle's balanced salt solution (in mM): 135 NaCl, 5.4 KCl, 5 Glucose, 2 CaCl2), 1 MgCl2, 5 HEPES, pH 7.4. Seal enhancer solution (in mM): 90 NaCl, 3 KCl, 35 CaCl2), 10 MgCl2, 10 HEPES, pH 7.4. Extracellular recording solution (in mM): 71 NaCl, 70 NMDG, 13 KCl, 5 Glucose, 2 CaCl2), 1 MgCl2, 10 HEPES, pH 7.4. Intracellular recording solution (in mM): 130 KF, 20 KCl, 4 EGTA, 10 HEPES, 2 EDTA, 0.01 Escin, pH 7.2.
- Glycogen Phosphorylase Activity Assay The activity of recombinant human liver GPa in the forward direction was measured by monitoring the production of NADPH. Enzyme activity was assayed at pH 6.8 in phosphate buffer containing beta-NADP, alpha -glucose 1,6-bisphosphate, glucose-6-phophate dehydrogenase, phosphoglucomutase, glycogen, and glucose. The basal rate of hLGPa enzyme activity in the absence of inhibitors (Control) was determined by adding DMSO alone, and a fully-inhibited rate of hLGPa enzyme activity was obtained by adding the positive control test substance, 200 mM caffeine. The reaction was started by adding hLGPa solution (beta-glycerophosphate and cystein, pH 6.8). The reaction took place at room temperature, and the conversion of oxidized beta-NADP to reduced beta-NADPH was measured at 340 nm for 2 h. The hLGPa inhibition IC50 values were calculated using the logistic regression method and SAS software.
- ChEMBL_1630554 (CHEMBL3873260) Competitive inhibition of rabbit muscle glycogen phosphorylase-b assessed as release of inorganic phosphate using varying levels of glucose-1-phosphate and constant concentration of AMP and glycogen measured at 1 min time interval for 1 to 5 mins by Hill plot method
- G6DPH counterscreen for TbHK1 inhibitors - Analogues series Excerpt from MH082340 application (Dr. James Morris, Clemson University) Trypanosoma brucei, the digenic protozoan parasite that causes African sleeping sickness in man, annually infects ~500,000 people in sub-Saharan Africa, leading to 50,000-70,000 deaths per year. Glucose metabolism is essential for the parasite, with the pathogenic lifestage of the parasite, the bloodstream form (BSF), acquiring energy exclusively through glycolysis. Hexokinase (HK), the first enzyme in glycolysis, catalyses the transfer of the phosphoryl group of ATP to glucose yielding glucose-6-phosphate. Several lines of experimental evidence confirm that HK activity is essential to T. brucei. First, RNA interference (RNAi) of HK in BSF parasites is lethal (see below and (Albert et al., 2005)). Also, attempts to generate knockouts have been unsuccessful (below and (Albert et al., 2005)). Last, specific inhibitors of TbHK activity have been developed that are trypanocidal, albeit at high concentrations
- ChEMBL_1630548 (CHEMBL3873254) Competitive inhibition of His6-tagged human liver glycogen phosphorylase-a expressed in Escherichia coli BL21 Gold (DE3) assessed as release of inorganic phosphate using varying levels of glucose-1-phosphate and constant concentration of AMP and glycogen measured after 1 min by Dixon plot method
- Human Liver GPa Enzymatic Activity Assay An enzymatic assay was developed to measure the response of the activated form of glycogen phosphorylase to small molecule compounds. The assay was to monitor the glycogenolytic reaction by coupling the production of glucose-1 -phosphate from glycogen and inorganic phosphate to phosphoglucomutase, glucose-6-phosphate dehydrogenase, NADH oxidase and horseradish peroxidase to produce the fluorescent product resorufin. The assays were performed in duplicate in 96 or 384-well microtiter plates and the change in fluorescence due to product formation was measured on a fluorescence plate reader using a 560 nm excitation filter and 590 emission filter.
- Inhibition Assay Rabbit muscle glycogen phosphorylase a (RMGPa) activity was measured by the release of phosphate from glucose-1-phosphate at 655 nm. Each compound was dissolved in DMSO and diluted at different concentrations. RMGPa was added to 100 µL of buffer (50 mM Hepes pH 7.2, 100 mM KCl, 2.5 mM MgCl2, 0.5 mM glucose-1-phosphate, 1 mg/mL glycogen, and compound in 96-well microplates. Reaction was initiated by the addition of 150 µL of 1 M HCl containing 10 mg/mL ammonium molybdate and 0.38 mg/mL malachite green and run for 25 min at 22 C.
- ChEMBL_1833218 (CHEMBL4333226) Inhibition of PFKFB3 in human HCT116 cell lysates assessed as reduction in glycolytic-flux induced fructose-2,6-bisphosphate formation using fructose-6-phosphate as substrate treated with cells prior to glucose stimulation followed by PFK1 and substrate addition and measured at 0.5 mins interval for 45 mins
- Confirmation assay for inhibitors of Trypanosoma brucei hexokinase 1-Analogue-first series Excerpt from MH0882340 application (Dr. James Morris, Clemson University) Trypanosoma brucei, the digenic protozoan parasite that causes African sleeping sickness in man, annually infects ~500,000 people in sub-Saharan Africa, leading to 50,000-70,000 deaths per year. Glucose metabolism is essential for the parasite, with the pathogenic lifestage of the parasite, the bloodstream form (BSF), acquiring energy exclusively through glycolysis. Hexokinase (HK), the first enzyme in glycolysis, catalyses the transfer of the phosphoryl group of ATP to glucose yielding glucose-6-phosphate. Several lines of experimental evidence confirm that HK activity is essential to T. brucei. First, RNA interference (RNAi) of HK in BSF parasites is lethal (see below and (Albert et al., 2005)). Also, attempts to generate knockouts have been unsuccessful (below and (Albert et al., 2005)). Last, specific inhibitors of TbHK activity have been developed that are trypanocidal, albeit at high concentration
- Dose Response confirmation of uHTS small molecule inhibitors of Plasmodium falciparum Glucose-6-phosphate dehydrogenase via a fluorescence intensity assay Data Source: Sanford-Burnham Center for Chemical Genomics (SBCCG) Source Affiliation: Sanford-Burnham Medical Research Institute (SBMRI, San Diego CA) Network: NIH Molecular Libraries Probe Production Centers Network (MLPCN) Grant Number: 1R21AI082434-01 Assay Provider: Lars Bode, Ph.D., University of California San Diego, San Diego, CA Tropical malaria caused by the protozoan parasite Plasmodium falciparum is responsible for up to three million deaths annually. Due to increasing regional distribution and resistances against the clinically used antimalarials, novel antimalarial drugs - which have new mechanisms of action and are suitable for combination therapies - are urgently required. Plasmodium falciparum Glucose-6-phosphate dehydrogenase (PfGluPho) is a potential novel target for antimalarial drug design. Glucose-6-Phosphate Dehydrogenase (G6PD) reaction is the first and rate-limiting step in the pentose phosphate pathway (PPP), catalyzed by a bifunctional enzyme Plasmodium fal
- Dose Response orthogonal assay utilizing the direct end-point detection of NADPH for uHTS small molecule inhibitors of Plasmodium falciparum Glucose-6-phosphate dehydrogenase Data Source: Sanford-Burnham Center for Chemical Genomics (SBCCG) Source Affiliation: Sanford-Burnham Medical Research Institute (SBMRI, San Diego CA) Network: NIH Molecular Libraries Probe Production Centers Network (MLPCN) Grant Number: 1R21AI082434-01 Assay Provider: Lars Bode, Ph.D., University of California San Diego, San Diego, CA Tropical malaria caused by the protozoan parasite Plasmodium falciparum is responsible for up to three million deaths annually. Due to increasing regional distribution and resistances against the clinically used antimalarials, novel antimalarial drugs - which have new mechanisms of action and are suitable for combination therapies - are urgently required. Plasmodium falciparum Glucose-6-phosphate dehydrogenase (PfGluPho) is a potential novel target for antimalarial drug design. Glucose-6-Phosphate Dehydrogenase (G6PD) reaction is the first and rate-limiting step in the pentose phosphate pathway (PPP), catalyzed by a bifunctional enzyme Plasmodium fal
- Dose Response orthogonal kinetic assay utilizing the direct detection of NADPH for uHTS small molecule inhibitors of Plasmodium falciparum Glucose-6-phosphate dehydrogenase Data Source: Sanford-Burnham Center for Chemical Genomics (SBCCG) Source Affiliation: Sanford-Burnham Medical Research Institute (SBMRI, San Diego CA) Network: NIH Molecular Libraries Probe Production Centers Network (MLPCN) Grant Number: 1R21AI082434-01 Assay Provider: Lars Bode, Ph.D., University of California San Diego, San Diego, CA Tropical malaria caused by the protozoan parasite Plasmodium falciparum is responsible for up to three million deaths annually. Due to increasing regional distribution and resistances against the clinically used antimalarials, novel antimalarial drugs - which have new mechanisms of action and are suitable for combination therapies - are urgently required. Plasmodium falciparum Glucose-6-phosphate dehydrogenase (PfGluPho) is a potential novel target for antimalarial drug design. Glucose-6-Phosphate Dehydrogenase (G6PD) reaction is the first and rate-limiting step in the pentose phosphate pathway (PPP), catalyzed by a bifunctional enzyme Plasmodium fal
- HTS assay for inhibitors of Trypanosoma brucei hexokinase 1: IC50 determinations Excerpt from MH082340 application (Dr. James Morris, Clemson University) Trypanosoma brucei, the digenic protozoan parasite that causes African sleeping sickness in man, annually infects ~500,000 people in sub-Saharan Africa, leading to 50,000-70,000 deaths per year. Glucose metabolism is essential for the parasite, with the pathogenic lifestage of the parasite, the bloodstream form (BSF), acquiring energy exclusively through glycolysis. Hexokinase (HK), the first enzyme in glycolysis, catalyses the transfer of the phosphoryl group of ATP to glucose yielding glucose-6-phosphate. Several lines of experimental evidence confirm that HK activity is essential to T. brucei. First, RNA interference (RNAi) of HK in BSF parasites is lethal (see below and (Albert et al., 2005)). Also, attempts to generate knockouts have been unsuccessful (below and (Albert et al., 2005)). Last, specific inhibitors of TbHK activity have been developed that are trypanocidal, albeit at high concentrations
- Spectrophotometrical Assay FBPase activity was measured spectrophotometrically by employing the coupling enzymes phosphoglucose isomerase and glucose-6-phosphate dehydrogenase.17 The reduction of NADP+ to NADPH was monitored directly at 340 nm. Specifically, buffer (0.2 M Tris, 4 mM MgCl2, 4 mM (NH4)2SO4, 0.1 EDTA, pH 7.5), 0.2 mM of NADP+, 1.4 units of phosphoglucose isomerase and 0.5 units of glucose-6-phosphate dehydrogenase, 0-300M of inhibitor and 9 ng of FBPase, were mixed in a cuvette and equilibrated at 30° C. 70M of FBP was then added to initiate the reaction. Absdata were collected as a function of time using a JASCO V-630 spectrophotometer.
- Activation Assay The final assay volume was 200 uL and the final buffer conditions used in this assay were as follows: 25 mM HEPES, 5 mM glucose, 1 mM ATP, 2 mM MgCl2, 1 mM NAD, 1 mM DTT, 8.5 U/mL G6PDH, 100 nM glucokinase, and 25 mM KCl. The buffer pH was 7.1. The mixture A was first made containing KCl, MgCl2, DTT and Glucose in HEPES buffer. The mixture B was made containing NAD and ATP. The test compound in DMSO solution, the mixture A, the mixture B and G6PDH were first mixed in a 96-well plate. Glucokinase was then added to initiate the reaction, and the absorbance at 340 nm was monitored every 5 mins. The activity of glucokinase was represented by the initial generation rate of glucose-6-phosphate, which was calculated by drawing the slope values from the absorbance changing curve at 340 nm vs. the time points. Compounds of this invention have an EC50 value as measured using the assay described herein of less than 50 μM.
- Glucan Synthase Assay The glucan synthase assay follows the incorporation of tritiated UDP-glucose into acid insoluble β-glucan as catalysed by the glucan synthase activity present in membrane preparations from Candida albicans and Aspergillus fumigatus. UDP-[3H]-glucose (ca 0.01 μCi) is added to 100 μl assay buffer (50 mM Tris-Cl, pH8.0, 8% glycerol, 1 mM EDTA, 1.5 mM KF, 1 mM DTT, 20 μM GTPγS, 600 μM UDP-glucose) and the reaction initiated by the addition of 2.5 μl of enzyme preparation. After incubation at 30°C. for 120 minutes, 10 μl of 30 mg/ml BSA is added with mixing and the reaction is terminated with 110 μl ice-cold 20% TCA. The precipitate is collected on a GF/B filter plate and washed three times with 200 μl water. Once dry, 200 μl of Microscint20 is added to each well and the plate is read on a Top-count scintillation counter.
- Enzyme Inhibition Assay The assay phosphotransferase activity was followed spectrophotometrically b reduction of NADP in the presence of an excess of glucose-6-phosphate-dehydrogenase (method A). ATPase activity was measured by spectrophotometric measurement of the rate of oxidation of NADH in the presence of phospho-enol-pyruvate, pyruvated-kinase and lactate-dehydrogenase (method B).
- Inhibitory Effects on Activities of Cytochrome P450 Isozymes Inhibitory Effects on Activities of Cytochrome P450 Isozymes (CYP1A2, CYP2C9, CYP2C19, CYP2D6, and CYP3A4) from Human Liver Microsomes. A total of six specific probe substrates of six isozymes of CYPs, i.e., α-Naphthoflavone (CYP1A2), Sulphaphenazole (CYP2C9), Ticlopidine (CYP2C19), Quinidine (CYP2D6), Ketoconazole (CYP3A4), and Montelukast (CYP2C8) were co-incubated with recombinant hepatic drug enzymes CYP1A2, CYP2C9, CYP2C19, CYP2D6, CYP3A4, and CYP2C8 and test compounds, respectively. Nicotinamide adenine dinucleotide phosphate (NADP+), D-glucose-6-phosphate (G6P) and glucose-6-phosphate dehydrogenase (G6DHP) were added to start the reaction. At the end of the reaction, the corresponding half maximal inhibitory concentrations (IC50) were calculated by the fluorescence detection method (Ex490 nm/Em520 nm).
- Measurement of 11beta-HSD1 Activity The enzyme assay was performed in a round-bottom 96-well plate. The enzyme was pre-incubated in the assay buffer in the presence of NADPH and inhibitor. Next, the reaction is initiated by adding a regenerating system (consisting of glucose-6-phosphate, glucose-6-phosphate dehydrogenase, and MgCl2), and labeled 3H-cortisone substrate. After the incubation, the substrate and product peaks are separated and analyzed by using an HPLC system. The initial reaction velocities recorded were in the linear range and were determined by measuring the peak area for cortisol formation with time. The inhibition of 11beta-HSD was analyzed by fitting the data to an equation to determine apparent inhibition constant Ki.
- Glycogen Phosphorylase Enzyme Assay The enzymatic inhibition of phosphorylase activity was monitored using microplate reader (Bio-Rad). In brief, GPa activity was measured in the direction of glycogen synthesis by the release of phosphate from glucose-1-phosphate. Each compound was dissolved in DMSO and diluted at different concentrations for IC50 determination. The enzyme was added into the buffer containing compound, glucose-1-phosphate, and 1 mg/mL glycogen in 96-well microplates (costar). After the addition of ammonium molybdate and malachite green, reactions were run at 22 deg C for 25 min. And then the phosphate absorbance was measured at 655 nm. The IC50 values were estimated by fitting the inhibition data to a dose-dependent curve using a logistic derivative equation.
- P450 Inhibition Assay A range of concentrations of each compound in a 96-well plate were preincubated in buffer containing recombinant human CYP450 microsomal protein and the substrate. Following preincubation, NADPH generating system (glucose-6-phosphate, NADP, and glucose 6-phosphate dehydrogenase) was added to each well to start the reaction. Production of fluorescent metabolite was measured using Cytofluor (Perkin-Elmer, US) plate reader. The rate of metabolite production (AFU/min) was determined for each concentration of compound and converted to a percentage of the mean control rates using Cytofluor software. The inhibitory potential (IC50) of each compound was determined from the slope of the plot using GraFit v5.08 (Erithacus software, UK). Miconazole was included as a positive control for each isozyme.
- Inhibition Assay The potential of the test compound to act as a competitive inhibitor of CYP3A4 was evaluated in in vitro assays, using human liver microsomes and the reference substrate midazolam. The test compound was solved in acetonitrile. Human liver microsomal preparation (pool of HLM) was applied for the assay. A stock solution of the test compound was added to phosphate buffer containing EDTA, NADP, glucose 6-phosphate, and glucose 6-phosphate dehydrogenase. This mixture was sequentially diluted on a Genesis Workstation (Tecan, Crailsheim, FRG). After pre-warming, reaction was initiated by addition of a mixture of probe substrate (midazolam). Finally, the incubation mixtures contained human liver microsomes at protein concentration of 60 ug/mL, NADPH-regenerating system (1 mM NADP, 5.0 mM glucose 6-phosphate, glucose 6-phosphate dehydrogenase (1.5 U/mL), 1.0 mM EDTA, the test compound at 6 different concentrations, 2.5 uM midazolam as probe substrate, and phosphate buffer (50 mM, pH 7.4) in a total volume of 200 uL. Incubations were performed on a Genesis Workstation (Tecan, Crailsheim, FRG) in 96-well plates (Microtiter plate, 96-well plate) at 37° C. Stock solution of probe substrate was prepared in water (midazolam 10 mM). Ketoconazole was used as positive control of a direct-acting inhibitor. The reference samples (substrate, but no inhibitor) were incubated in parallel in sextuple and contained the same amount of solvent as the test incubations. Reactions were stopped by addition of 100 uL acetonitrile containing the internal standard. Precipitated proteins were removed by centrifugation of the well plate, supernatants were analyzed by LC-MS/MS.
- The Alizarin Assay (ARS) (Glucose) The alizarin-red binding assay is a colorimetric assay used to determine the inhibition affinity of boronate compounds to glucose. The assay is based on a colour shift of alizarin-red upon binding to boronate, which shift can be followed by change in absorbance in the 330-340 nm region. For determination of the inhibitory constant (Ki) between the boronate and the carbohydrate, 400 μM of boronic acids is dissolved in a 20 mM phosphate buffer pH 7.4 under gentle stirring. Upon complete dissolution of the compound, 200 μM of Alizarin red (ARS) is added to the solution. The ARS-boronate solution is then aliquoted into a 96 multiwell plate (black, flat and clear bottom) 1:1 with appropriate carbohydrate. In particular, D-glucose solutions are prepared in a 20 mM phosphate buffer pH 7.4 at these concentrations respectively: 1000, 500, 250, 100, 50, 25, 10, 5, 2.5, 1, 0.25, 0.1 mM and 2500, 1000, 500, 100, 50, 10, 5, 1, 0.5, 0.1, 0.05, 0.01 mM. The plate with ARS-boronate mixed with carbohydrate is incubated 20 minutes at room temperature. After 5 minutes of centrifugation at 4000 rpm the plate is placed in a multiwell spectrometer (Spectra Max, Molecular Devices) for absorption detection.
- Recombinant CYP Inhibition Assay Recombinant CYP Inhibition Assay: In a drug discovery program, a rapid screening for cyctochrome P450 (CYP450) inhibitors is a part of the existing standard for avoiding the development of drugs likely to give clinical pharmacokinetic drug-drug interactions and associated toxicities. A microtiter plate-based, direct fluorometric assay for the activities of the principal human drug-metabolizing enzymes, CYP2D6 and CYP3A4 can be used and these assays are rapid and compatible with existing high-throughput assay instrumentation. Fluorometric Enzyme Inhibition Assays: Test compounds were dissolved in 100% organic solvent (CH3CN or DMSO) to make 30 mM stock solutions. Quinidine (CYP2D6 assay, Sigma Aldrich) and ketoconazole (CYP3A4 assay, Sigma Aldrich) ran as positive controls and were dissolved in 100% acetonitrile to make 1 mM stock solutions. A 100 mM potassium phosphate buffer was prepared and adjusted to pH 7.4. The 30 mM stock solution of test and control compounds (1 mM) were further diluted in phosphate buffer (100 mM, pH 7.4) to ensure the final organic solvent content was <0.2% in the reaction. In a separate falcon tube, a 2× enzyme/substrate (E/S) solution was prepared in phosphate buffer. The final concentration of CYP2D6 (Corning) and AMMC was 10 nM and 4 μM, and CYP3A4 (Corning) and BFC was 20 nM and 40 μM, respectively. In a separate falcon tube, a 2× NADPH regenerating system (NRS) was prepared in phosphate buffer. The final concentration for each component in the assay was as follows:CYP2D6 assay=0.008 mM NADPH, 3.3 mM glucose 6-phosphate, 0.4 U of glucose-6-phosphate dehydrogenase/mL CYP3A4 assay=2.45 mM NADPH, 24.7 mM glucose 6-phosphate, 1.25 U of glucose-6-phosphate dehydrogenase/mL.
- Biological Assay HEK-Gqi5 cells stably expressing CCR2 were cultured in (DMEM high glucose, 10% FBS, 1% PSA, 400 μg/ml geneticin and 50 μg/ml hygromycin. Appropriate positive control chemokines (MCP-1, MIP1A or RANTES) was used as the positive control agonist for screening compound-induced calcium activity assayed on the FLIPRTetra. The drug plates were prepared in 384-well microplates using the EP3 and the MuItiPROBE robotic liquid handling systems.
- Enzyme Inhibition Assay The activity of the compounds is determined by measuring the inhibitory effect of the compounds in the direction of glycogen synthesis, the conversion of glucose-1-phosphate into glycogen with the release of inorganic phosphate, which was monitored using microplate reader (BIO-RAD). The phosphate absorbance was measured at 655 nm. The IC50 values were estimated by fitting the inhibition data to a dose dependent curve using a logistic derivative equation.
- In Vitro Assays of Nox Inhibiting Activity Reactive oxygen produced in whole cells or in membrane preparation of Nox1, Nox3, Nox4, Nox5 and xanthine oxidase and glucose oxidase were determined using Amplex Red as detection probe of formed H2O2. Amplex Red (10-acetyl-3,7-dihydroxyphenoxazine) in combination with HRP and co-factors reacts with H2O2 in a 1:1 stoichiometry to form a highly fluorescent resorufin excitated at 544 nm producing emission at 590 nm.
- FLIPR Assay 1321N1 cells expressing the recombinant human, rat or mouse P2X7 channel was cultured in HyQ DME/(HyClone/Dulbecco's Modified Eagle Medium) high glucose supplemented with 10% Fetal Bovine Serum (FBS) and appropriate selection marker. Cells were seeded at a density of 25000 cells/well (96-well clear bottom black walled plates) in 100 ul volume/well. On the day of the experiment, cell plates were washed with assay buffer, containing (in mM): 130 NaCl, 2 KCl, 1 CaCl2, 1 MgCl2, 10 HEPES, 5 glucose; pH 7.40 and 300 mOs. After the wash, cells were loaded with the Calcium-4 dye (Molecular Device) and incubated in the dark for 60 minutes. Test compounds were prepared at 250x the test concentration in neat DMSO. Intermediate 96-well compound plates were prepared by transferring 1.2 uL of the compound into 300 uL of assay buffer. A further 3x dilution occurred when transferring 50 uL/well of the compound plate to 100 uL/well in the cell plate.
- Fluorometric CYP450 Enzyme Inhibition Assay Test compounds were prepared in 100% DMSO or 100% MeOH and did not exceed a final concentration of <0.2% in the final reaction. A 100 mM sodium phosphate buffer was prepared and adjusted to pH 7.4. In a separate falcon tube, a 2 enzyme/substrate (E/S) solution was prepared in phosphate buffer. The final concentration of CYP2D6 (CORNING ) and 7-amido-4-methyl coumaric acid (AMMC) was 10 nM and 4 uM, and CYP3A4 (CORNING ) and 7-benzyloxy-4-(trifluoromethyl) coumarin (BFC) was 20 nM and 40 uM, respectively. In a separate falcon tube, a 2 NADPH regenerating system (NRS) was prepared in phosphate buffer. The final concentration for each component in the assay was as follows:CYP2D6 assay: 0.008 mM NADPH, 3.3 mM glucose 6-phosphate, 0.4 U of glucose-6-phosphate dehydrogenase per mLCYP3A4 assay: 2.45 mM NADPH, 24.7 mM glucose 6-phosphate, 1.25 U of glucose-6-phosphate dehydrogenase per mLBoth enzymatic assays were conducted in a 96-well microtiter plate (Black, CORNING COSTAR ) with a final volume of 100 uL. Preparation of the plate began with the addition of 74 uL of the E/S in the first well, and 50 uL to all subsequent wells (from 2-11). The test compounds (1 uL) were dissolved in the first well to give the first row a final volume of 75 uL. A 1:3 serial dilution of the test compound was conducted by removing 25 uL from the first well and diluting it with the second and so forth until the tenth row. Final concentrations yielded a range from 200 uM-0.01 uM. Well no. 11 contained no inhibitor, and well no. 12 contained no enzyme. Both were used as controls for background fluorescence. The plate was incubated for 30 min at 37 C. After incubation, the reaction was initiated by the addition of 50 uL of the 2 NRS to each well.
- Biological Assay HEK-Gqi5 cells stably expressing human CCR6 were cultured in DMEM high glucose, 10% FBS, 1% PSA, 400 ug/ml geneticin and 50 ug/ml hygromycin. Appropriate positive control chemokine (MIP3α) was used as the positive control agonist for screening compound-induced calcium activity assayed on the FLIPRTetra. The drug plates were prepared in 384-well microplates using the EP3 and the MultiPROBE robotic liquid handling systems. Compounds disclosed herein were tested for CCR6 activity.
- Enzyme Inhibition Assay The inhibitory activity of the test compounds against human recombinant glycogen phosphorylase a (GPa) was monitored using 96-well microplate format. The glucose-1-phosphate production from glycogen monitored by a multienzyme coupled assay. The change in optical density due to inorganic phosphate formation was measured at 620nM in a Labsystems iEMS Reader MF. The IC50 values were estimated by fitting the inhibition data to a dose dependent curve using a logistic derivative equation.
- FLIPR Assay HEK-Gqi5 cells stably expressing CCR2 were cultured in (DMEM high glucose, 10% FBS, 1% PSA, 400 μg/ml geneticin and 50 μg/ml hygromycin. Appropriate positive control chemokines (MCP-1, MIP1A or RANTES) was used as the positive control agonist for screening compound-induced calcium activity assayed on the FLIPR Tetra. The drug plates were prepared in 384-well microplates using the EP3 and the MultiPROBE robotic liquid handling systems. Compounds were synthesized and tested for CCR2 activity.
- Biological Assay Twenty four hours before measurements, the expression of the NMDA receptors in the stable cell line is induced with Tet-On inducible system in the presence of a non-selective NMDA receptor blocker. On the day of the experiment, cell culture media is carefully washed and the cells are loaded with Calcium 5 Dye Kit (Molecular Devices) in dye loading buffer containing 137 mM NaCl, 4 mM KCl, 2 mM CaCl2), 0.5 mM MgCl2(standard assay) or 1.5 mM MgCl2 (HTS assay), 10 mM HEPES and 5 mM D-glucose; pH 7.4. After 1 h incubation at the room temperature, the dye is washed away with the assay buffer (137 mM NaCl (standard assay) or 150 mM (HTS assay), 4 mM KCl (standard assay) or 3 mM (HTS assay), 2 mM CaCl2), 0.01 mM EDTA, 10 mM HEPES and 5 mM D-glucose; pH 7.4) In the FLIPR TETRA reader, various concentrations of the test compounds are added to the cells for 5 min while fluorescence is monitored to detect potential agonist activity.
- Enzyme Inhibition Assay A reaction was performed on a 384-well plate (Greiner Bio One) using a reaction volume of 24 µL, and all the samples were diluted with an assay buffer (50 mM tris buffer, pH 7.4, 10% glycerol). 0.8 mM NADPH, 6 mM glucose 6-phosphate, 0.35 units/mL glucose 6-phosphate dehydrogenase (Sigma Chemical), and 3 mM magnesium chloride and a microsome fraction as an enzyme source were added to the plate, and a solution containing a test compound dissolved in a dimethyl sulfoxide/methanol solution was added at a final concentration of 0.1%. After the addition of the test compound, cortisone at a final concentration of 160 nM was added to start the reaction, and the reaction was performed at room temperature for 3 h. 25 µL of 100 mM carbenoxolone (Sigma Chemical) was added to terminate the reaction, and the amount of cortisol produced was measured with RUBYstar (BMG LABTECH JAPAN Ltd.) using a cortisol prototype kit (Cisbio International) according to the package insert.
- FLIPR Assay Ca.sup.2+flux: 1321N1 cells expressing the recombinant human, rat or mouse P2X7 channel was cultured in HyQ DME/(HyClone/Dulbecco's Modified Eagle Medium) high glucose supplemented with 10% Fetal Bovine Serum (FBS) and appropriate selection marker. Cells were seeded at a density of 25000 cells/well (96-well clear bottom black walled plates) in 100 .mu.l volume/well. On the day of the experiment, cell plates were washed with assay buffer, containing (in mM): 130 NaCl, 2 KCl, 1 CaCl.sub.2, 1 MgCl.sub.2, 10 HEPES, 5 glucose; pH 7.40 and 300 mOs. After the wash, cells were loaded with the Calcium-4 dye (Molecular Device) and incubated in the dark for 60 minutes. Test compounds were prepared at 250.times. the test concentration in neat DMSO. Intermediate 96-well compound plates were prepared by transferring 1.2 .mu.L of the compound into 300 .mu.L of assay buffer. A further 3.times. dilution occurred when transferring 50 .mu.L/well of the compound plate to 100 .mu.L/well in the cell plate.
- FLIPR Assay Ca2+ Flux: 1321N1 cells expressing the recombinant human, rat or mouse P2X7 channel was cultured in HyQ DME/(HyClone/Dulbecco's Modified Eagle Medium) high glucose supplemented with 10% Fetal Bovine Serum (FBS) and appropriate selection marker. Cells were seeded at a density of 25000 cells/well (96-well clear bottom black walled plates) in 100 ul volume/well. On the day of the experiment, cell plates were washed with assay buffer, containing (in mM): 130 NaCl, 2 KCl, 1 CaCl2, 1 MgCl2, 10 HEPES, 5 glucose; pH 7.40 and 300 mOs. After the wash, cells were loaded with the Calcium-4 dye (Molecular Device) and incubated in the dark for 60 minutes. Test compounds were prepared at 250x the test concentration in neat DMSO. Intermediate 96-well compound plates were prepared by transferring 1.2 uL of the compound into 300 uL of assay buffer. A further 3x dilution occurred when transferring 50 uL/well of the compound plate to 100 uL/well in the cell plate.
- Glucokinase Activity Assay Recombinant human liver glucokinase was expressed as a FLAG fusion protein in E. coli, and purified on ANTIFLAG M2 AFFINITY GEL (Sigma). The assay was carried out at 30° C. in a 96-well plate. In the plate was distributed 69 μl each of assay buffer (25 mM Hepes Buffer: pH=7.2, 2 mM MgCl2, 1 mM ATP, 0.5 mM TNAD, 1 mM dithiothreitol), to which was added 1 μl of a DMSO solution of the compound or DMSO as control. Then, 20 μl of pre-ice-cooled enzyme mixture (FLAG-GK, 20 U/ml G6PDH) was distributed thereto, to which was added 10 μl of 25 mM glucose as substrate to initiate the reaction (final glucose concentration=2.5 mM). After starting the reaction, the absorbance at 405 nm was measured every 30 seconds for 10 minutes to evaluate the compound based on the initial increase for 5 minutes. FLAG-GK was added so that the increase of absorbance after 5 minutes fell between 0.05 to 0.1 in the presence of 1% DMSO.
- Inhibition Assay Stably expressing cell line (C6BU-1 cell transfected with human P2X3 receptor gene (GenBank accession number Y07683)) was used. The cells were seeded in a 96-well microtiter plate at a concentration of 8000 cells/well and cultured in the medium (8.3% fetal bovine serum, 8.3% horse serum, 1% antibiotic and antifungal in DMEM) for one day at 37 C. under 5% carbon dioxide atmosphere. The medium was replaced with 4 uM Fluo-3-AM solution (pH 7.5) containing 20 mM HEPES, 137 mM NaCl, 2.7 mM KCl, 0.9 mM MgCl2, 5.0 mM CaCl2, 5.6 mM D-glucose, 2.5 mM probenecid, 10% BSA, and 0.08% Pluronic F-127, and incubated at 37° C. under 5% dioxide carbon atmosphere for one hour. The plate was washed with washing buffer (20 mM HEPES, 137 mM NaCl, 2.7 mM KCl, 0.9 mM MgCl2, 5.0 mM CaCl2, 5.6 mM D-glucose, 2.5 mM probenecid, pH 7.5), and each well was added with 40 uL of this buffer. The plate was placed in High-Throughput Screening System FDSS 3000 (Hamamatsu Photonics K.K.).
- Inhibition of Dextromethorphan Metabolism Dextromethorphan O-demethylase activity was determined in human liver microsomes. Sarpogrelate (1.0E-8 M to 3.0E-5 M) or M−1 (concentration: 3.0E-9 M to 1.0E-5 M) and dextromethorphan were dissolved in acetonitrile and serially diluted with acetonitrile to the required concentrations to give a final organic solvent concentration of 1.0% in the incubation mixture. The incubation mixtures contained pooled human liver microsomes (final concentrations: 0.25 mg/ml), dextromethorphan, and a NADPH-generating system (1.3 mM NADP+, 3.3 mM glucose 6-phosphate, 3.3 mM MgCl2, and 0.4 U/ml glucose-6-phosphate dehydrogenase). After incubation and centrifugation, the supernatant was diluted 100-fold with acetonitrile and then injected into the LC-MS/MS system. All incubations were performed in triplicate, and mean values were used for analysis. The IC50 values (concentration causing a half-maximal inhibition of control specific binding) and Hill coefficients (nH) were determined by non-linear regression analysis of the competition curves generated with mean replicate values using Hill equation curve fitting.
- Inhibitory Activity Assay The inhibition of CYP17A1 by the test compounds was evaluated using a recombinant enzyme. Human CYP17A1 was expressed in E. coli (Ehmer, P. B. et al.; J. Steroid Biochem. Mol. Biol., 75, 57-63 (2000)). The microsomal fraction and 140 μL of phosphate buffer (50 mM Na phosphate, 1 mM MgCl2, 0.1 mM EDTA, 0.1 mM dithiothreitol, pH 7.4) were preincubated separately with a mixture of progesterone (24.95 μM) and 3H-progesterone (0.05 μM, 101.3 Ci/mmol), 50 μM of an NADPH regeneration system (in phosphate buffer with 10 mM NADP+, 100 mM glucose 6-phosphate and 2.5 U of glucose 6-phosphate dehydrogenase) and the appropriate test substances (in 5 μl of DMSO) at 37° C. for 5 minutes. The reaction was started by addition of the enzyme and, after 30 minutes of incubation at 37° C., stopped by addition of 50 μl of 1N hydrochloric acid.The steroids were extracted with ethyl acetate. After evaporation of the organic phase, the steroids were taken up in acetonitrile.
- Biological Activity Test Assay TRPC5 is a type of non-selective cation channel with permeability to calcium ions. Therefore, TRPC5 agonist Englerin A (EA) and TRPC5 inhibitor Pico145 were used as positive controls in this experiment. Fluo-4 AM fluorescence dye was used to indirectly reflect the effect of the compound on TRPC5 channel by detecting intracellular Ca21 in TRPC5-HEK 293 cells.1. Cell culture1.1 Revival of TRPC5-HEK 293 cellsRevival solution: 100% high glucose DMEMSelection medium: high glucose DMEM+10% FBS+1% P/S+1% HEPES+Blasticidin (5 μg/mL)+Hygromycine (50 μg/mL)Induction medium: high glucose DMEM+10% FBS+1% P/S+1% HEPES+Doxycycline (1 μg/mL).Revival process: A cryopreservation solution containing TRPC5-HEK 293 cells was taken out from the liquid nitrogen tank, and transferred from the ice box to the water bath, and then dissolved in circles to a small piece of ice, and the cryopreservation solution was transferred to the revival solution, and centrifuged at 1000 rpm for 5 minutes, and then the supernatant was discarded, then the residue was transferred to the selection medium, and expanded in a CO2 incubator (5% CO2, humidity of 95%, 37° C.).1.2 Seeding TRPC5-HEK 293 cells in plates14 hours before the real-time fluorescence experiment, cells were washed with PBS and digested with trypsin-EDTA (TE). Cells were diluted to 200,000 cells/mL with induction medium and seeded onto a 96-well black wall bottom transparent plate coated with poly-D-lysine (PDL) (stock solution of 10 mg/mL, final concentration of 10 μg/mL) at 100 μL/well, i.e., 20,000 cells/well.2. Preparation of buffer500 mL of external solution for detecting TRPC5 calcium signals: 4.0908 g of NaCl, 0.1864 g of KCl, 0.111 g of CaCl2, 0.0476 g of MgCl2, 0.9 g of glucose, 1.1915 g of HEPES (2-[4-(2-hydroxyethyl)piperazin-1-yl]ethanesulfonic acid).Calcium fluorescent dye: an external solution for detecting TRPC5 calcium signals containing Fluo-4 with a final concentration of 4 μM (containing 0.5% BSA)
- High-Throughput Cav2.2/Kir2.3 T-Type Fluorescent Assay Cells were plated in 384-well, clear-bottom, black-walled, poly-D-lysine coated plates (Becton Dickinson, Franklin Lake, N.J.) 2 days prior to use in the FLIPR assay. 100 μL of cells (1.4×10⁶ cell/mL) containing doxycyline (Sigma-Aldrich, 1.5 μg/mL; to induce channel expression) were added to each well using a Multidrop (Thermo Scientific, Waltham, Mass.) and were maintained in 5% CO2 incubator at 37° C. On the morning of the assay, cells were transferred to a 5% CO2 incubator at 29° C. Cells can then be washed with a wash buffer containing (in mM): 118 NaCl, 18.4 HEPES, 11.7 D-glucose, 2 CaCl2, 0.5 MgSO4, 4.7 KCl, 1.2 KH2PO4, pH adjusted to 7.2 with NaOH. 4.4 μM of the fluorescent indicator dye, Fluo-4 (Invitrogen), prepared in pluronic acid (Sigma-Aldrich), were loaded into the wells and incubated for 45 minutes at 29° C. in 5% CO2. Cells were then rinsed with either a 2 mM KCl closed-state buffer (in mM: 138.5 NaCl, 10 HEPES, 10 D-glucose, 1 CaCl2, and 2 KCl, with the pH adjusted to 7.4 with NaOH) when performing the closed-state assay or 12.5 mM KCl inactivated-state buffer (in mM: 128 NaCl, 10 HEPES, 10 D-glucose, 1 CaCl2, and 12.5 mM KCl, with the pH adjusted to 7.4 with NaOH) when performing the inactivated-state assay. Concentration-dependent response curves were generated from 5 mM stock solutions prepared in DMSO (Sigma-Aldrich) and diluted in either the 2 mM KCl buffer or 12.5 mM KCl buffer and incubated for 20 minutes at 29° C. in 5% CO2. Calcium entry was evoked with an addition of 130 mM KCl stimulation buffer (in mM: 10.5 NaCl, 10 HEPES, 10 D-glucose, 1 CaCl2, and 130 KCl, with the pH adjusted to 7.4 with NaOH) for both the closed-state or inactivated-state assay. A change in the Fluo-4 fluorescence signal was assessed using FLIPRTETRA™ instrument (Molecular Devices, Sunnyvale, Calif.) for 3 minutes following the elevation of extracellular KCl using an illumination wavelength of 470-495 nm with emissions recorded at 515-575 nm.
- Coupled Enzymatic Assay The assay is carried out according to the protocol outlined in Hariharan et al (1997), Diabetes 46: 11-16. Briefly, the test compounds are incubated in a reaction mix containing 25 mM HEPES (pH 7.2), 10 mM MgCl2, 100 mM KCl, 5 mM ATP, 2 mM DTT, 0.5 mM NAD, 1 U/mL Leuconostoc mesenteroides G6PD, 0.3 U/mL of purified human recombinant GK, and different concentrations of glucose. Enzymatic activity is calculated from the initial reaction velocity, measured from the change in NADH absorbance as a function of time.
- Inhibition Activity Test of Compound on hERG Ion Channels The reagents are purchased from Sigma (St. Louis, MO) except NaOH and KOH for acid-base titration. Final concentrations of tested solutions are prepared on the testing day and dissolved in extracellular fluid. The extracellular fluid (mM) contains: NaCl, 137; KCl, 4; CaCl2, 1.8; MgCl2, 1; HEPES, 10; glucose 10; pH 7.4 (NaOH titration). All the test solutions and the control solutions contain 0.3% DMSO. Intracellular fluid (mM) contains: K Aspartate, 130; MgCl2, 5; EGTA 5; HEPES, 10; Tris-ATP 4; pH 7.2 (KOH titration).
- Binding Assay hERG: The purpose of the hERG binding assay is to evaluate the effects of test compounds on the voltage-dependent potassium channel encoded by the human ether go go-related gene (hERG) using a constitutively expressing CHO cell line on the Nanion Syncropatch 384PE automated patch clamp system.The assay was conducted as follows with all reagents used at room temperature unless otherwise stated.Reagent Preparations Include:1. Internal "IC700" solution used to perfuse the underside of chip (in mM), KF 130, KCl 20, MgCl2 1, EGTA 10 and HEPES 10, (all Sigma-Aldrich; pH 7.2-7.3 using 10 M KOH, 320 mOsm) and supplemented with 25 μM escin.2. External and cell buffer (in mM), NaCl 137, KCl 4, HEPES 10, D-glucose 10, CaCl2 2, MgCl2 1 (pH7.4, NaOH)3. NMDG "reference" buffer used to establish a stable baseline prior to the addition of test compounds, NaCl 80, KCl 4, CaCl2 2, MgCl2 1, NMDG Cl 60, D-Glucose monohydrate 5, HEPES 10 (pH7.4 NaOH 298 mOsm)4. Seal enhancer used to improve seal quality of cells, NaCl 80, KCl 3, CaCl2 10, HEPES 10, MgCl2 1 (pH7.4 NaOH)
- Inhibition Assay Stably expressing cell line (C6BU-1 cell transfected with human P2X3 receptor gene (GenBank accession number Y07683) was used. The cells were seeded in a 96-well microtiter plate at a concentration of 8000 cells/well and cultured in the medium (8.3% fetal bovine serum, 8.3% horse serum, 1% antibiotic and antifungal in DMEM) for one day at 37° C. under 5% carbon dioxide atmosphere. The medium was replaced with 4 μM Fluo-3-AM solution (20 mM HEPES, 137 mM NaCl, 2.7 mM KCl, 0.9 in M MgCl2, 5.0 mM CaCl2, 5.6 D-glucose, 2.5 mM probenecid, 1.0% BSA, and 0.08% Pluronic F-127, pH 7.5) and incubated at 37° C. under 5% dioxide carbon atmosphere for one hour. The plate was washed with washing buffer (20 mM HEPES, 137 mM NaCl, 2.7 mM KCl, 0.9 mM MgCl2, 5.0 mM CaCl2, 5.6 mM D-glucose, 2.5 mM probenecid, pH 7.5), and each well was added with 40 μL of this buffer. The plate was placed in High-Throughput Screening System FDSS 3000 (Hamamatsu Photonics K.K.). Measurement of fluorescence inte
- HTS identification of compounds inhibiting phosphomannose isomerase (PMI) via a fluorescence intensity assay using a high concentration of mannose 6-phosphate The purpose of this assay is to identify non-competititve inhibitors of human PMI. This is accomplished by using a G6PD- NADPH-coupled assay. In the assay PMI activity is detected through conversion of its product, fructose-6-phosphate, to glucose-6-phosphate catalyzed by phosphoglucose isomerase (PGI) and subsequent oxidation of glucose-6-phosphate to 6-phosphogluconolactone concomitant with NADP-to-NADPH conversion catalyzed by glucose-6-phosphate dehydrogenase (G6PDH). The NADPH is then detected via a resazurin-diaphorase fluorogenic reaction. This assay is performed in the presence of 10x-Km concentrations of the PMI substrate, mannose-6-phosphate, to help to ensure the identification of non-competitive inhibitors. 1) 9 uL of Substrate working solution was added to columns 3-24 of a Greiner 384-well black plate (cat # 784076) using a WellMate bulk dispenser (Matrix) 2) 9 ul of Substrate working solution without mannose-6-p was added to columns 1 and 2 (positive control) 3) Dose-response curves contained 10 concentrations of compounds obtained using 2-fold serial dilution. Compounds were serially diluted in 100% DMSO, and then diluted with water to 10% final DMSO concentration. 4) 2 uL compounds in 10% DMSO were transferred into columns 3-22. Columns 1-2 and 23-24 contained 4 uL of 10% DMSO. 5) 9 uL of Enzyme working solution was added to the whole plate using a Thermo Multidrop Combi dispenser. 6) Plates were incubated at room temperature for 30 min. 7) The plates were read on an Analyst plate reader (Molecular Devices), Ex544, Em590. 8) Data analysis was performed using CBIS software (ChemInnovations, Inc).
- In Vitro Pharmacology Inhibition Assay SERT assay (Compounds of Formula I): Test compounds (conc range), reference compound or vehicle control were incubated for 180 min at room temperature with CHO cells stably transfected with the human serotonin transporter (5×10³ cells/well) with 0.15 μM [3H] serotonin in the presence or absence of the test or reference compound in buffer containing (in mM); Tris/HCl (pH 7.4) (5), HEPES/Tris (7.5), NaCl (120), KCl (5.4), CaCl2 (1.2), MgSO4 (1.2), Glucose (5) and ascorbic acid (1). Following incubation, [3H] serotonin uptake was quantified by a standard scintillation counting method.
- Aromatase Inhibition Activity Assay This fluorescence-based assay measures the rate at which recombinant human aromatase (baculovirus/insect cell-expressed) converts the substrate 7-methoxy-trifluoromethylcoumarin (MFC) into a fluorescent product 7-ethynyl-trifluoromethylcoumarin (HFC; λex = 409 nm, λem = 530 nm) in a NADPH regenerating system. Briefly, concentrated stock solutions of test compounds were prepared in acetonitrile. Hundred microliters of samples containing serial dilutions of test compounds (dilution factor of 3 between samples) and cofactor mixture (0.4 U/mL glucose-6-phosphate dehydrogenase; 16.2 μm NADP+; 825 μm MgCl2; 825 μm glucose-6- phosphate; 50 μm citrate buffer, pH 7.5) was prepared in a 96-well plate. After incubating the plate for 10 min at 37 °C, 100 μL of an aromatase/P450 reductase/substrate solution (105 μg protein/mL enzyme; 50 μm MFC; 20 mm phosphatebuffer, pH 7.4) was added to each well. The plate was covered and incubated for 30 min at 37 °C. Seventy-five microliters of 0.5 m Tris base was then added to stop the reaction, and the fluorescence of the formed de-methylated MFC was measured with a plate reader (Spectra Max Gemini; Molecular Devices, Sunnyvale, CA, USA).
- Biological Assay A fluorescent imaging plate reader (FILEX/FLIPR station; Molecular Devices) was used to monitor intracellular calcium levels using the calcium-chelating dye Rim-4 (Molecular Probes). The excitation and emission wavelengths used to monitor fluorescence were 470-495 nm and 515-575 nm, respectively. Cells expressing purinergic receptors P2X3 (human) or P2X2/3 (human) were plated at a density of 15,000 cells/well in collagen-coated 384-well plates approximately 20 hours before beginning the assay. On the day of the assay, 20 μl of loading buffer (Hank's balanced salt solution, 20 mM HEPES, 0.5 mM CaCl2, 0.5 mM MgCl2, 0.1% BSA, 5 mM probenecid, 10 mM D-glucose monohydrate, 2 μM Fluo-4, and 5 units/mL, hexokinase, pH=7.4) was added and cells dye-loaded for 90 min at 37° C. The dye supernatant was removed and replaced with 45 μl probenecid buffer (Hank's balanced salt solution, 20 mM HEPES, 0.5 mM CaCl2, 0.5 mM MgCl2, 0.1% BSA, 5 mM probenecid, 10 mM D-glucose monohydrate, pH=7.4). The test compound was added in a volume of 5 μl and allowed to incubate for 30 min at 37° C.
- Ca2+ Flux Assay 1321N1 cells expressing the recombinant human or rat P2X7 channel was cultured in HyQ DME/(HyClone/Dulbecco's Modified Eagle Medium) high glucose supplemented with 10% Fetal Bovine Serum (FBS) and appropriate selection marker. Cells were seeded at a density of 25000 cells/well (96-well clear bottom black walled plates) in 100 μl volume/well. On the day of the experiment, cell plates were washed with assay buffer, containing (in mM): 130 NaCl, 2 KCl, 1 CaCl2, 1 MgCl2, 10 HEPES, 5 glucose; pH 7.40 and 300 mOs. After the wash, cells were loaded with the Calcium-4 dye (Molecular Device) and incubated in the dark for 60 minutes. Test compounds were prepared at 250× the test concentration in neat DMSO. Intermediate 96-well compound plates were prepared by transferring 1.2 μL of the compound into 300 μL of assay buffer. A further 3× dilution occurred when transferring 50 μL/well of the compound plate to 100 μL/well in the cell plate. Cells were incubated with test compounds and dye for 30 minutes. Calcium dye fluorescence was monitored in FLIPR as the cells were challenged by adding 50 μL/well of BzATP (final concentration is 250 μM BzATP (human and rat)).
- Calcium Flux Assay Compounds were tested in a calcium flux assay using transfected HEK293 cells stably expressing either human GPR40 or rat GPR40. Human GPR40 expressing cells were cultured in DMEM-High Glucose media supplemented with 10% fetal bovine serum, 1×L-Glutamine, 1× Penicillin/Streptomycin and 500 μg/mL G418. Rat GPR40 expressing cells were cultured in DMEM-High Glucose media supplemented with 10% fetal bovine serum and 1 μg/mL puromycin. Cells were plated into poly-D-lysine coated 384-well plates and cultured overnight in a 37° C. humidified tissue culture incubator under 5% CO2/90% O2 atmosphere. On the day of the experiment, the culture media was replaced with assay buffer (HBSS, 20 mM HEPES, 0.1% BSA) and the cells incubated at 37° C. for 1 h. Calcium-sensitive fluorescent dye (Fluo 8 No-Wash Calcium Dye, ABD Bioquest) was then added and the cells incubated for another 30 min at 37° C. followed by 15 min at room temperature while protected from the light. The cell plate and a plate of diluted compounds of Formula (I) were loaded into a fluorescent plate reader that added compounds onto the cells while measuring the fluorescence intensity of each well.
- Glycogen Synthase Activity Assay To a polystyrene 96-well plate, a solution containing 30 mM glycylglycine (pH 7.3), 40 mM KCl, 20 mM MgCl2, 9.2% DMSO containing one of the test compounds at various concentrations, and 10 mM glucose-6-phosphate (Sigma-Aldrich Corporation, G7879) was added by 12 uL/well. Next, a substrate solution containing 30 mM glycylglycine (pH 7.3), 4.3 mg/mL of glycogen (Sigma-Aldrich Corporation, G8876), 21.6 mM UDP-glucose (Sigma-Aldrich Corporation, U4625), 21.6 mM phosphoenolpyruvic acid (Sigma-Aldrich Corporation, P0564), and 4.05 mM NADH (Sigma-Aldrich Corporation, N8129) was added by 18 uL/well. Further, an enzyme solution containing 50 mM Tris-HCl (pH 8.0), 27 mM DTT (Nacalai Tesque, Inc., 14128-04), 0.2 mg/mL of bovine serum albumin, 0.17 mg/mL of the glycogen synthase, 1.5 uL of a pyruvate kinase/lactate dehydrogenase solution (Sigma-Aldrich Corporation, P0294) was added by 18 uL/well to prepare a reaction solution. After the reaction solution was incubated (at 30° C. for 25 minutes for Examples 1 to 10, at 37° C. for 20 minutes for Examples 11 to 75), the absorbance at 340 nm was measured using Benchmark Plus (Bio-Rad Laboratories, Inc.).
- Inhibition Test for Each Compound of the Present Invention Against 20-HETE Producing Enzymes (CYP4F2 and CYP4A11) In the CYP4F2 inhibition test, the reaction solution containing each compound [final concentration of 50 mM, KPO4 (pH 7.4), 2.5 μM luciferine derivative, and 1 mM NADPH] was added to an Escherichia coli membrane fraction (100 μg/mL protein) in which human CYP4F2 had been expressed. In the CYP4A11 inhibition test, the reaction solution containing each compound [final concentration of 100 mM, Tris-HCl (pH 7.5), 60 μM luciferine derivative, 1.3 mM NADP+, 3.3 mM Glucose 6-Phosphate, 3.3 mM MgCl2, and 0.4 U/mL Glucose 6-Phosphate dehydrogenase] was added to an Escherichia coli membrane fraction (100 μg/mL protein) in which human CYP4A11 had been expressed. Following this, the membrane fraction was left to stand at room temperature for 60 minutes to perform an enzymatic reaction. After the reaction, a luciferine detection reagent was added, and the luminescence value was measured using a plate reader. By using that value, the percent inhibition of 20-HETE producing enzyme (%) was calculated according to the equation described below, and the 50% inhibitory concentration (IC50 value) for each compound was calculated.
- High-Throughput Cav3.1 T-Type Fluorescent Assay Cells were plated in 384-well, clear-bottom, black-walled, poly-D-lysine coated plates (Becton Dickinson, Franklin Lake, N.J.) 2 days prior to use in the FLIPR assay. 100 μL of cells (2.0×10⁶ cell/mL) containing doxycyline (Sigma-Aldrich, 1.5 μg/mL; to induce channel expression) were added to each well using a Multidrop (Thermo Scientific, Waltham, Mass.) and were maintained in 5% CO2 incubator at 37° C. On the morning of the assay, cells were transferred to a 5% CO2 incubator at 29° C. Cells were washed with a wash buffer containing (in mM): 118 NaCl, 18.4 HEPES, 11.7 D-glucose, 0.05 CaCl2, 0.5 MgSO4, 1 KCl, and 1.2 KH2PO4, with the pH adjusted to 7.2 with NaOH. 4.4 μM of the fluorescent indicator dye, Fluo-4 (Invitrogen), prepared in pluronic acid (Sigma-Aldrich), were loaded into the wells and incubated for 45 minutes at 29° C. in 5% CO2. Cells were then rinsed with the following low Ca2+ buffer (in mM): 0.34 Na2HPO4, 4.2 NaHCO3, 0.44 KH2PO4, 0.41 MgSO4, 0.49 MgCl2-6H2O, 20 HEPES, 5.5 D-Glucose, 137 NaCl, 5.3 KCl, and 0.001 CaCl2, with 0.1% BSA and the pH adjusted to 7.2 with NaOH. Concentration-dependent response curves were generated from 5 mM stock solutions prepared in DMSO (Sigma-Aldrich) and diluted in the buffer containing low Ca2+ and incubated for 20 minutes at 29° C. in 5% CO2 Calcium entry was evoked with an addition of (in mM): 0.34 Na2HPO4, 4.2 NaHCO3, 0.44 KH2PO4, 0.41 MgSO4, 0.49 MgCl2-6H2O, 20 HEPES, 5.5 D-Glucose, 137 NaCl, 5.3 KCl, and 6 CaCl2, with 0.1% BSA and the pH adjusted to 7.2 with NaOH. A change in the Fluo-4 fluorescence signal was assessed using FLIPRTETRA instrument (Molecular Devices, Sunnyvale, Calif.) for 3 minutes following the elevation of extracellular KCl using an illumination wavelength of 470-495 nm with emissions recorded at 515-575 nm.
- P2X3 Inhibition Assay Stably expressing cell line (C6BU-1 cell transfected with human P2X3 receptor gene (GenBank accession number Y07683)) was used. The cells were seeded in a 96-well microtiter plate at a concentration of 8000 cells/well and cultured in the medium (8.3% fetal bovine serum, 8.3% horse serum, 1% antibiotic and antifungal in DMEM) for one day at 37° C. under 5% carbon dioxide atmosphere. The medium was replaced with 4 μM Fluo-3-AM solution (pH7.5) containing 20 mM HEPES, 137 mM NaCl, 2.7 mM KCl, 0.9 mM MgCl2, 5.0 mM CaCl2, 5.6 mM D-glucose, 2.5 mM probenecid, 10% BSA, and 0.08% Pluronic F-127, and incubated at 37° C. under 5% dioxide carbon atmosphere for one hour. The plate was washed with washing buffer (20 mM HEPES, 137 mM NaCl, 2.7 mM KCl, 0.9 mM MgCl2, 5.0 mM CaCl2, 5.6 mM D-glucose, 2.5 mM probenecid, pH7.5), and each well was added with 40 μL of this buffer. The plate was placed in High-Throughput Screening System FDSS 3000 (Hamamatsu Photonics K.K.). Measurement of fluorescence intensity by FDSS 3000 was started, and 40 μL of DMSO solutions containing different concentrations of the test compound as prepared by dilution with dilution buffer (20 mM HEPES, 137 mM NaCl, 2.7 mM KCl, 0.9 mM MgCl2, 5.0 mM CaCl2, 5.6 mM D-glucose, 2.5 mM probenecid, 0.1% Pluronic F-127, pH7.5) were dispensed to each well through the built-in automatic dispenser. Five minutes after, 40 nM ATP solution (50 μL) prepared by dilution with the dilution buffer was dispensed through the built-in automatic dispenser, and the measurement of fluorescence intensity was continued for 3 min. For each well, the specific maximum fluorescence intensity was calculated as the ratio of the maximum fluorescence intensity after addition of the ATP solution to the fluorescence intensity at the starting of the measurement.
- Receptor Inhibition Assay Stably expressing cell line (C6BU-1 cell transfected with human P2X3 receptor gene (GenBank accession number Y07683) was used. The cells were seeded in a 384-well PDL-coated microtiter plate at a concentration of 3000 cells/well and cultured in the medium (8.3% fetal bovine serum, 8.3% horse serum, and 1% antibiotic and antifungal in DMEM) for one day at 37° C. under 5% carbon dioxide atmosphere. The medium was replaced with 4 μM Fluo-3-AM solution (20 mM HEPES, 137 mM NaCl, 2.7 mM KCl, 0.9 mM MgCl2, 5.0 mM CaCl2, 5.6 mM D-glucose, 2.5 mM probenecid, 0.5% BSA, and 0.04% Pluronic P-127, pH 7.5) and incubated at 37° C. under 5% dioxide carbon atmosphere for one hour. The plate was washed with washing buffer (20 mM HEPES, 137 mM NaCl, 2.7 mM KCl, 0.9 mM MgCl2, 5.0 mM CaCl2, 5.6 mM D-glucose, 2.5 mM probenecid, pH 7.5), and each well was added with 20 μL of the washing buffer. The plate was placed in High-Throughput Screening System FLIPR 384 (Molecular Device Co.). Measurement of fluorescence intensity by FLIPR 884 was started, and 20 μL of DMSO solutions containing different concentrations of the test compound as prepared by dilution with dilution buffer (20 mM HEPES, 137 mM NaCl, 2.7 mM KCl, 0.9 mM MgCl2, 5.0 mM CaCl2, 5.6 mM D-glucose, 2.5 mM probenecid, 0.1% Pluronic F-127, pH 7.5) were dispensed to each well through the built-in automatic dispenser. Five minutes after, 150 nM ATP solution (25 μL) prepared by dilution with the dilution buffer was dispensed through the built-in automatic dispenser, and the measurement of fluorescence intensity was continued for 4 min. For each well, the specific maximum fluorescence intensity was calculated as the ratio of the maximum fluorescence intensity after addition of the ATP solution to the fluorescence intensity at the starting of the measurement.
- pAKT Protocol Inhibition of the PI3K-AKT-mTOR pathway was measured by quantifying the loss of (Ser-473) pAKT using AlphaScreen (Perkin Elmer). B103 (Rat Neuroblastoma) cells were seeded in serum containing medium (High Glucose DMEM (-Phenol Red)+10% FBS+2× Glutamax+1 mM Sodium Pyruvate+10 mM HEPES+1× Non-Essential Amino Acids+1× Pen/Strep) on a 96-well tissue culture treated plate and grown for 20 hours. Cells were then serum starved in serum free medium (High Glucose DMEM (-Phenol Red)+1× Glutamax+1 mM Sodium Pyruvate+1× Pen/Strep) for 6 hours prior to a 2-hour pretreatment with inhibitors of the pathway, including reference inhibitor LY294002. These inhibitors were prepared at a 200× final concentration as a 6-point, 1:3 serial dilution in DMSO series, with DMSO as the 7th point. The inhibitors were then diluted in experimental medium (High Glucose DMEM (-Phenol Red)+1× Glutamax+1 mM Sodium Pyruvate+1× Pen/Strep+25 mM HEPES+0.1% BSA) and combined with the cells at 1× final concentration in 0.5% DMSO. The cells were then stimulated for 20 minutes with (2.5 μg/mL) insulin, an activator of the PI3K-AKT-mTOR pathway and a demonstrated (Ser-473) pAKT agonist. Cells were promptly lysed using Perkin Elmer proprietary lysis buffer and the (Ser-473) pAKT and total AKT contained in the lysate was measured by AlphaScreen. In AlphaScreen, donor beads were coated with streptavidin to capture one of the antibodies, which is biotinylated. Acceptor beads were coated with Protein A to immobilize the other antibody. In the presence of target protein, the two antibodies bring the donor and acceptor beads close together, generating signal. The amount of light emission is directly proportional to the amount of target protein present in the sample. For each inhibitor tested: the ratio of measured (Ser-473) pAKT/totalAKT was plotted in GraphPad Prism as a 7-point, non-linear regression, 4-parameter curve with bottom constrained to reference control bottom and unconstrained top anchored to DMSO.
- Intracellular Ca2+ Mobilization Assay A monoclonal HEK-293 cell line stably transfected with a cDNA encoding for the human mGlu5a receptor was generated; for the work with mGlu5 Positive Allosteric Modulators (PAMs), a cell line with low receptor expression levels and low constitutive receptor activity was selected to allow the differentiation of agonistic versus PAM activity. Cells were cultured according to standard protocols (Freshney, 2000) in Dulbecco's Modified Eagle Medium with high glucose supplemented with 1 mM glutamine, 10% (vol/vol) heat-inactivated bovine calf serum, Penicillin/Streptomycin, 50 μg/ml hygromycin and 15 m/ml blasticidin (all cell culture reagents and antibiotics from Invitrogen, Basel, Switzerland).
- Ca2+ flux assay 1321N1 cells expressing the recombinant human, rat or mouse P2X7 channel was cultured in HyQ DME/(HyClone/Dulbecco's Modified Eagle Medium) high glucose supplemented with 10% Fetal Bovine Serum (FBS) and appropriate selection marker. Cells were seeded at a density of 25000 cells/well (96-well clear bottom black walled plates) in 100 μl volume/well. On the day of the experiment, cell plates were washed with assay buffer, containing (in mM): 130 NaCl, 2 KCl, 1 CaCl2, 1 MgCl2, 10 HEPES, 5 glucose; pH 7.40 and 300 mOs. After the wash, cells were loaded with the Calcium-4 dye (Molecular Device) and incubated in the dark for 60 minutes. Test compounds were prepared at 250× the test concentration in neat DMSO. Intermediate 96-well compound plates were prepared by transferring 1.2 μL of the compound into 300 μL of assay buffer. A further 3× dilution occurred when transferring 50 μL/well of the compound plate to 100 μL/well in the cell plate. Cells were incubated with test compounds and dye for 30 minutes. Calcium dye fluorescence was monitored in FLIPR as the cells were challenged by adding 50 μL/well of BzATP (final concentration is 250 μM BzATP (human and rat) or 600 μM (mouse)). The fluorescence change was measured 180 seconds after adding the agonist.
- Calcium Flux Assay Compounds were tested in a calcium flux assay using transfected HEK293 cells stably expressing either human GPR40 or rat GPR40. Human GPR40 expressing cells were cultured in DMEM-High Glucose media supplemented with 10% fetal bovine serum, 1×L-Glutamine, 1× Penicillin/Streptomycin and 500 μg/mL G418. Rat GPR40 expressing cells were cultured in DMEM-High Glucose media supplemented with 10% fetal bovine serum and 1 μg/mL puromycin. Cells were plated into poly-D-lysine coated 384-well plates and cultured overnight in a 37° C. humidified tissue culture incubator under 5% CO2/90% O2 atmosphere. On the day of the experiment, the culture media was replaced with assay buffer (HBSS, 20 mM HEPES, 0.1% BSA) and the cells incubated at 37° C. for 1 h. Calcium-sensitive fluorescent dye (Fluo 8 No-Wash Calcium Dye, ABD Bioquest) was then added and the cells incubated for another 30 min at 37° C. followed by 15 min at room temperature while protected from the light. The cell plate and a plate of diluted compounds of Formula (I) were loaded into a fluorescent plate reader that added compounds onto the cells while measuring the fluorescence intensity of each well. The plate reader recorded fluorescence intensity at 1 second intervals for 8 min and provided the data for analysis in an Excel format.
- FLIPR Assay 1321 N1 cells expressing the recombinant human, rat or mouse P2X7 channel was cultured in HyQ DME/(HyClone/Dulbecco's Modified Eagle Medium) high glucose supplemented with 10% Fetal Bovine Serum (FBS) and appropriate selection marker. Cells were seeded at a density of 25000 cells/well (96-well clear bottom black walled plates) in 100 ul volume/well. On the day of the experiment, cell plates were washed with assay buffer, containing (in mM): 130 NaCl, 2 KCl, 1 CaCl2, 1 MgCl2, 10 HEPES, 5 glucose; pH 7.40 and 300 mOs. After the wash, cells were loaded with the Calcium-4 dye (Molecular Device) and incubated in the dark for 60 minutes. Test compounds were prepared at 250 the test concentration in neat DMSO. Intermediate 96-well compound plates were prepared by transferring 1.2 uL of the compound into 300 uL of assay buffer. A further 3x dilution occurred when transferring 50 uL/well of the compound plate to 100 uL/well in the cell plate. Cells were incubate with test compounds and dye for 30 minutes. Calcium dye fluorescence was monitored in FLIPR as the cells were challenged by adding 50 uL/well of BzATP (final concentration is 250 uM BzATP (human and rat) or 600 (mouse)). The fluorescence change was measured 180 seconds after adding the agonist.
- In Vitro Assay In general, Trex HEK293 cells were stably transfected with an inducible expression vector containing the full-length cDNA coding for the desired human sodium channel α-subunit and with an expression vector containing full length cDNA coding for the β1-subunit. Sodium channel expressing cell lines were induced with tetracycline (1 μg/mL) and plated on 384-well PDL-coated plates at a density of 25K-30K cells/well in culture media (DMEM, containing 10% FBS and 1% L-glutamine). After overnight incubation (37° C., 5% CO2), culture media was removed and cells were loaded with 5 uM ANG2 dye for 1-1.5 h in Buffer 1 (155 mM NMDG, 5 mM KCl, 2 mM CaCl2, 1 mM MgCl2, 10 mM HEPES, 10 mM glucose, adjusted with Tris to pH 7.4). Access dye was removed and cells were incubated with test compounds for 1 hr in buffer 1 containing sodium channel modulator(s) at room temperature. Hamamatsu FDSS μCell was used to perform a 1:1 addition of Na/K challenge buffer (140 mM NaCl, 20 mM HEPES, 1 mM CaCl2, 15 mM KCl, 1 mM MgCl2, 10 mM glucose, adjusted with Tris to pH 7.4) and simultaneously read plates at excitation wavelength of 530 nm and emission wavelength set at 558 nm.
- Ca2+ Mobilization Assay A monoclonal HEK-293 cell line stably transfected with a cDNA encoding for the human mGlu4 receptor was generated; for the work with mGlu4 Positive Allosteric Modulators (PAMs), a cell line with low receptor expression levels and low constitutive receptor activity was selected to allow the differentiation of agonistic versus PAM activity. Cells were cultured according to standard protocols (Freshney, 2000) in Dulbecco's Modified Eagle Medium with high glucose supplemented with 1 mM glutamine, 10% (vol/vol) heat-inactivated bovine calf serum, Penicillin/Streptomycin, 50 μg/ml hygromycin and 15 μg/ml blasticidin (all cell culture reagents and antibiotics from Invitrogen, Basel, Switzerland). EC50 Values are determined.
- Ethidium Bromide Uptake Assay hP2X7-expressing HEK 293 cells were re-suspended at 2.5 × 10^6 cells/mL in assay buffer composed of 10 mM HEPES, 5 mM N-methyl-D-glutamine, 5.6 mM KCl, 10 mM D-glucose, and 0.5 mM CaCl2 (pH 7.4) supplemented with either 280 mM sucrose or 140 mM NaCl, and an 80 µL aliquot was added to each well of a 96-well plate. To each compound were added and KN-62 as the positive control, followed by the hP2X7R agonist benzoyl ATP (BzATP). The plates were incubated at 37 °C for 2 h and the cellular accumulation of ethidium ion was determined by measuring fluorescence (excitation = 530 nm; emission = 590 nm).
- Receptor Inhibition Assay Rat P2X3 receptor gene (GenBank accession number NM_031075) was expressed in C6BU-1 cell. The C6BU-1 cells were seeded in a 96-well microtiter plate at a concentration of 2500 cells/well and cultured in the medium (7.0% fetal bovine serum, 7.0% horse serum, and 1% antibiotic and antifungal in DMEM) for one day at 37° C. under 5% carbon dioxide atmosphere. The plasmid was transfected into the cells using transfection reagent FuGENE6 (Promega). The transfected cells were cultured in the medium for one day at 37° C. under 5% carbon dioxide atmosphere. The medium was replaced with 4 μM Fluo-3-AM solution (pH 7.5) containing 20 mM HEPES, 137 mM NaCl, 5.27 mM KCl, 0.9 mM MgCl2, 1.26 mM CaCl2, 5.6 mM D-glucose, 2.5 mM probenecid, 1% BSA, and 0.08% Pluronic F-127, and incubated at 37° C. under 5% dioxide carbon atmosphere for one hour. The plate was washed with washing buffer (20 mM HEPES, 137 mM NaCl, 5.27 mM KCl, 0.9 mM MgCl2, 1.26 mM CaCl2, 5.6 mM D-glucose, 2.5 mM probenecid, pH 7.5), and each well was added with 40 μL of this buffer. The plate was placed in High-Throughput Screening System FDSS 3000 (Hamamatsu Photonics K.K.). Measurement of fluorescence intensity by FDSS 3000 was started, and 40 μL of DMSO solutions containing different concentrations of the test compound as prepared by dilution with dilution buffer (20 mM HEPES, 137 mM 137 NaCl, 5.27 mM KCl, 0.9 mM MgCl2, 1.26 mM CaCl2, 5.6 mM D-glucose, 2.5 mM probenecid, 0.1% Pluronic F-127, pH 7.5) were dispensed to each well through the built-in automatic dispenser. Five minutes after, 50 nM ATP solution (50 μL) prepared by dilution with the dilution buffer was dispensed through the built-in automatic dispenser, and the measurement of fluorescence intensity was continued for 4 min. For each well, the specific maximum fluorescence intensity was calculated as the ratio of the maximum fluorescence intensity after addition of the ATP solution to the fluorescence intensity at the starting of the measurement.
- Receptor Inhibition Assay Stably expressing cell line (C6BU-1 cell transfected with human P2X3 receptor gene (GenBank accession number Y07683) was used. The cells were seeded in a 384-well microtiter plate at a concentration of 3000 cells/well and cultured in the medium (7.0% fetal bovine serum, 7.0% horse serum, 1% antibiotic and antifungal in DMEM) for one day at 37° C. under 5% carbon dioxide atmosphere. The medium was replaced with 4 μM Fluo-3-AM solution (20 mM HEPES, 1.37 mM NaCl, 5.27 mM KCl, 0.9 mM MgCl2, 1.26 mM CaCl2, 5.6 mM D-glucose, 2.5 mM probenecid, 0.5% BSA, and 0.04% Pluronic F-127, pH 7.5) and incubated at 37° C. under 5% dioxide carbon atmosphere for one hour. The plate was washed with washing buffer (20 mM HEPES, 137 mM NaCl, 5.27 mM KCl, 0.9 mM MgCl2, 1.26 mM CaCl2, 5.6 mM D-glucose, 2.5 mM probenecid, pH7.5), and each well was added with 20 μL of this buffer. The plate was placed in High-Throughput Screening System FLIPR 384 (Molecular Device Co.). Measurement of fluorescence intensity by FLIPR 384 was started, and 20 μL of DMSO solutions containing different concentrations of the test compound as prepared by dilution with dilution buffer (20 mM HEPES, 137 mM NaCl, 5.27 mM KCl, 0.9 mM MgCl2, 1.26 mM CaCl2, 5.6 mM D-glucose, 2.5 mM probenecid, 0.1% Pluronic F-127, pH 7.5) were dispensed to each well through the built-in automatic dispenser. Five minutes after, 150 nM ATP solution (25 μL) prepared by dilution with the dilution buffer was dispensed through the built-in automatic dispenser, and the measurement of fluorescence intensity was continued for 4 min. For each well, the specific maximum fluorescence intensity was calculated as the ratio of the maximum fluorescence intensity after addition of the ATP solution to the fluorescence intensity at the starting of the measurement. The 50% inhibitory concentration (IC50) was calculated under the assumption that the specific maximum fluorescence intensity without test compound is 0% inhibition and that the specific maximum fluorescence intensity when the dilution buffer was added in place of ATP solution is 100% inhibition, to evaluate the inhibitory activity of the test compound.
- CYP17 Inhibition Assay A solution of 6.25 nmol of progesterone (in 5 μl of MeOH) was dissolved in 140 μl of phosphate buffer (0.05 M; pH 7.4; 1 mM MgCl2; 0.1 mM EDTA and 0.1 mM DTT) and preincubated for 5 min at 37 °C. together with 50 μl of NADPH-regenerating system (phosphate buffer with 10 mM NADP®, 100 mM glucose-6-phosphate and 2,5 units of glucose-6-phosphate dehydrogenase) and inhibitor (in 5 μl of DMSO). Control incubations were performed in parallel with 5 μl DMSO without inhibitor. The reaction was started by adding 50 μl of a membrane suspension diluted 1 to 5 in phosphate buffer (0.8 to 1 mg of protein per ml). After thoroughly mixing the components, the mixture was incubated at 37 °C. for 30 min. The reaction was quenched by adding 50 μl of 1 N HCl. The steroids were extracted with 1 ml of EtOAc. After a centrifugation step (5 min at 2,500 g), 900 μl of the organic phase was transferred into an Eppendorf vessel with 250 μl of the incubation buffer and 50 μl of 1 N HCl and again shaken. After the centrifugation, 800 μl of the organic phase was removed, placed into a new vessel and evaporated to dryness. The samples were dissolved in 50 μl of a water-methanol mixture (1:1) and analyzed by HPLC.
- Ca2+ Flux assay 1321N1 cells expressing the recombinant human or rat P2X7 channel was cultured in HyQ DME/(HyClone/Dulbecco's Modified Eagle Medium) high glucose supplemented with 10% Fetal Bovine Serum (FBS) and appropriate selection marker. Cells were seeded at a density of 25000 cells/well (96-well clear bottom black walled plates) in 100 μl volume/well. On the day of the experiment, cell plates were washed with assay buffer, containing (in mM): 130NaCl, 2KCl, 1CaCl2, 1MgCl2, 10 HEPES, 5 glucose; pH 7.40 and 300 mOs. After the wash, cells were loaded with the Calcium-4 dye (Molecular Device) and incubated in the dark for 60 minutes. Test compounds were prepared at 250× the test concentration in neat DMSO. Intermediate 96-well compound plates were prepared by transferring 1.2 μL of the compound into 300 μL of assay buffer. A further 3× dilution occurred when transferring 50 μL/well of the compound plate to 100 μL/well in the cell plate. Cells were incubated with test compounds and dye for 30 minutes. Calcium dye fluorescence was monitored in FLIPR as the cells were challenged by adding 50 μL/well of BzATP (final concentration is 250 μM BzATP (human and rat)). The fluorescence change was measured 180 seconds after adding the agonist. Peak fluorescence was plotted as a function of BzATP concentration using Origin 7 software.
- Ca2+ flux assay 1321N1 cells expressing the recombinant human or rat P2X7 channel was cultured in HyQ DME/(HyClone/Dulbecco's Modified Eagle Medium) high glucose supplemented with 10% Fetal Bovine Serum (FBS) and appropriate selection marker. Cells were seeded at a density of 25000 cells/well (96-well clear bottom black walled plates) in 100 μl volume/well. On the day of the experiment, cell plates were washed with assay buffer, containing (in mM): 130 NaCl, 2 KCl, 1 CaCl2, 1 MgCl2, 10 HEPES, 5 glucose; pH 7.40 and 300 mOs. After the wash, cells were loaded with the Calcium-4 dye (Molecular Device) and incubated in the dark for 60 minutes. Test compounds were prepared at 250× the test concentration in neat DMSO. Intermediate 96-well compound plates were prepared by transferring 1.2 μL of the compound into 300 μL of assay buffer. A further 3× dilution occurred when transferring 50 μL/well of the compound plate to 100 μL/well in the cell plate. Cells were incubated with test compounds and dye for 30 minutes. Calcium dye fluorescence was monitored in FLIPR as the cells were challenged by adding 50 μL/well of BzATP (final concentration is 250 μM BzATP (human and rat)). The fluorescence change was measured 180 seconds after adding the agonist. Peak fluorescence was plotted as a function of BzATP concentration using Origin 7 software.
- FLIPR Ca2+ Flux Assay 1321N1 cells expressing the recombinant human, rat or mouse P2X7 channel was cultured in HyQ DME/(HyClone/Dulbecco's Modified Eagle Medium) high glucose supplemented with 10% Fetal Bovine Serum (FBS) and appropriate selection marker. Cells were seeded at a density of 25000 cells/well (96-well clear bottom black walled plates) in 100 μl volume/well. On the day of the experiment, cell plates were washed with assay buffer, containing (in mM): 130 NaCl, 2 KCl, 1 CaCl2, 1 MgCl2, 10 HEPES, 5 glucose; pH 7.40 and 300 mOs. After the wash, cells were loaded with the Calcium-4 dye (Molecular Device) and incubated in the dark for 60 minutes. Test compounds were prepared at 250× the test concentration in neat DMSO. Intermediate 96-well compound plates were prepared by transferring 1.2 μL of the compound into 300 μL of assay buffer. A further 3× dilution occurred when transferring 50 μL/well of the compound plate to 100 μL/well in the cell plate. Cells were incubated with test compounds and dye for 30 minutes. Calcium dye fluorescence was monitored in FLIPR as the cells were challenged by adding 50 μL/well of BzATP (final concentration is 250 μM BzATP (human and rat) or 600 μM (mouse)). The fluorescence change was measured 180 seconds after adding the agonist. Peak fluorescence was plotted as a function of test concentration.
- GPR40 Calcium Flux Assay Compounds were tested in a calcium flux assay using transfected HEK293 cells stably expressing either human GPR40 or rat GPR40. Human GPR40 expressing cells were cultured in DMEM-High Glucose media supplemented with 10% fetal bovine serum, 1×L-Glutamine, 1×Penicillin/Streptomycin and 500 μg/mL G418. Rat GPR40 expressing cells were cultured in DMEM-High Glucose media supplemented with 10% fetal bovine serum and 1 μg/mL puromycin. Cells were plated into poly-D-lysine coated 384-well plates and cultured overnight in a 37° C. humidified tissue culture incubator under 5% CO2/90% O2 atmosphere. On the day of the experiment, the culture media was replaced with assay buffer (HBSS, 20 mM HEPES, 0.1% BSA) and the cells incubated at 37° C. for 1 h. Calcium-sensitive fluorescent dye (Fluo 8 No-Wash Calcium Dye, ABD Bioquest) was then added and the cells incubated for another 30 min at 37° C. followed by 15 min at room temperature while protected from the light. The cell plate and a plate of diluted compounds of Formula (I) were loaded into a fluorescent plate reader that added compounds onto the cells while measuring the fluorescence intensity of each well. The plate reader recorded fluorescence intensity at 1 second intervals for 8 min and provided the data for analysis in an Excel format. EC50 values were calculated using Prism (GraphPad) software.
- In Vitro Assay GPR40 Calcium Flux Assay Compounds were tested in a calcium flux assay using transfected HEK293 cells stably expressing either human GPR40 or rat GPR40. Human GPR40 expressing cells were cultured in DMEM-High Glucose media supplemented with 10% fetal bovine serum, 1× L-Glutamine, 1× Penicillin/Streptomycin and 500 μg/mL G418. Rat GPR40 expressing cells were cultured in DMEM-High Glucose media supplemented with 10% fetal bovine serum and 1 μg/mL puromycin. Cells were plated into poly-D-lysine coated 384-well plates and cultured overnight in a 37° C. humidified tissue culture incubator under 5% CO2/90% O2 atmosphere. On the day of the experiment, the culture media was replaced with assay buffer (HBSS, 20 mM HEPES, 0.1% BSA) and the cells incubated at 37° C. for 1 h. Calcium-sensitive fluorescent dye (Fluo 8 No-Wash Calcium Dye, ABD Bioquest) was then added and the cells incubated for another 30 min at 37° C. followed by 15 min at room temperature while protected from the light. The cell plate and a plate of diluted compounds of Formula (I) were loaded into a fluorescent plate reader that added compounds onto the cells while measuring the fluorescence intensity of each well. The plate reader recorded fluorescence intensity at 1 second intervals for 8 min and provided the data for analysis in an Excel format. EC50 values were calculated using Prism (GraphPad) software.
- In Vitro Assay In general, Trex HEK293 cells were stably transfected with an inducible expression vector containing the full-length cDNA coding for the desired human sodium channel α-subunit and with an expression vector containing full length cDNA coding for the β1-subunit. Sodium channel expressing cell lines were induced with tetracycline (1 μg/mL) and plated on 384-well PDL-coated plates at a density of 25K-30K cells/well in culture media (DMEM, containing 10% FBS and 1% L-glutamine). After overnight incubation (37° C., 5% CO2), culture media was removed and cells were loaded with 5 uM ANG2 dye for 1-1.5 h in Buffer 1 (155 mM NMDG, 5 mM KCl, 2 mM CaCl2, 1 mM MgCl2, 10 mM HEPES, 10 mM glucose, adjusted with Tris to pH 7.4). Access dye was removed and cells were incubated with test compounds for 1 hr in buffer 1 containing sodium channel modulator(s) at room temperature. Hamamatsu FDSS μCell was used to perform a 1:1 addition of Na/K challenge buffer (140 mM NaCl, 20 mM HEPES, 1 mM CaCl2, 15 mM KCl, 1 mM MgCl2, 10 mM glucose, adjusted with Tris to pH 7.4) and simultaneously read plates at excitation wavelength of 530 nm and emission wavelength set at 558 nm. Percent inhibition of sodium ion influx was calculated for each test compound at each test concentration to determine the IC50 values.
- P2X7 FLIPR Assay 1321N1 cells expressing the recombinant human or rat P2X7 channel was cultured in HyQ DME/(HyClone/Dulbecco's Modified Eagle Medium) high glucose supplemented with 10% Fetal Bovine Serum (FBS) and appropriate selection marker. Cells were seeded at a density of 25000 cells/well (96-well clear bottom black walled plates) in 100 μl volume/well. On the day of the experiment, cell plates were washed with assay buffer, containing (in mM): 130 NaCl, 2 KCl, 1 CaCl2, 1 MgCl2, 10 HEPES, 5 glucose; pH 7.40 and 300 mOs. After the wash, cells were loaded with the Calcium-4 dye (Molecular Device) and incubated in the dark for 60 minutes. Test compounds were prepared at 250× the test concentration in neat DMSO. Intermediate 96-well compound plates were prepared by transferring 1.2 μL of the compound into 300 μL of assay buffer. A further 3× dilution occurred when transferring 50 μL/well of the compound plate to 100 μL/well in the cell plate. Cells were incubated with test compounds and dye for 30 minutes. Calcium dye fluorescence was monitored in FLIPR as the cells were challenged by adding 50 μL/well of BzATP (final concentration is 250 μM BzATP (human and rat)). The fluorescence change was measured 180 seconds after adding the agonist. Peak fluorescence was plotted as a function of BzATP concentration using Origin 7 software.
- hERG Assay Experiments were performed on the SyncroPatch 384PE (Nanion Technologies) high throughput patch clamp platform at rt and used medium resistance chips with 4 patch holes per site. hERG-expressing Chinese hamster ovary K1 (CHO) cell line were used in assay-ready format and kept in liquid nitrogen until use. 2 vials of cells (10×106 cells per vial) were thawed and added to 20 mL Hepes-buffered saline solution (HBSS). HBSS comprised 140 mM NaCl, 4 mM KCl, 10 mM HEPES and 5 mM Glucose (pH 7.4). The internal patch clamp solution was KF 120 mM, KCl 20 mM, HEPES 10 mM, EGTA 10 mM, and 25 μM Escin (pH7.2). After the initial sealing process was complete, a seal enhancer solution comprising HBSS supplemented with 10 mM CaCl2 and 1 mM MgCl2 was applied to cells. The external solution was then exchanged (4 times) for external patch clamp solution comprising NaCl 80 mM, KCl 4 mM, HEPES 10 mM, CaCl2 2 mM, MgCl2 1 mM, glucose 5 mM, and NMDG 60 mM (pH 7.4). All solutions were stored at rt, except Escin, which was stored at 4° C. All compounds were dispensed in greiner-bio 384 well plates and tested in a 6 point cumulative assay (final DMSO concentration 0.33%). Only wells that passed acceptance criteria (30 MegaOhm seal resistance, Z prime >0.4 and current size >0.2 nA) were used in this analysis.
- Electrophysiological Assay (EP) (In Vitro Assay) The following voltage clamp electrophysiology studies are performed on representative compounds using cells heterologously expressing Nav1.7 or Nav1.5 channels. cDNAsfor Nav1.7 (NM_002977) and Nav1.5 (AC137587) are stably expressed in Chinese Hamstr Ovary (CHO) cells and CHL (Chinese Hamster Lung) cells respectively. Sodium currents are measured in the whole-cell configuration using Syncropatch 384PE (Nanlon Technologies, Germany). 1NPC -384 chips with custom medium resistance and single hole mode are used. Internal solution consists of (in mM): 110 CsCl, 10 CsCl, 20 EGTA, and 10 Hepes (pH adjusted to 7.2); and external solution contains (in mM): 60 NMDG, 80 NaCl, 4 KCl, 1 MgCl2, 2 CaCl2, 2 D-Glucose monohydrate, 10 Hepes (pH adjusted to 7.4 with NaOH).
- Enzymatic Assay Protein concentration was determined using BCA assay kit. Sixty micrograms of MDCK cell lysate was incubated with various concentrations of a compound described herein from 0.001 μM−10 μM, respectively, or as indicated in Table 2, in 100 mM Tris buffer (pH 7.5) containing 10 mM MgCl2, 1 mM dithiothreitol, 1 mM EGTA, 2 mM NAD, 100 μM UDP-glucose, 10 μM C6-NBD-Ceramide (Matreya LLC, Pleasant Gap, Pa.), 35 μM dioleoylphosphatidylcholine and 5 μM sulfatide (Sigma) in a final reaction volume of 100 μL at 37° C. for 1 hour. 0.1% DMSO was used as mock treatment or control. The reaction was terminated by adding 100 μL acetonitrile solution and subjected to LC/MS analysis.
- Enzyme Activity Assay Activity of GBA was measured at 37° C. with 4-methylumbelliferyl β-D-glucopyranoside as substrate as reported previously. To determine the IC50 value, the inhibitors were preincubated for 30 min with the enzyme before addition of the substrate mixture. The incubation mixture contained 3 mM fluorogenic substrate, 0.2% (w/v) sodium taurocholate and 0.1% (v/v) Triton X-100 in 150 mM McIlvaine buffer, pH 5.2. After stopping the incubation with excess NaOH-glycine (pH 10.3), we measured fluorescence with a fluorimeter LS 30 (Perkin Elmer) using λex 366 nm and λem 445 nm. Activity of lactase was quantified by measuring liberated glucose from lactase38. In vivo activity of GBA in cells was measured using FDG as substrate and FACS32.
- FLIPR Assay Assay Buffer: The assay buffer was formulated by removing 120 mL from a 1 L bottle of fresh, sterile dH2O (Mediatech, Herndon, Va.) and adding 100 mL of 10× HBSS that does not contain Ca++ or Mg++ (Gibco, Invitrogen, Grand Island, N.Y.) followed by 20 mL of 1.0 M Hepes, pH 7.3 (Fisher Scientific, BP299-100). The final buffer consisted of 20 mM Hepes, pH 7.3, 1.261 mM CaCl2, 0.493 mM MgCl2, 0.407 mM Mg(SO)4, 5.33 mM KCl, 0.441 mM KH2PO4, 137 mM NaCl, 0.336 mM Na2HPO4 and 0.556 mM D-glucose (Hanks et al., Proc. Soc. Exp. Biol. Med. 71:196 (1949)), and the simple formulation was typically the basic buffer throughout the assay (i.e., all wash and addition steps).
- FLIPR Assay Assay Buffer: The assay buffer was formulated by removing 120 mL from a 1 L bottle of fresh, sterile dH2O (Mediatech, Herndon, Va.) and adding 100 mL of 10×HBSS that does not contain Ca++ or Mg++ (Gibco, Invitrogen, Grand Island, N.Y.) followed by 20 mL of 1.0 M Hepes, pH 7.3 (Fisher Scientific, BP299-100). The final buffer consisted of 20 mM Hepes, pH 7.3, 1.261 mM CaCl2, 0.493 mM MgCl2, 0.407 mM Mg(SO)4, 5.33 mM KCl, 0.441 mM KH2PO4, 137 mM NaCl, 0.336 mM Na2HPO4 and 0.556 mM D-glucose (Hanks et al., Proc. Soc. Exp. Biol. Med. 71:196 (1949)), and the simple formulation was typically the basic buffer throughout the assay (i.e., all wash and addition steps).
- FLIPR Assay Assay Buffer: The assay buffer was formulated by removing 120 mL from a 1 L bottle of fresh, sterile dH2O (Mediatech, Herndon, Va.) and adding 100 mL of 10×HBSS that does not contain Ca++ or Mg++ (Gibco, Invitrogen, Grand Island, N.Y.) followed by 20 mL of 1.0 M Hepes, pH 7.3 (Fisher Scientific, BP299-100). The final buffer consisted of 20 mM Hepes, pH 7.3, 1.261 mM CaCl2, 0.493 mM MgCl2, 0.407 mM Mg(SO)4. 5.33 mM KC, 0.441 mM KH2PO4. 137 mM NaCl, 0.336 mM Na2HPO4 and 0.556 mM D-glucose (Hanks et al., Proc. Soc. Exp. Biol. Med. 71:196 (1949)), and the simple formulation was typically the basic buffer throughout the assay (i.e., all wash and addition steps).
- FLIPR Assay The assay buffer was formulated by removing 120 mL from a 1 L bottle of fresh, sterile dH2O (Mediatech, Herndon, Va.) and adding 100 mL of 10xHBSS that does not contain Ca++ or Mg++ (Gibco, Invitrogen, Grand Island, N.Y.) followed by 20 mL of 1.0 M Hepes, pH 7.3 (Fisher Scientific, BP299-100). The final buffer consisted of 20 mM Hepes, pH 7.3, 1.261 mM CaCl2, 0.493 mM MgCl2, 0.407 mM Mg(SO)4, 5.33 mM KCl, 0.441 mM KH2PO4, 137 mM NaCl, 0.336 mM Na2HPO4 and 0.556 mM D-glucose (flanks et al., Proc. Soc. Exp. Biol. Med. 71:196 (1949)), and the simple formulation was typically the basic buffer throughout the assay (i.e., all wash and addition steps).
- FLIPR Assay The assay buffer was formulated by removing 120 mL from a 1 L bottle of fresh, sterile dH2O (Mediatech, Herndon, Va.) and adding 100 mL of 10×HBSS that does not contain Ca++ or Mg++ (Gibco, Invitrogen, Grand Island, N.Y.) followed by 20 mL of 1.0 M Hepes, pH 7.3 (Fisher Scientific, BP299-100). The final buffer consisted of 20 mM Hepes, pH 7.3, 1.261 mM CaCl2, 0.493 mM MgCl2, 0.407 mM Mg(SO)4, 5.33 mM KCl, 0.441 mM KH2PO4, 137 mM NaCl, 0.336 mM Na2HPO4 and 0.556 mM D-glucose (Hanks et al., Proc. Soc. Exp. Biol. Med. 71:196 (1949)), and the simple formulation was typically the basic buffer throughout the assay (i.e., all wash and addition steps).
- FLIPR Assays The assay buffer was formulated by removing 120 mL from a 1 L bottle of fresh, sterile dH2O (Mediatech, Herndon, Va.) and adding 100 mL of 10× HBSS that does not contain Ca++ or Mg++ (Gibco, Invitrogen, Grand Island, N.Y.) followed by 20 mL of 1.0 M Hepes, pH 7.3 (Fisher Scientific, BP299-100). The final buffer consisted of 20 mM Hepes, pH 7.3, 1.261 mM CaCl2, 0.493 mM MgCl2, 0.407 mM Mg(SO)4, 5.33 mM KCl, 0.441 mM KH2PO4, 137 mM NaCl, 0.336 mM Na2HPO4 and 0.556 mM D-glucose (Hanks et al., Proc. Soc. Exp. Biol. Med. 71:196 (1949)), and the simple formulation was typically the basic buffer throughout the assay (i.e., all wash and addition steps).
- FLIPR Assays The assay buffer was formulated by removing 120 mL from a 1 L bottle of fresh, sterile dH2O (Mediatech, Herndon, Va.) and adding 100 mL of 10×HBSS that does not contain Ca++ or Mg++ (Gibco, Invitrogen, Grand Island, N.Y.) followed by 20 mL of 1.0 M Hepes, pH 7.3 (Fisher Scientific, BP299-100). The final buffer consisted of 20 mM Hepes, pH 7.3, 1.261 mM CaCl2, 0.493 mM MgCl2, 0.407 mM Mg(SO)4, 5.33 mM KCl, 0.441 mM KH2PO4, 137 mM NaCl, 0.336 mM Na2HPO4 and 0.556 mM D-glucose (Hanks et al., Proc. Soc. Exp. Biol. Med. 71:196 (1949)), and the simple formulation was typically the basic buffer throughout the assay (i.e., all wash and addition steps).
- In Vitro Assay The assay buffer was formulated by removing 120 mL from a 1 L bottle of fresh, sterile dH2O (Mediatech, Herndon, Va.) and adding 100 mL of 10×HBSS that does not contain Ca++ or Mg++ (Gibco, Invitrogen, Grand Island, N.Y.) followed by 20 mL of 1.0 M Hepes, pH 7.3 (Fisher Scientific, BP299-100). The final buffer consisted of 20 mM Hepes, pH 7.3, 1.261 mM CaCl2, 0.493 mM MgCl2, 0.407 mM Mg(SO)4, 5.33 mM KCl, 0.441 mM KH2PO4, 137 mM NaCl, 0.336 mM Na2HPO4 and 0.556 mM D-glucose (Hanks et al., Proc. Soc. Exp. Biol. Med. 71:196 (1949)), and the simple formulation was typically the basic buffer throughout the assay (i.e., all wash and addition steps).
- Uptake Assays The uptake assays were carried out 2 days after transfection. Prior to the experiment, the cells were washed once in 500 ul of uptake buffer (25 mM 4-(2-hydroxyethyl)-1-piperazineethanesulfonic acid (HEPES), 130 mM NaCl, 5.4 mM KCl, 1.2 mM CaCl2, 1.2 mM MgSO4, 1 mM L-ascorbic acid, 5 mM D-glucose, and 1 uM of the catechol-O-methyltransferase inhibitor Ro 41-0960 (Sigma), pH 7.4) at room temperature (RT). The unlabeled ligand (e.g. modafinil [(+-)-1] or analogues) was added to the cells in 10 concentrations from 1 nM to 0.1 mM equally distributed around the expected IC50 value, and uptake was initiated by addition of 10 nM radioligand in a final volume of 500 uL.
- hERG assay The inhibition of activity of hERG (human ether-a-go-go related gene) potassium channel by the compounds was evaluated by using an automatic whole-cell patch clamp system (QPatch 48 HT, Sophion Bioscience) that can directly measure the flow of ions through the potassium channel in cells. A CHO-K1 cell line stably expressing human hERG cDNA (Kv11.1, KCNH2) was used. The composition of the intracellular solution (mM) used for the analysis is 70 KF, 60 KCl, 15 NaCl, 5 HEPES, 5 EGTA, 5 MgATP, pH 7.3 by KOH. The composition of the extracellular solution (mM) used for the analysis is 137 NaCl, 4 KCl, 1 MgCl,1.8 CaCl2), 10 HEPES, 10 glucose, pH 7.35 by NaOH.
- Agonistic Activity Assay 293E cells (EBNA1-expressing IIEK293 cells, ATCC No. CRL-10852) were cultured in DMEM (1.0 g/ml Glucose-containing Dulbecco's modified Eagle medium, Nacalai Tesque) containing 10% bovine fetal serum in the presence of 250 ug/ml of G418. The cells were seeded on a 10 cm-diameter petri dish at 1.8 106 cells/15 ml, and left to stand in a CO2 incubator (5% CO2, 37° C.) for 24 hours. Thereafter, human CaSR expression plasmid hCaSR/pcDNA3.1 was transfected with transfection reagent Mirus Trans IT 293 (Takara Bio). Following static culture in a CO2 incubator for 24 hours, the cells were harvested with 10% bovine fetal serum-containing DMEM and seeded on a poly-D-lysine coat 384 well plate (Falcon) at 15,000 cells/well. Following static culture in a CO2 incubator for 24 hours, the medium was removed and the resultant was added with 50 ul/well of Ca2+ fluorescent indicator Calcium 4 Assay Kit (Molecular Devices) dissolved in an assay buffer (146 mM NaCl, 5 mM KCl, 1 mM MgSO4, 1 mg/ml Glucose, 20 mM HEPES (PH 7.2), 1.5 mM CaCl2), and left to stand at 37° C. for an hour and then at room temperature for 30 minutes to allow intake of the indicator. The above-mentioned 384-well plate was transferred to FLIPR (Molecular Devices) and added with 12.5 ul/well of a compound dissolved in a 0.1% BSA-containing assay buffer to measure 3-minute change in the fluorescence intensity.
- Binding Assay hERG (human ether go go-related gene) potassium channels are essential for normal electrical activity in the heart. Arrhythmia can be induced by a blockage of hERG channels by a diverse group of drugs. This side effect is a common reason for drug failure in preclinical safety trials and therefore minimisation of hERG channel blocking activity may be a desirable property for drug candidates.The purpose of the hERG binding assay is to evaluate the effects of test compounds on the voltage-dependent potassium channel encoded by the human ether go go-related gene (hERG) using a constitutively expressing CHO cell line on the Nanion Syncropatch 384PE automated patch clamp system.The assay was conducted as follows with all reagents used at room temperature unless otherwise stated.Reagent Preparations Include:1. Internal IC700 solution used to perfuse the underside of chip (in mM), KF 130, KCl 20, MgCl2 1, EGTA 10 and HEPES 10, (all Sigma-Aldrich; pH 7.2-7.3 using 10 M KOH, 320 mOsm) and supplemented with 25 □M escin.2. External and cell buffer (in mM), NaCl 137, KCl 4, HEPES 10, D-glucose 10, CaCl2 2, MgCl2 1 (pH7.4, NaOH)3. NMDG reference buffer used to establish a stable baseline prior to the addition of test compounds, NaCl 80, KCl 4, CaCl2 2, MgCl2 1, NMDG Cl 60, D-Glucose monohydrate 5, HEPES 10 (pH7.4 NaOH 298 mOsm)4. Seal enhancer used to improve seal quality of cells, NaCl 80, KCl 3, CaCl2 10, HEPES 10, MgCl2 1 (pH7.4 NaOH)
- Human P2X3 Receptor Inhibition Assay Stably expressing cell line (C6BU-1 transfected with human P2X3 receptor gene (GenBank accession number Y07683) was used. The cells were seeded in a 96-well microtiter plate at a concentration of 8000 cells/well and cultured in the medium (8.3% fetal bovine serum, 8.3% horse serum, 1% antibiotic and antifungal in DMEM) for one day at 37° C. under 5% carbon dioxide atmosphere. The medium was replaced with 4 μM Fluo-3-AM solution (20 mM HEPES, 137 mM NaCl, 2.7 mM KCl, 0.9 mM MgCl2, 5.0 mM CaCl2, 5.6 mM D-glucose, 2.5 mM probenecid, 10% BSA, and 0.08% Pluronic F-127, pH 7.5) and incubated at 37° C. under 5% dioxide carbon atmosphere for one hour. The plate was washed with washing buffer (20 mM HEPES, 137 mM NaCl, 2.7 KCl, 0.9 mM MgCl2, 5.0 mM CaCl2, 5.6 mM D-glucose, 2.5 mM probenecid, pH 7.5), each well was added with 40 μL of this buffer. The plate was placed in High-Throughput Screening System FDSS 3000 (Hamamatsu Photonics K.K.). Measurement of fluorescence intensity by FDSS 3000 was started, and 40 μl, of DMSO solutions containing different concentrations of the test, compound as prepared by dilution with dilution buffer (20 mM HEPES, 137 mM NaCl, 2.7 mM KCl, 0.9 mM MgCl2, 5.0 mM CaCl2, 5.6 mM D-glucose, 2.5 mM probenecid, 0.1.% Pluronic F-127, pH 7.5) were dispensed to each well through the built-in automatic dispenser. Five minutes after, 50 nM ATP solution (50 μL) prepared by dilution with the dilution buffer was dispensed through the built-in automatic dispenser, and the measurement of fluorescence intensity was continued for 3 min. For each well, the specific maximum fluorescence intensity was calculated as the ratio of the maximum fluorescence intensity after addition of the ATP solution to the fluorescence intensity at the starting of the measurement. The 50% inhibitory concentration (IC50) was calculated under the assumption that the specific maximum fluorescence intensity without test compound is 0% inhibition and that the specific maximum fluorescence intensity when the dilution buffer was added in place of ATP solution is 100% inhibition, to evaluate the inhibitory activity of the test compound. FDSS software (Hamamatsu Photonics K.K.) was used for calculation of the specific maximum fluorescence intensity. IC50 was calculated using Microsoft Excel (Microsoft Corporation) and Ltd.).
- Humna P2X3 Binding Assay Stably expressing cell line (C6BU-1 cell transfected with human P2X3 receptor gene (GenBank accession number Y07683) was used. The cells were seeded in a 384-well PDL-coated microtiter plate at a concentration of 3000 cells/well and cultured in the medium (8.3% fetal bovine serum, 8.3% horse serum, and 1% antibiotic and antifungal in DMEM) for one day at 37° C. under 5% carbon dioxide atmosphere. The medium was replaced with 4 μM Fluo-3-AM solution (20 mM HEPES, 137 mM NaCl, 2.7 mM KCl, 0.9 mM MgCl2, 5.0 mM CaCl2, 5.6 mM D-glucose, 2.5 mM probenecid, 0.5% BSA, and 0.04% Pluronic F-127, pH 7.5) and incubated at 37° C. under 5% dioxide carbon atmosphere for one hour. The plate was washed with washing buffer (20 mM HEPES, 137 mM NaCl, 2.7 mM KCl, 0.9 mM MgCl2, 5.0 mM CaCl2, 5.6 mM D-glucose, 2.5 mM probenecid, pH7.5), and each well was added with 20 μL of the washing buffer. The plate was placed in High-Throughput Screening System FLIPR 384 (Molecular Device Co.). Measurement of fluorescence intensity by FLIPR 384 was started, and 20 μL of DMSO solutions containing different concentrations of the test compound as prepared by dilution with dilution buffer (20 mM HEPES, 137 mM NaCl, 2.7 mM KCl, 0.9 mM MgCl2, 5.0 mM CaCl2, 5.6 mM D-glucose, 2.5 mM probenecid, 0.1% Pluronic F-127, pH7.5) were dispensed to each well through the built-in automatic dispenser. Five minutes after, 150 nM ATP solution (25 μL) prepared by dilution with the dilution buffer was dispensed through the built-in automatic dispenser, and the measurement of fluorescence intensity was continued for 4 min. For each well, the specific maximum fluorescence intensity was calculated as the ratio of the maximum fluorescence intensity after addition of the ATP solution to the fluorescence intensity at the starting of the measurement. The 50% inhibitory concentration (IC50) was calculated under the assumption that the specific maximum fluorescence intensity without test compound is 0% inhibition and that the specific maximum fluorescence intensity when the dilution buffer was added in place of ATP solution is 100% inhibition, to evaluate the inhibitory activity of the test compound. The specific maximum fluorescence intensity and IC50 were calculated using Spotfire (Science & Technology Systems, Inc.)
- Activation Assay Human pulmonary artery endothelial cells (HPAEC) were purchased from Invitrogen (Carlsbad, Calif.) and were cultured as previously described.20 The cells were grown in Dulbecco's Modified Eagle's Medium (DMEM) overnight in 96 well plates (Costar). Cells were washed gently three times with HEPES-carbonated buffer (137 mM NaCl, 3 mM KCl, 12 mM NaHCO3, 14.7 mM HEPES, 5.5 mM Glucose, 0.1% Gelatin, 2 mM CaCl2, 1 mM MgCl2, 7.1 pH, 37° C.) between each incubation step. Gelatin blocking buffer (1% Gelatin) was prepared by adding appropriate amount of 5% gelatin stock to HEPES-carbonated buffer as described above. In the first step, gelatin blocking buffer was used to reduce the non specific binding. As part of this step, the cells were incubated with 1% gelatin buffer for 1 hour.
- Bioactivity Assay Bath 1 Buffer consisted of 1 mM MgCl2, 160 mM NaCl, 4.5 mM KCl, 10 mM HEPES, 10 mM Glucose, 2 mM CaCl2).Chloride Free Buffer consisted of 1 mM Magnesium Gluconate, 2 mM Calcium Gluconate, 4.5 mM Potassium Gluconate, 160 mM Sodium Gluconate, 10 mM HEPES, 10 mM Glucose.Bath1 Dye Solution consisted of Bath 1 Buffer, 0.04% Pluronic F127, 20 μM Methyl Oxonol, 30 μM CaCCinh-A01, 30 μM Chicago Sky Blue.Chloride Free Dye Solution consisted of Chloride Free Buffer, 0.04% Pluronic F127, 20 μM Methyl Oxonol, 30 μM CaCCinh-A01, 30 μM Chicago Sky Blue.Chloride Free Dye Stimulation Solution consisted of Chloride Free Dye Solution, 10 μM forskolin, 100 μM IBMX, and 300 nM Compound III.
- TRPA1 Inhibitor Activity Assay The cells were bathed in an extracellular solution containing 80 mM NaCl, 60 mM NMDG, 4 mM KCl, 2 mM CaCl2), 6 mM MgCl2, 5 mM Glucose, 10 mM HEPES, 3 mM HEDTA; pH adjusted to 7.4 with NaOH; 305-310 mOsm. All compounds were dissolved in DMSO at 30 mM. The internal solution contained 10 mM CsCl, 110 mM CsF, 10 mM NaCl, 10 mM EGTA, 10 mM HEPES, 4 mM MgATP, 0.25 mM NaGTP, 4 mM BAPTA; pH adjusted to 7.2 with CsOH; 285-290 mOsm. Compound stock solutions were freshly diluted with external solution to concentrations of 3 nM, 10 nM 30 nM, 100 nM, 300 nM, 1 μM, 3 μM, 10 μM, and 30 μM. The highest content of DMSO (0.1%) was present at 30 μM.
- CYP Inhibition Assay Human liver microsomes (pooled, >30 male and female donors) were incubated with individual CYP isoform-selective standard probes (phenacetin for CYP1A2, amodiquine for CYP2C8, diclofenac for CYP2C9, dextromethorphan for CYP2D6 and midazolam for CYP3A4) in the absence and presence of increasing concentrations of the test compound in order to compare the extent of formation of the respective metabolite. In addition, a set of incubation in the absence of test compound was used as a negative control. Furthermore, the inhibitory potency of standard inhibitors was included as positive controls (fluvoxamine for CYP1A2, montelukast for CYP2C8, sulfaphenazole for CYP2C9, fluoxetine for CYP2D6, ketoconazole for CYP3A4 and mibefradil for CYP3A4-preincubation). Incubation conditions (protein and probe substrate concentration, incubation time) were optimised with regard to linearity and metabolite turnover. Incubation medium consisted of 50 mM potassium phosphate buffer (pH 7.4) containing 1 mM EDTA, NADPH regenerating system (1 mM NADP, 5 mM glucose 6-phosphate, glucose 6-phosphate dehydrogenase (1.5 U/mL). Sequential dilutions and incubations were performed on a Genesis Workstation (Tecan, Crailsheim, FRG) in 96-well plates at 37° C. A final incubation volume of 200 μL was used. Reactions were stopped by addition of 100 μL acetonitrile containing the respective internal standard. Precipitated proteins were removed by centrifugation of the well plate, supernatants were combined and analyses were performed by LC-MS/MS. The LC-MS/MS quantification of the metabolites paracetamol (CYP1A2), desethylamodiaquine (CYP2C8), 4-hydroxydiclofenac (CYP2C9), dextrorphan (CYP2D6), and 1-hydroxymidazolam (CYP3A4) was performed with a PE SCIEX API 3000 LC/MS/MS system (Applied Biosystems, MDS Sciex, Concord, Ontario, Canada).
- Ca2+ flux Assay 1321N1 cells expressing the recombinant human or rat P2X7 channel was cultured in HyQ DME/(HyClone/Dulbecco's Modified Eagle Medium) high glucose supplemented with 10% Fetal Bovine Serum (FBS) and appropriate selection marker. Cells were seeded at a density of 25000 cells/well (96-well clear bottom black walled plates) in 100 μl volume/well. On the day of the experiment, cell plates were washed with assay buffer, containing (in mM): 130 NaCl, 2 KCl, 1 CaCl2, 1 MgCl2, 10 HEPES, 5 glucose; pH 7.40 and 300 mOs. After the wash, cells were loaded with the Calcium-4 dye (Molecular Device) and incubated in the dark for 60 minutes. Test compounds were prepared at 250× the test concentration in neat DMSO. Intermediate 96-well compound plates were prepared by transferring 1.2 μL of the compound into 300 μL of assay buffer. A further 3× dilution occurred when transferring 50 μL/well of the compound plate to 100 μL/well in the cell plate. Cells were incubated with test compounds and dye for 30 minutes. Calcium dye fluorescence was monitored in FLIPR as the cells were challenged by adding 50 μL/well of BzATP (final concentration is 250 μM BzATP (human and rat)). The fluorescence change was measured 180 seconds after adding the agonist. Peak fluorescence was plotted as a function of BzATP concentration using Origin 7 software and the resultant IC50 is shown in Tables 2 and 3 under the column headings FLIPR (human) IC50 (μM) and FLIPR (rat) IC50 (μM).
- Chamber Assay of CFTR-mediated short-circuit currents ssing chamber experiments were performed using human bronchial epithelial (HBE) cells derived from CF subjects heterozygous for F508del and a minimal function CFTR mutation (F508del/MF-HBE) and cultured as previously described (Neuberger T, Burton B, Clark H, Van Goor F Methods Mol Biol 2011:741:39-54). After four days the apical media was removed, and the cells were grown at an air liquid interface for >14 days prior to use. This resulted in a monolayer of fully differentiated columnar cells that were ciliated, features that are characteristic of human bronchial airway epithelia. To isolate the CFTR-mediated short-circuit (ISC) current, F508del/MF-HBE grown on Costar Snapwell cell culture inserts were mounted in an Ussing chamber and the transepithelial ISC was measured under voltage-clamp recording conditions (Vhold= 0 mV) at 37 oC. The basolateral solution contained (in mM) 145 NaCl, 0.83 K2HPO4, 3.3 KH2PO4, 1.2 MgCl2, 1.2 CaCl2, 10 Glucose, 10 HEPES (pH adjusted to 7.4 with NaOH) and the apical solution contained (in mM) 145 NaGluconate, 1.2 MgCl2, 1.2 CaCl2, 10 glucose, 10 HEPES (pH adjusted to 7.4 with NaOH) and 30 µM amiloride to block the epithelial sodium channel. Forskolin (20 µM) was added to the apical surface to activate CFTR, followed by apical addition of a CFTR inhibitor cocktail consisting of BPO, GlyH-101 and CFTR inhibitor 172 (each at 20 µM final assay concentration) to specifically isolate CFTR currents. The CFTR-mediated ISC (µA/cm2) for each condition was determined from the peak forskolin response to the steady-state current following inhibition.
- Kinetic Biochemical Assay Compounds that inhibit the hGYS1 enzyme and, subsequently, the downstream conversion of NADH to NAD+, were tested using assay ready plates (black, clear bottom 384 well plates) in a final DMSO reaction volume of 2.5% DMSO. The Assay Buffer contained 50 mM Tris pH 7.5, 2 mM MgCl2, and 100 mM KCl. Fresh stocks of BSA at a final concentration of 0.02% and TCEP at 1 mM were added before splitting buffer into hGYS1 buffer and substrate buffer. To the hGYS1 buffer, rabbit liver glycogen was added at a final concentration of 0.2% glycogen. Glucose-6-Phosphate was added at 1 mM, recombinant hGYS1/GN1 protein was added at 50 nM to the substrate buffer, phosphoenolpyruvate (PEP) was added at 2 mM, UDP-Glucose was added at 0.8 mM, NADH) was added at 0.6 mM, and Pyruvate Kinase/Lactate Dehydrogenase was added at 20 units/mL. The reaction was initiated by mixing hGYS1 buffer and substrate buffer at a 1:1 ratio. Both buffers were plated using a liquid dispensing device with hGYS1 buffer plated first followed by the substrate buffer. Plates were spun briefly to eliminate air bubbles and are immediately read in continuous mode at an absorbance of 340 nm, for 10 time points in one-minute increments, for a total of 10 minutes. The slope from these 10 time points was normalized to the positive and negative control wells. The duplicate % inhibition values are then averaged and fit to a Hill equation for dose response according to the Levenberg-Marquardt algorithm with the Hill equation maximum set to 100 and the minimum set to 0.
- Humna P2X3 Binding Assay in Human Serum Albumin (HSA) Stably expressing cell line (C6BU-1 cell transfected with human P2X3 receptor gene (GenBank accession number Y07683) was used. The cells were seeded in a 96-well microtiter plate at a concentration of 8000 cells/well and cultured in the medium (7.0% fetal bovine serum, 7.0% horse serum, 1% antibiotic and antifungal, and 2.0% glutamine in DMEM) for one day at 37° C. under 5% carbon dioxide atmosphere. The medium was replaced with 4 μM Fluo-3-AM solution (20 mM HEPES, 137 mM NaCl, 5.37 mM KCl, 0.9 mM MgCl2, 1.26 mM CaCl2, 5.6 mM D-glucose, 2.5 mM probenecid, 0.5% BSA, and 0.04% Pluronic F-127, pH 7.5) and incubated at 37° C. under 5% dioxide carbon atmosphere for one hour. The plate was washed with washing buffer (20 mM HEPES, 137 mM NaCl, 5.27 mM KCl, 0.9 mM MgCl2, 1.26 mM CaCl2, 5.6 mM D-glucose, 2.5 mM probenecid, pH7.5), and each well was added with 40 μL of this buffer. The plate was placed in High-Throughput Screening System FDSS 3000 (Hamamatsu Photonics K.K.). Measurement of fluorescence intensity by FDSS 3000 was started, and 40 μL of DMSO solutions containing 1% HSA (final concentrations) different concentrations of the test compound as prepared by dilution with dilution buffer (20 mM HEPES, 137 mM NaCl, 5.27 mM KCl, 0.9 mM MgCl2, 1.26 mM CaCl2, 5.6 mM D-glucose, 2.5 mM probenecid, 0.1% Pluronic F-127, pH7.5) were dispensed to each well through the built-in automatic dispenser. Five minutes after, 50 nM ATP solution (50 μL) prepared by dilution with the dilution buffer was dispensed through the built-in automatic dispenser, and the measurement of fluorescence intensity was continued for 4 min. For each well, the specific maximum fluorescence intensity was calculated as the ratio of the maximum fluorescence intensity after addition of the ATP solution to the fluorescence intensity at the starting of the measurement. The 50% inhibitory concentration (IC50) was calculated under the assumption that the specific maximum fluorescence intensity without test compound is 0% inhibition and that the specific maximum fluorescence intensity when the dilution buffer was added in place of ATP solution is 100% inhibition, to evaluate the inhibitory activity of the test compound. FDSS software (Hamamatsu Photonics K.K.) was used for calculation of the specific maximum fluorescence intensity. IC50 was calculated using Microsoft Excel (Microsoft Corporation) and XLfit (idbs Ltd.)
- Rat P2X3 Binding Assay Rat P2X3 receptor gene (GenBank accession number NM_031075) was expressed in C6BU-1 cell. The C6BU-1 cells were seeded in a 96-well microtiter plate at a concentration of 2500 cells/well and cultured in the medium (7.0% fetal bovine serum, 7.0% horse serum, and 1% antibiotic and antifungal in DMEM) for one day at 37° C. under 5% carbon dioxide atmosphere. The plasmid was transfected into the cells using transfection reagent FuGENE6 (Promega). The transfected cells were cultured in the medium for one day at 37° C. under 5% carbon dioxide atmosphere. The medium was replaced with 4 μM Fluo-3-AM solution (pH7.5) containing 20 mM HEPES, 137 mM NaCl, 5.27 mM KCl, 0.9 mM MgCl2, 1.26 mM CaCl2, 5.6 mM D-glucose, 2.5 mM probenecid, 1% BSA, and 0.08% Pluronic F-127, and incubated at 37° C. under 5% dioxide carbon atmosphere for one hour. The plate was washed with washing buffer (20 mM HEPES, 137 mM NaCl, 5.27 mM KCl, 0.9 mM MgCl2, 1.26 mM CaCl2, 5.6 mM D-glucose, 2.5 mM probenecid, pH7.5), and each well was added with 40 μL of this buffer. The plate was placed in High-Throughput Screening System FDSS 3000 (Hamamatsu Photonics K.K.). Measurement of fluorescence intensity by FDSS 3000 was started, and 40 μL of DMSO solutions containing different concentrations of the test compound as prepared by dilution with dilution buffer (20 mM HEPES, 137 mM NaCl, 5.27 mM KCl, 0.9 mM MgCl2, 1.26 mM CaCl2, 5.6 mM D-glucose, 2.5 mM probenecid, 0.1% Pluronic F-127, pH7.5) were dispensed to each well through the built-in automatic dispenser. Five minutes after, 50 nM ATP solution (50 μL) prepared by dilution with the dilution buffer was dispensed through the built-in automatic dispenser, and the measurement of fluorescence intensity was continued for 4 min. For each well, the specific maximum fluorescence intensity was calculated as the ratio of the maximum fluorescence intensity after addition of the ATP solution to the fluorescence intensity at the starting of the measurement. The 50% inhibitory concentration (IC50) was calculated under the assumption that the specific maximum fluorescence intensity without test compound is 0% inhibition and that the specific maximum fluorescence intensity when the dilution buffer was added in place of ATP solution is 100% inhibition, to evaluate the inhibitory activity of the test compound. FDSS software (Hamamatsu Photonics K.K.) was used for calculation of the specific maximum fluorescence intensity. IC50 was calculated using Microsoft Excel (Microsoft Corporation) and XLfit (idbs Ltd.).The data of the compounds of the present invention ar
- Rat P2X3 Binding Assay in Rat Serum Albumin (HSA) Rat P2X3 receptor gene (GenBank accession number NM_031075) was expressed in C6BU-1 cell. The C6BU-1 cells were seeded in a 96-well microtiter plate at a concentration of 2500 cells/well and cultured in the medium (7.0% fetal bovine serum, 7.0% horse serum, and 1% antibiotic and antifungal in DMEM) for one day at 37° C. under 5% carbon dioxide atmosphere. The plasmid was transfected into the cells using transfection reagent FuGENE6 (Promega). The transfected cells were cultured in the medium for one day at 37° C. under 5% carbon dioxide atmosphere. The medium was replaced with 4 μM Fluo-4-AM solution (pH7.5) containing 20 mM HEPES, 137 mM NaCl, 5.27 mM KCl, 0.9 mM MgCl2, 1.26 mM CaCl2, 5.6 mM D-glucose, 2.5 mM probenecid, 10% BSA, and 0.08% Pluronic F-127, and incubated at 37° C. under 5% dioxide carbon atmosphere for one hour. The plate was washed with washing buffer (20 mM HEPES, 137 mM NaCl, 5.27 mM KCl, 0.9 mM MgCl2, 1.26 mM CaCl2, 5.6 mM D-glucose, 2.5 mM probenecid, pH7.5), and each well was added with 40 μL of this buffer. The plate was placed in High-Throughput Screening System FDSS 3000 (Hamamatsu Photonics K.K.). Measurement of fluorescence intensity by FDSS 3000 was started, and 40 μL of DMSO solutions containing 1% RSA (final concentrations) and different concentrations of the test compound as prepared by dilution with dilution buffer (20 mM HEPES, 137 mM NaCl, 5.27 mM KCl, 0.9 mM MgCl2, 1.26 mM CaCl2, 5.6 mM D-glucose, 2.5 mM probenecid, 0.1% Pluronic F-127, pH7.5) were dispensed to each well through the built-in automatic dispenser. Five minutes after, 50 nM ATP solution (50 μL) prepared by dilution with the dilution buffer was dispensed through the built-in automatic dispenser, and the measurement of fluorescence intensity was continued for 4 min. For each well, the specific maximum fluorescence intensity was calculated as the ratio of the maximum fluorescence intensity after addition of the ATP solution to the fluorescence intensity at the starting of the measurement. The 50% inhibitory concentration (IC50) was calculated under the assumption that the specific maximum fluorescence intensity without test compound is 0% inhibition and that the specific maximum fluorescence intensity when the dilution buffer was added in place of ATP solution is 100% inhibition, to evaluate the inhibitory activity of the test compound. FDSS software (Hamamatsu Photonics K.K.) was used for calculation of the specific maximum fluorescence intensity. IC50 was calculated using Microsoft Excel (Microsoft Corporation) and XLfit (idbs Ltd.).
- transactivation assay Human epithelial kidney cells (HEK 293) were grown to 80% confluency in Dubelcco's modified Eagles 4.5 g/L glucose medium (high glucose DMEM) containing 10% fetal bovine serum, 50 units/mL penicillin and 50 μg/mL streptomycin. The cells were trypsinized with 0.25% trypsin, then diluted to 5×10⁵ cells/mL with high glucose DMEM. Cells were added to Costar 3917 96-well plates at 5×10⁴ cells/well, then incubated at 37° C. for 24 hours. 1.5 μg of TR expression vector (full length TRα-CMV or TRβ-CMV), 1.5 μg of a reporter plasmid containing a DR4 thyroid hormone response element (TRE) direct repeat spaced by four nucleotides (AGGTCAcaggAGGTCA) cloned upstream of a minimal thymidine kinase promoter linked to a firefly luciferase coding sequence, and 0.75 μg of a pRL-SV40 constitutive Renilla luciferase reporter plasmid were diluted into 540 μl of OptiMEM. 27 μL of lipofectamine reagent was diluted into 540 μL of OptiMEM. The plasmid and lipofectamine dilutions were combined then incubated at RT for 10 min. The mixture was then diluted into 4.29 mL of OptiMEM. Plates were washed with 100 μL of phosphate buffered saline (PBS) at pH 7.2 without magnesium or calcium chloride per well. Transfection mixtures were added at 50 μL per well, then incubated at 37° C. for 4 hours. Modified DME/F-12 Ham's medium without phenol red containing 15 mM HEPES and bicarbonate, 5 mM L-glutamine, charcoal-stripped FBS, 50 units/mL penicillin and 50 μg/mL streptomycin was added at 50 μL per well, then the plates were incubated at 37° C. for 20 hours. Drug stocks were made at 10 mM in DMSO, then serially diluted to 1× concentrations in DME/F-12 Ham's. Plates were washed with 100 μL of PBS (pH 7.2) per well. 100 μL of each drug stock was added to the wells in triplicate, and then the plates were incubated at 37° C. for 24 hours.Cells were assayed for luciferase activity using the Promega DualGlo kit. 50 μl of Luciferase Reagent were added per well, the plate was rocked for 15 min at RT, and then the plate was read for firefly luciferase activity. A 50 μl volume of Stop & Glo Reagent was added per well, then the plate was read for Renilla luciferase activity. Data normalized to Renilla internal control were analyzed with GraphPad Prism v.4a using the sigmoid dose response model to generate EC50 values±SEM.
- Cellular In Vitro Assay On the day before the assay, the cells are plated out in culture medium (DMEM, 10% FCS, 2 mM glutamine, 10 mM HEPES) in 384-well microtiter plates and kept in a cell incubator (96% humidity, 5% v/v CO2, 37° C.). On the day of the assay, the culture medium is replaced by a Tyrode solution (140 mM NaCl, 5 mM KCl, 1 mM MgCl2, 2 mM CaCl2, 20 mM glucose, 20 mM HEPES), which additionally contains the cofactor coelenterazine (50 μM), and the microtiter plate is then incubated for a further 3-4 hours. The test substances in various concentrations are placed for 10 to 20 minutes in the wells of the microtiter plate before the agonist [Arg8]-vasopressin is added, and the resulting light signal is measured immediately in the luminometer.
- Cellular In Vitro Assay On the day before the assay, the cells are plated out in culture medium (DMEM, 10% FCS, 2 mM glutamine, 10 mM HEPES) in 384-well microtiter plates and kept in a cell incubator (96% humidity, 5% v/v CO2, 37° C.). On the day of the assay, the culture medium is replaced by a Tyrode solution (140 mM NaCl, 5 mM KCl, 1 mM MgCl2, 2 mM CaCl2, 20 mM glucose, 20 mM HEPES), which additionally contains the cofactor coelenterazine (50 μM), and the microtiter plate is then incubated for a further 3-4 hours. The test substances in various concentrations are placed for 10 to 20 minutes in the wells of the microtiter plate before the agonist [Arg8]-vasopressin is added, and the resulting light signal is measured immediately in the luminometer.
- Cellular in Vitro Assay On the day before the assay, the cells are plated out in culture medium (DMEM, 10% FCS, 2 mM glutamine, 10 mM HEPES) in 384-well microtitre plates and kept in a cell incubator (96% humidity, 5% v/v CO2, 37° C.). On the day of the assay, the culture medium is replaced by a Tyrode solution (140 mM NaCl, 5 mM KCl, 1 mM MgCl2, 2 mM CaCl2, 20 mM glucose, 20 mM HEPES), which additionally contains the cofactor coelenterazine (50 μM), and the microtitre plate is then incubated for a further 3-4 hours. The test substances in various concentrations are placed for 10 to 20 minutes in the wells of the microtitre plate before the agonist [Arg8]-vasopressin is added, and the resulting light signal is measured immediately in the luminometer.
- FRET Assay Seed each cell lines (1×10⁵ cells/well) into 96-well plates prior to experimentation.Incubate at 37° C. in 5% CO, for 24 hours.Wash each well with assay buffer (140 mM NaCl, 4:5 mM KCl, 10 mM D-Glucose, 2 mM CaCl2, 1 mM MgCl2, 10 mM HEPES, pH 7.4 adjusted with NaOH) twice.Add 1st loading solution containing 10 microM PTS18 and 0.06% Pluronic F-127 in assay buffer.Incubate the plate at rt in dark for 1 hour.Remove 1st loading solution and add 2nd loading solution containing 12.5 microM DiSBAC2(3), 1.25 mM Xylene Fast Yellow and 0.0075% Pluronic F-127 in assay buffer.Place the plate under the dark at rt for 25 minutes.Add compound solutions into the assay plate.Set the assay plate in FDSS and place an EFS device on the plate.Measure EFS-induced fluorescent response by FDSS.
- HERG Assay Whole cell patch clamp recordings of hERG current (IhERG) were made at 37 °C from human embryonic kidney cells (HEK 293) cells stably expressing hERG (generously donated by Dr Craig January).15 Cells were maintained in culture and prepared for electrophysiological recording as described previously [Cheng et al., Brit. J. Pharmacol., 165:2260-2273; Du et al., J. Cardiovasc. Electrophysiol., 22:1163-1170]. Cells were superfused with a normal Tyrode’s solution containing (in mM) 140 NaCl, 4 KCl, 2 CaCl2, 1 MgCl2, 10 Glucose and 5 HEPES (titrated to pH 7.45 with NaOH). Patch-pipettes were filled with a K+-based dialysate containing (in mM): 130 KCl, 1 MgCl2, 5 EGTA, 5 MgATP and 10 HEPES (titrated to pH 7.2 with KOH). Pipette resistance typically ranged from 1.5–3.5 MR and ∼70-80% series resistance could be compensated.
- RSV Antiviral Assay (RSV) The HeLa-derived cells containing the stable RSV replicon were cultured in DMEM containing 4500 mg/L D-glucose, L-glutamine, and 110 mg/L sodium pyruvate. The medium was further supplemented with 10% (v/v) FBS (Mediatech), 1% (v/v) penicillin/streptomycin (Mediatech), and 10 μg/mL of Blasticidin (BSD) (Invivogen). Cells were maintained at 37° C. in a humidified 5% CO2 atmosphere. On the first day, 5000 RSV replicon cells per well were plated in a 96-well plate. On the following day, compounds to be tested were solubilized in 100% DMSO to 100×the desired final testing concentration. Cells were incubated with compounds for 7 days at 37° C. in a 5% CO2 atmosphere before measurement of the luciferase readout. Cell viability (CC50) was measured with a CellTiter-Glo cell proliferation assay (Promega).
- CYP MUX (3A4) RI Compound dilutions and assay-ready plates were prepared on a TTP Labtech mosquito HTS. Assay conduction was fully automated on a customized Screening Platform from Caliper (now PerkinElmer) containing a Mitsubishi robotic plate handler, Liconic incubators, a Caliper Zephyr liquid handling workstation equipped with temperature-controlled deck positions, a Biotek MultiFlo dispenser and an Agilent PlateLoc heat sealer. Assay plates were Corning Costar 384 well PP plates. High throughput mass spectrometric readout was performed on a RapidFire 300 system coupled to an AB Sciex API 4000 triple quadrupole device. CYP isoform 3A4 was incubated in a separate reaction of 50 μL final volume. 25 μL of HLM (human liver microsomes, BD UltraPool 150, 0.25 mg/mL final concentration) and the respective substrate, testosterone (75 μM) for 3A4, in potassium phosphate buffer (100 mM, pH=7.4) were added to 250 nL of stamped compound solution (10 mM in DMSO). The reactions were started upon addition of 25 μL of a co-factor solution containing magnesium chloride (3.3 mM), glucose-6-phosphate (3.3 mM), glucose-6-phosphate dehydrogenase (1.4 units) and NADP (1 mM) in potassium phosphate buffer (100 mM, pH=7.4) and incubated on deck at 37° C. for 10 min. 8 μL of each reaction were transferred to the same readout plated filled with 48 μL of stop solution containing internal standards (concentration in final readout plate), 6-hydroxytestosterone-D7 (0.5 μM), 4′-hydroxydiclofenac-D4 (0.2 and dextrorphan-D3 (0.01 in acetonitrile with 0.5% formic acid. After heat sealing, plates were stored at −20° C. for at least 30 min, centrifuged and subjected directly to RapidFire/MS analysis.
- Cell-Based Assay of NHE-3 Activity Rat NHE-3-mediated Na+-dependent H+ antiport was measured using a modification of the pH sensitive dye method originally reported by Tsien (Proc. Natl. Acad. Sci. USA. (1984) 81(23): 7436-7440). Opossum kidney (OK) cells were obtained from the ATCC and propagated per their instructions. The rat NHE-3 gene was introduced into OK cells via electroporation, seeded into 96 well plates and grown overnight. Medium was aspirated from the wells, cells were washed twice with NaCl-HEPES buffer (100 mM NaCl, 50 mM HEPES, 10 mM glucose, 5 mM KCl, 2 mM CaCl2, 1 mM MgCl2, pH 7.4), then incubated for 30 min at room temperature with NH4Cl-HEPES buffer (20 mM NH4Cl, 80 mM NaCl, 50 mM HEPES, 5 mM KCl, 2 mM CaCl2, 1 mM MgCl2, pH 7.4) containing 5 uM BCECF-AM (Invitrogen). Cells were washed twice with Ammonium free, Na+-free HEPES (100 mM choline, 50 mM HEPES, 10 mM glucose, 5 mM KCl, 2 mM CaCl2, 1 mM MgCl2, pH 7.4) and incubated in the same buffer for 10 minutes at room temperature to lower intracellular pH. NHE-3-mediated recovery of neutral intracellular pH was initiated by addition of Na-HEPES buffer containing 5 uM ethyl isopropyl amiloride (EIPA, a selective antagonist of NHE-1 activity that does not inhibit NHE-3) and 0-30 uM test compound, and monitoring the pH sensitive changes in BCECF fluorescence (ex 505 nm, λem 538 nm) normalized to the pH insensitive BCECF fluorescence (λex 439 nm, λem 538 nm). Initial rates were were plotted as the average 3-6 replicates, and pIC50 values were estimated using GraphPad Prism.
- Glucokinase-Activating Assay To test the exemplified compounds, the following assay was employed. Recombinant human liver glucokinase was expressed as a FLAG fusion protein in E. coli, and purified on ANTIFLAG M2 AFFINITY GEL (Sigma). The assay was carried out at 30° C. in a 96-well plate. In the plate was distributed 69 ul each of assay buffer (25 mM Hepes Buffer: pH=7.2, 2 mM MgCl2, 1 mM ATP, 0.5 mM TNAD, 1 mM dithiothreitol), to which was added 1 ul of a DMSO solution of the compound or DMSO as control. Then, 20 ul of pre-ice-cooled enzyme mixture (FLAG-GK, 20 U/ml G6PDH) was distributed thereto, to which was added 10 ul of 25 mM glucose as substrate to initiate the reaction (final glucose concentration=2.5 mM). After starting the reaction, the absorbance at 405 nm was measured every 30 seconds for 10 minutes to evaluate the compound based on the initial increase for 5 minutes. FLAG-GK was added so that the increase of absorbance after 5 minutes fell between 0.05 to 0.1 in the presence of 1% DMSO. The OD values of the respective compounds were measured in the respective concentrations, wherein the OD value of DMSO as control is regarded as 100%. From the OD values at the respective concentrations, Emax (%, 2.5 mM Glu) and EC50 (nM, 2.5 mM Glu) were calculated and used as indicators of the GK activation capability of the compounds. According to the above assay, the GK activation capability of the exemplified compounds of the present invention was determined. The following table shows the results. Where different enantiomers of the same compound were tested, two numbers are provided. Where 3 numbers are provided, for example, Ex. #30, data for the racemic form is also shown.
- In Vitro Assay This potassium flux assay employs the cell-permeable, potassium-sensitive dye, IPG-2 AM, to quantify potassium ion flux through potassium channels.In general, TREX HEK 293 or HEK 293 cells were stably transfected with either an inducible or non-inducible expression vector containing the full-length cDNA coding for the desired human KV7.2/KV7.3 or in combination with another full-length cDNA for a second desired human KV7 potassium channel. Potassium channel-expressing cell lines were induced with tetracycline (1 g/mL), if required, and plated on 384-well poly-D-lysine (PDL)-coated plates in culture media (DMEM, containing 10% FBS and 1% L-glutamine). After overnight incubation, culture media was removed and cells were loaded with 5 M IPG-2 AM dye for 1 hour in Assay buffer (140 mM NaCl, 20 mM RbCl, 2 mM CaCl2, 1 mM MgCl2, 10 mM HEPES (4-(2-hydroxyethyl)-1-piperazineethanesulfonic acid buffer), 10 mM glucose, adjusted with Tris to pH 7.4). Excess dye was removed, and cells incubated at room temperature for 20 minutes with or without test compound. A Hamamatsu FDSS Cell was used to perform a 1:1 addition of K challenge buffer (150 mM NaCl, 10 mM HEPES, 2 mM CaCl2, 10 mM KCl, 1 mM MgCl2, 10 mM glucose, adjusted with Tris to pH 7.4 for human KV7.2/KV7.3, and simultaneously read plates at excitation wavelength of 530 nm and emission wavelength of 558 nm. Non-potassium channel-mediated potassium influx was determined in the presence of DMSO, and maximal influx was determined in the presence of a known KV7.x channel modulator. For each test compound, a concentration response curve was generated with 16 concentrations points, 2-fold serial dilution starting at 30 M and an EC50 value was determined.
- Inhibition Assay Incubations were conducted in 96 well microtiter plates based on a method described by BD Biosciences. To the first well in each row, a NADPH regenerating system and test compound was added. In the second well and all remaining wells, NADPH regenerating system and acetonitrile (final concentration of 2%) was added. The final assay concentration of the NADPH regenerating system was 8.2 uM NADP+, 0.41 mM glucose-6-phosphate, 0.41 mM magnesium chloride hexahydrate and 0.4 U/ml glucose-6-phosphate dehydrogenase and 0.01 mg/mL control insect cell membrane protein. The test compound solution was serially diluted 1:3 through the eighth wells.The final concentration of the test compounds were in the range 100 uM to 45.7 nM in the eight rows. Wells 9 and 10 contained no test compound (only NADPH regenerating system and enzyme/substrate mix) and wells 11 and 12 were used as controls for background fluorescence (enzyme and substrate were added after the reaction was terminated). The plate was then pre-incubated at 37° C. for 10 min, and the reaction was initiated by the addition of pre-warmed enzyme/substrate mix. The assay concentration of the enzyme/substrate mix was 100 mM potassium phosphate, pH 7.4, 1.5 pmol recombinant human P450 CYP2D6 and 1.5 uM of the fluorescent substrate 3-[2-(N,N diethyl-N-methylamino)ethyl]-7-methoxy-4-methylcounnarin (AMMC). The assay was conducted in duplicate in a final volume of 200 uL per well. Reactions were terminated after 30 min by addition of a 4:1, acetonitrile:0.5 M Tris base solution. Quinidine was used as positive control, 0.5 uM as highest concentration. Fluorescence per well was measured using a fluorescence plate reader (excitation: 390 nm, emission: 460 nm).
- Intracellular Calcium Measurement to Assess Antagonist Activity A fluorescent imaging plate reader (FLEX/FLIPR station; Molecular Devices) was used to monitor intracellular calcium levels using the calcium-chelating dye Fluo-4 (Molecular Probes). The excitation and emission wavelengths used to monitor fluorescence were 470-495 nm and 515-575 nm, respectively. Cells expressing purinergic receptors P2X3 (human) or P2X2/3 (human) were plated at a density of 15,000 cells/well in collagen-coated 384-well plates approximately 20 hours before beginning the assay. On the day of the assay, 20 μl of loading buffer (Hank's balanced salt solution, 20 mM HEPES, 0.5 mM CaCl2, 0.5 mM MgCl2, 0.1% BSA, 5 mM probenecid, 10 mM D-glucose monohydrate, 2 μM Fluo-4, and 5 units/mL, hexokinase, pH=7.4) was added and cells dye-loaded for 90 min at 37° C. The dye supernatant was removed and replaced with 45 μl probenecid buffer (Hank's balanced salt solution, 20 mM HEPES, 0.5 mM CaCl2, 0.5 mM MgCl2, 0.1% BSA, 5 mM probenecid, 10 mM D-glucose monohydrate, pH=7.4). The test compound was added in a volume of 5 μl and allowed to incubate for 30 min at 37° C. The final assay DMSO concentration is 1%.The agonist, α,β-Me-ATP, was added in a volume of 20 μl at a concentration representing the EC80 value. The fluorescence was measured for an interval of 90 sec at 2 sec intervals and analyzed based on the increase in peak relative fluorescence units (RFU) compared to the basal fluorescence. Peak fluorescence was used to determine the response to agonist obtained at each concentration of test compound by the following equation: % Response=100*(RFU(test compound)−RFU(control))/(RFU(DMSO)−RFU(control)).
- Intracellular Calcium Measurement to Assess Antagonist Activity at Human P2X3 and Human P2X2/3 Receptors A fluorescent imaging plate reader (FLEX/FLIPR station; Molecular Devices) was used to monitor intracellular calcium levels using the calcium-chelating dye Fluo-4 (Molecular Probes). The excitation and emission wavelengths used to monitor fluorescence were 470-495 nm and 515-575 nm, respectively. Cells expressing purinergic receptors P2X3 (human) or P2X2/3 (human) were plated at a density of 15,000 cells/well in collagen-coated 384-well plates approximately 20 hours before beginning the assay. On the day of the assay, 20 μl of Loading buffer (Hank's balanced salt solution, 20 mM HEPES, 0.5 mM CaCl2, 0.5 mM MgCl2, 0.1% BSA, 5 mM probenecid, 10 mM D-glucose monohydrate, 2 μM Fluo-4, and 5 units/mL, hexokinase, pH=7.4) was added and cells dye-loaded for 90 min at 37° C. The dye supernatant was removed and replaced with 45 μl probenecid buffer (Hank's balanced salt solution, 20 mM HEPES, 0.5 mM CaCl2, 0.5 mM MgCl2, 0.1% BSA, 5 mM probenecid, 10 mM D-glucose monohydrate, pH=7.4). The test compound was added in a volume of 5 μl and allowed to incubate for 30 min at 37° C. The final assay DMSO concentration is 1%. The agonist, α,β-Me-ATP, was added in a volume of 20 μl at a concentration representing the EC80 value. The fluorescence was measured for an interval of 90 sec at 2 sec intervals and analyzed based on the increase in peak relative fluorescence units (RFU) compared to the basal fluorescence. Peak fluorescence was used to determine the response to agonist obtained at each concentration of test compound by the following equation: % Response=100*(RFU(test compound)−RFU(control)/RFU(DMSO)−RFU(control)).
- Sodium Influx Assay (In Vitro Assay) This sodium influx assay employs the use of the cell permeable, sodium sensitive dye ANG2 to quantify sodium ion influx through sodium channels which are maintained in an open state by use of sodium channel modulators. This high throughput sodium influx assay allows for rapid profiling and characterization of sodium channel blockers.In general, Trex HEK293 cells were stably transfected with an inducible expression vector containing the full-length cDNA coding for the desired human sodium channel α-subunit and with an expression vector containing full length cDNA coding for the β1-subunit. Sodium channel expressing cell lines were induced with tetracycline (1 μg/mL) and plated on 384-well PDL-coated plates at a density of 25K-30K cells/well in culture media (DMEM, containing 10% FBS and 1% L-glutamine). After overnight incubation (37° C., 5% CO2), culture media was removed and cells were loaded with 5 uM ANG2 dye for 1-1.5 h in Buffer 1 (155 mM NMDG, 5 mM KCl, 2 mM CaCl2, 1 mM MgCl2, 10 mM HEPES, 10 mM glucose, adjusted with Tris to pH 7.4). Access dye was removed and cells were incubated with test compounds for 1 hr in buffer 1 containing sodium channel modulator(s) at room temperature. Hamamatsu FDSS μCell was used to perform a 1:1 addition of Na/K challenge buffer (140 mM NaCl, 20 mM HEPES, 1 mM CaCl2, 15 mM KCl, 1 mM MgCl2, 10 mM glucose, adjusted with Tris to pH 7.4) and simultaneously read plates at excitation wavelength of 530 nm and emission wavelength set at 558 nm. Percent inhibition of sodium ion influx was calculated for each test compound at each test concentration to determine the IC50 values.
- Sodium Influx Assay (In Vitro Assay) This sodium influx assay employs the use of the cell permeable, sodium sensitive dye ANG2 to quantify sodium ion influx through sodium channels which are maintained in an open state by use of sodium channel modulators. This high throughput sodium influx assay allows for rapid profiling and characterization of sodium channel blockers.In general, Trex HEK293 cells were stably transfected with an inducible expression vector containing the full-length cDNA coding for the desired human sodium channel α-subunit and with an expression vector containing full length cDNA coding for the β1-subunit. Sodium channel expressing cell lines were induced with tetracycline (1 μg/mL) and plated on 384-well PDL-coated plates at a density of 25K-30K cells/well in culture media (DMEM, containing 10% FBS and 1% L-glutamine). After overnight incubation (37° C., 5% CO2), culture media was removed and cells were loaded with 5 uM ANG2 dye for 1-1.5 h in Buffer 1 (155 mM NMDG, 5 mM KCl, 2 mM CaCl2, 1 mM MgCl2, 10 mM HEPES, 10 mM glucose, adjusted with Tris to pH 7.4). Access dye was removed and cells were incubated with test compounds for 1 hr in buffer 1 containing sodium channel modulator(s) at room temperature. Hamamatsu FDSS ρCell was used to perform a 1:1 addition of Na/K challenge buffer (140 mM NaCl, 20 mM HEPES, 1 mM CaCl2, 15 mM KCl, 1 mM MgCl2, 10 mM glucose, adjusted with Tris to pH 7.4) and simultaneously read plates at excitation wavelength of 530 nm and emission wavelength set at 558 nm. Percent inhibition of sodium ion influx was calculated for each test compound at each test concentration to determine the IC50 values.
- Sodium Influx Assay (In Vitro Assay) This sodium influx assay employs the use of the cell permeable, sodium sensitive dye ANG2 to quantify sodium ion influx through sodium channels which are maintained in an open state by use of sodium channel modulators. This high throughput sodium influx assay allows for rapid profiling and characterization of sodium channel blockers.In general, Trex HEK293 cells were stably transfected with an inducible expression vector containing the full-length cDNA coding for the desired human sodium channel α-subunit and with an expression vector containing full length cDNA coding for the β1-subunit. Sodium channel expressing cell lines were induced with tetracycline (1 μg/mL) and plated on 384-well PDL-coated plates at a density of 25K-30K cells/well in culture media (DMEM, containing 10% FBS and 1% L-glutamine). After overnight incubation (37° C., 5% CO2), culture media was removed and cells were loaded with 5 uM ANG2 dye for 1-1.5h in Buffer 1 (155 mM NMDG, 5 mM KCl, 2 mM CaCl2, 1 mM MgCl2, 10 mM HEPES, 10 mM glucose, adjusted with Tris to pH 7.4). Access dye was removed and cells were incubated with test compounds for 1 hr in buffer 1 containing sodium channel modulator(s) at room temperature. Hamamatsu FDSS μCell was used to perform a 1:1 addition of Na/K challenge buffer (140 mM NaCl, 20 mM HEPES, 1 mM CaC2, 15 mM KCl, 1 mM MgCl2, 10 mM glucose, adjusted with Tris to pH 7.4) and simultaneously read plates at excitation wavelength of 530 nm and emission wavelength set at 558 nm. Percent inhibition of sodium ion influx was calculated for each test compound at each test concentration to determine the IC50 values.
- The GYS2 coupled enzyme assay Compounds that inhibit the hGYS2 enzyme and, subsequently, the downstream conversion of NADH to NAD+, were tested using assay ready plates (black, clear bottom 384 well plates) in a final DMSO reaction volume of 2.5% DMSO. The Assay Buffer contained 50 mM Tris pH 7.5, 2 mM MgCl2, and 100 mM KCl. Fresh stocks of BSA at a final concentration of 0.02% and TCEP 1 mM were added before splitting buffer into hGYS2 buffer and substrate buffer. To the hGYS2 buffer, rabbit liver glycogen was added at a final concentration of 0.2% glycogen. Glucose-6-Phosphate was added at 2 mM, recombinant hGYS2/GN1 protein was added at 200 nM to the substrate buffer, phosphoenolpyruvate (PEP) was added at 2 mM, UDP-Glucose was added at 2 mM, NADH was added at 0.6 mM, and Pyruvate Kinase/Lactate Dehydrogenase was added at 20 units/mL. The reaction was initiated by mixing hGYS2 buffer and substrate buffer at a 1:1 ratio. Both buffers were plated using a liquid dispensing device with hGYS2 buffer plated first followed by the substrate buffer. Plates were spun briefly to eliminate air bubbles and are immediately read in continuous mode at an absorbance of 340 nm, for 10 time points in one-minute increments, for a total of 10 minutes. The slope from these 10 time points was normalized to the positive and negative control wells. The duplicate % inhibition values are then averaged and fit to a Hill equation for dose response according to the Levenberg-Marquardt algorithm with the Hill equation maximum set to 100 and the minimum set to 0.The results are shown in Table 4 below
- Fluorescence-polarization-based biochemical polarscreen dose response binding assay for partial agonists of the peroxisome proliferator-activated receptor gamma (PPARg) Source (MLPCN Center Name): The Scripps Research Institute Molecular Screening Center (SRISMC) Center Affiliation: The Scripps Research Institute, TSRI Assay Provider: Patrick Griffin, TSRI Network: Molecular Library Probe Production Center Network (MLPCN) Grant Proposal Number: MH079861-01 Grant Proposal PI: Patrick Griffin, TSRI External Assay ID: PPARG_AG_FP_0384_3XIC50 POLARSCREEN DRUN Name: Fluorescence-polarization-based biochemical polarscreen dose response binding assay for partial agonists of the peroxisome proliferator-activated receptor gamma (PPARg). Description: Peroxisome proliferator-activated receptors (PPARs) belong to the nuclear receptor superfamily and are lipid sensors functioning as ligand-dependent transcription factors regulating gene expression patterns of diverse biological processes (1, 2). PPARs play a critical role in metabolic processes such as glucose metabolism, lipid metabolism, and have been implicated in anti-atherogenic, anti-inflammatory as well
- Fluorescent ACAT Assay HepG2 cells were cultured in low-glucose DMEM supplement with 100 U/mL streptomycin and penicillin. Twenty thousand cells were plated per well on 96-well culture plates and grew overnight at 37 °C. Cells were incubated in medium containing either different samples, Sandoz 58-035 (positive control) or without sample (negative control and blank control) for 1 h. Then, NBD-cholesterol with final concentration of 2 µg/mL was added into the medium except for blank control and incubated overnight. NBDcholesterol was added from a 1 mg/mL stock in ethanol, and ethanol concentrations did not exceed 0.1%. After incubation, medium was removed, and the cells were washed three times with 20 µL PBS buffer. Plates were read fluorescence from the bottom using WALLAC Victor 2plate reader (PerkinElmer, Waltham, MA, USA) equipped with 485-nm excitation and 535-nm emission filters.
- Functional Calcium Imaging Assay Briefly, HEK 293T cells stably expressing the G protein-chimera Gα16gust44 were seeded onto 96-well plates coated with 10 μg/ml of poly-D-lysine. The next day cells were transiently transfected with ORA1, ORA2, or human bitter taste receptor TAS2R16 constructs using Lipofectamine 2000 (Invitrogen). After 24 h the cells were washed with buffer C1 (130 mM NaCl, 5 mM KCl, 10 mM Hepes, pH 7.4, 2 mM CaCl2, 10 mM glucose), and loaded with the calcium-responsive dye Fluo-4 AM in the presence of 1 mM probenecide, an inhibitor of ABC transporter A1. To remove excessive fluorescence dye, cells were washed three times with buffer C1 and transferred into a fluorometric imaging plate reader (FLIPR, Molecular Devices) for measurement. Test substances were dissolved in C1 buffer and the changes in fluorescence after application of test substances were monitored.
- Late stage assay provider counterscreen for partial agonists of the peroxisome proliferator-activated receptor gamma (PPARg) Source (MLPCN Center Name): The Scripps Research Institute Molecular Screening Center (SRISMC) Center Affiliation: The Scripps Research Institute, TSRI Assay Provider: Patrick Griffin, TSRI Network: Molecular Library Probe Production Center Network (MLPCN) Grant Proposal Number: MH079861-01 Grant Proposal PI: Patrick Griffin, TSRI External Assay ID: PPARA_AG_LUMI_0384_3XEC50 MDRUN Name: Late stage assay provider counterscreen for partial agonists of the peroxisome proliferator-activated receptor gamma (PPARg): Luminescence-based cell-based dose response assay for partial agonists of the peroxisome proliferator-activated receptor alpha (PPARA). Description: Peroxisome proliferator-activated receptors (PPARs) belong to the nuclear receptor superfamily and are lipid sensors functioning as ligand-dependent transcription factors regulating gene expression patterns of diverse biological processes (1, 2). PPARs play a critical role in metabolic processes such as glucose metabolism, lipid
- Patch Clamp Assay For patch clamp experiments, HEK293 cells are stably transfected with canine TRPM8 and cultured in DMEM supplemented with 10% fetal bovine serum, 100 units/ml penicillin, 100 μg/ml streptomycin and 1 mg/ml G418. Cells are maintained at 37° C. and in 5% CO2.The extracellular solution contains (in mM): NaCl, 132; EGTA, 1; KCl, 5.4; MgCl2, 0.8; HEPES, 10; glucose, 10; pH=7.4. Recordings are performed using the conventional whole-cell patch clamp technique, 1-2 days after plating cells onto glass coverslips at densities appropriate for single cell recording. Currents are amplified by a patch clamp amplifier and filtered at 2 kHz (Axopatch 200B, Molecular Devices, Union City, Calif.). Menthol (100 μM) is applied to the cell at 0.5 ml/min via a gravity-fed perfusion system. Recordings involving menthol activation are performed at 22° C.
- SGLT1 Glucose Transport Test 1) Experimental buffer: 10 mM 4-hydroxyethylpiperazine ethanesulfonic acid (HEPES), 1.2 mM magnesium chloride (MgCl2), 4.7 mM potassium chloride (KCl), 2.2 mM calcium chloride (CaCl2) and 120 mM sodium chloride (NaCl).2) The compound was diluted with 100% dimethyl sulfoxide (DMSO) with 1 mM as the starting concentration and 8 points of 5-fold serial dilutions.3) 3 μM [14C]-labeled methyl α-D-glucopyranoside was prepared with experimental buffer.4) The cells were treated with 49 μL of experimental buffer, 1 μL of the compound which was gradient diluted, and 50 μL of 3 μM [14C] isotope-labeled sugar solution at 37° C. for 2 hours.5) The isotope detector (Micro beta Reader) was used to read.6) The data was calculated by GraphPad Prism 5.0 software: log(inhibitor) vs. response—Variable slope to obtain the IC50 value of the test compound
- TR-FRET-based biochemical dose response competitive binding lanthascreen assay for partial agonists of the peroxisome proliferator-activated receptor gamma (PPARg) Source (MLPCN Center Name): The Scripps Research Institute Molecular Screening Center (SRISMC) Center Affiliation: The Scripps Research Institute, TSRI Assay Provider: Patrick Griffin, TSRI Network: Molecular Library Probe Production Center Network (MLPCN) Grant Proposal Number: MH079861-01 Grant Proposal PI: Patrick Griffin, TSRI External Assay ID: PPARG_AG_TRFRET_0384_3XIC50 LANTHASCREEN DRUN Name: TR-FRET-based biochemical dose response competitive binding lanthascreen assay for partial agonists of the peroxisome proliferator-activated receptor gamma (PPARg). Description: Peroxisome proliferator-activated receptors (PPARs) belong to the nuclear receptor superfamily and are lipid sensors functioning as ligand-dependent transcription factors regulating gene expression patterns of diverse biological processes (1, 2). PPARs play a critical role in metabolic processes such as glucose metabolism, lipid metabolism, and have been implicated in anti-atherogenic, anti-inflammatory as well
- Transactivation Assay The Notch-CBF1 (C-promoter binding factor I) cell based transactivation assay is based on the ability of the released Notch intracellular domain fragments (NICDs) to function as transcription factors in conjunction with CBF1 and other nuclear factors. Luciferase assays were used to measure the antagonism of Notch-CBF1 transcriptional activity. HeLa cervical cancer cells are transiently co-transfected with pCDNA3.1/Hygro plasmids containing truncated Notch 1, Notch 2, Notch 3, or Notch 4 receptors and a PGL3 luciferase reporter vector containing 4 copies of CBF1 binding site. The cells were then tested for Notch-CBF1 activity in the absence or presence of test compounds. HeLa cells, maintained in DMEM (high glucose with HEPES), 1× glutamine/penicillin/streptomycin and 10% Fetal Bovine serum, were transiently transfected in a T175 Flask (4.5×10⁶ cells/flask) using the Monster Transfection Kit (Minis #MIR2906) according to manufacturers specifications.
- Transactivation Assay The Notch-CBF1 (C-promoter binding factor I) cell based transactivation assay is based on the ability of the released Notch intracellular domain fragments (NICDs) to function as transcription factors in conjunction with CBF1 and other nuclear factors. Luciferase assays were used to measure the antagonism of Notch-CBF1 transcriptional activity. HeLa cervical cancer cells are transiently co-transfected with pCDNA3.1/Hygro plasmids containing truncated Notch 1, Notch 2, Notch 3, or Notch 4 receptors and a PGL3 luciferase reporter vector containing 4 copies of CBF1 binding site. The cells were then tested for Notch-CBF1 activity in the absence or presence of test compounds. HeLa cells, maintained in DMEM (high glucose with HEPES), 1× glutamine/penicillin/streptomycin and 10% Fetal Bovine serum, were transiently transfected in a T175 Flask (4.5×10⁶ cells/flask) using the Monster Transfection Kit (Minis #MIR2906) according to manufacturers specifications.
- Rat P2X3 Receptor Inhibition Assay Rat P2X3 receptor gene (GenBank accession number NM_031075) was expressed in C6BU-1 cell. The cells stably expressing rat P2X3 were seeded in a 96-well microtiter plate at a concentration of 8000 cells/well and cultured in the medium (8.3% fetal bovine serum. 8.3% horse serum, 1% antibiotic and antifungal in DMEM) for one day at 37° C. under 5% carbon dioxide atmosphere. In transiently expressing system, the C6BU-1 cells were seeded in a 90-well microliter plate at a concentration of 2500 cells/well and cultured in the medium for one day at 37° C. under 5% carbon dioxide atmosphere. The plasmid was transfected into the cells using transfection reagent FuGENE6 (Roche). The transfected cells were cultured in the medium for one day at 37° C. under 5% carbon dioxide atmosphere. The medium was replaced with 4 μM Fluo-3-AM solution (pH 7.5) containing 20 mM HEPES, 137 mM NaCl, 2.7 mM KCl, 0.9 mM MgCl2, 5.0 mM CaCl2, 5.6 mM D-glucose, 2.5 mM probenecid, 10% BSA, and 0.08% Pluronic F-127, and incubated at 37° C. under 5% dioxide carbon atmosphere for one hour. The plate was washed with washing buffer (20 mM HEPES, 137 mM NaCl, 2.7 mM KCl, 0.9 mM MgCl2, 5.0 mM CaCl2, 5.6 mM D-glucose, 2.5 mM probenecid, pH 7.5), and each well was added with 40 μL of this buffer. The plate was placed in High-Throughput Screening System FDSS 3000 (Hamamatsu Photonics K.K.). Measurement of fluorescence intensity by FDSS 3000 was started, and 40 μL of DMSO solutions containing different concentrations of the test compound as prepared by dilution with dilution buffer (20 mM HEPES, 137 mM NaCl, 2.7 mM KCl, 0.9 mM MgCl2, 5.0 mM CaCl2, 5.6 mM D-glucose, 2.5 mM probenecid, 0.1% Pluronic F-127, pH 7.5) were dispensed to each well through the built-in automatic dispenser. Five minutes after, 50 mM ATP solution (50 μL) prepared by dilution with the dilution buffer was dispensed through the built-in automatic dispenser, and the measurement of fluorescence intensity was continued for 3 min. For each well, the specific maximum fluorescence intensity was calculated as the ratio of the maximum fluorescence intensity after addition of the ATP solution to the fluorescence intensity at the starting of the measurement. The 50% inhibitory concentration (IC50) was calculated under the assumption that the specific maximum fluorescence intensity without test compound is 0% inhibition and that the specific maximum fluorescence intensity when the dilution buffer was added in place of ATP solution is 100% inhibition, to evaluate the inhibitory activity of the test compound. FDSS software (Hamamatsu Photonics K.K.) was used for calculation of the specific maximum fluorescence intensity. IC50 was calculated using Microsoft Excel (Microsoft Corporation) and XLfit (idbs Ltd.).
- Beta2-AR Binding Assay HEK 293 cells stability transfected with cDNA encoding human beta2-AR (provided by Dr. Brian Kobilka, Stanford Medical Center, Palo Alto, Calif.) were grown in Dulbecco's Modified Eagle Medium (DMEM) containing 10% fetal bovine serum (FBS), 0.05% penicillin-streptomycin, and 400 g/ml G418 as previously described (Pauwels et al., Biochem. Pharmacol. 42: 1683-1689, 1991). The cells were scraped from the 150x25 mm plates and centrifuged at 500xg for 5 minutes. The pellet was homogenized in 50 mM Tris-HCl, pH 7.7, with a Polytron, centrifuged at 27,000xg, and resuspended in the same buffer. The latter process was repeated, and the pellet was resuspended in 25 mM Tris-HCl containing 120 mM NaCl, 5.4 mM KCl, 1.8 mM CaCl2, 0.8 mM MgCl2, and 5 mM glucose, pH 7.4. The binding assays contained 0.3 nM [3H]CGP-12177 in a volume of 1.0 ml. Nonspecific binding was determined by 1 uM propranolol.
- CYP3A4 Inhibition Assay The CYP3A4 inhibition assay was performed using human liver microsomes and testosterone 6'-hydroxylation as a P450 isoform-specific marker. In a total volume of 150 uL, 14C-testosterone at a final concentration of 40 uM in a 100 mM phosphate buffer (pH 7.4) was incubated in a 96-well plate with 0.3 mg/mL of human liver microsomes in an Eppendorf thermomixer at 37° C. and 400 rpm. A 1.0 uL-aliquot of the 150-fold concentrated compound stock solution, prepared in DMSO, was added to yield final inhibitor concentrations of 0, 0.1, 0.5, 1.0, 5.0, 10, 25, and 50 uM. The reaction was initiated by addition of 15 uL of the NADPH-regenerating system containing the glucose-6-phosphate dehydrogenase and terminated after 7 min with a 75 uL-aliquot of methanol. After centrifugation at 465 g and 4° C. for 20 min, a 50 uL-aliquot of the supernatant was submitted to HPLC according to the method described below.
- Calcium Mobilization Assay A monoclonal HEK-293 cell line stably transfected with a cDNA encoding for the human mGlu5a receptor was generated; for the work with mGlu5 Positive Allosteric Modulators (PAMs), a cell line with low receptor expression levels and low constitutive receptor activity was selected to allow the differentiation of agonistic versus PAM activity. Cells were cultured according to standard protocols (Freshney, 2000) in Dulbecco's Modified Eagle Medium with high glucose supplemented with 1 mM glutamine, 10% (vol/vol) heat-inactivated bovine calf serum, Penicillin/Streptomycin, 50 mg/ml hygromycin and 15 ug/ml blasticidin (all cell culture reagents and antibiotics from Invitrogen, Basel, Switzerland).About 24 hrs before an experiment, 5x10⁴ cells/well were seeded in poly-D-lysine coated, black/clear-bottomed 96-well plates. The cells were loaded with 2.5 uM Fluo-4AM in loading buffer (1xHBSS, 20 mM HEPES) for 1 hr at 37° C. and washed five times with loading buffer.
- Dose response biochemical High Throughput Screening assay for agonists of the steroid receptor coactivator 1 (SRC-1) recruitment by the peroxisome proliferator-activated receptor gamma (PPARgamma) Source (MLSCN Center Name): The Scripps Research Institute Molecular Screening Center Center Affiliation: The Scripps Research Institute (TSRI) Assay Provider: Pat Griffin, TSRI Network: Molecular Library Screening Center Network (MLSCN) Grant Proposal Number: 1 X01 MH079861-01 Grant Proposal PI: Patrick Griffin, Scripps Florida External Assay ID: PPARgSRC1_AG_TRFRET_1536_EC50 Name: Dose response biochemical High Throughput Screening assay for agonists of the steroid receptor coactivator 1 (SRC-1) recruitment by the peroxisome proliferator-activated receptor gamma (PPARgamma) Description: Peroxisome proliferator-activated receptors (PPARs) belong to the nuclear receptor superfamily and are lipid sensors functioning as ligand-dependent transcription factors regulating gene expression patterns of diverse biological processes [1, 2]. PPARs play a critical role in metabolic processes such as glucose metabolism, lipid metabolism, and have been implicated in anti-atherogenic, anti-inf
- Dose response biochemical High Throughput Screening assay for agonists of the steroid receptor coactivator 2 (SRC-2) recruitment by the peroxisome proliferator-activated receptor gamma (PPARgamma) Source (MLSCN Center Name): The Scripps Research Institute Molecular Screening Center Center Affiliation: The Scripps Research Institute (TSRI) Assay Provider: Pat Griffin, TSRI Network: Molecular Library Screening Center Network (MLSCN) Grant Proposal Number: 1 X01 MH079861-01 Grant Proposal PI: Pat Griffin, TSRI External Assay ID: PPARgSRC2_AG_TRFRET_1536_EC50 Name: Dose response biochemical High Throughput Screening assay for agonists of the steroid receptor coactivator 2 (SRC-2) recruitment by the peroxisome proliferator-activated receptor gamma (PPARgamma) Description: Peroxisome proliferator-activated receptors (PPARs) belong to the nuclear receptor superfamily and are lipid sensors functioning as ligand-dependent transcription factors regulating gene expression patterns of diverse biological processes [1, 2]. PPARs play a critical role in metabolic processes such as glucose metabolism, lipid metabolism, and have been implicated in anti-atherogenic, anti-inflammatory as we
- Dose response biochemical High Throughput Screening assay for agonists of the steroid receptor coactivator 3 (SRC-3) recruitment by the peroxisome proliferator-activated receptor gamma (PPARgamma) Source (MLSCN Center Name): The Scripps Research Institute Molecular Screening Center http://molscreen.florida.scripps.edu/ Center Affiliation: The Scripps Research Institute, TSRI Assay Provider: Pat Griffin, TSRI Network: Molecular Library Screening Center Network (MLSCN) Grant Proposal Number: 1 X01 MH079861-01 Grant Proposal PI: Pat Griffin, TSRI External Assay ID: PPARgSRC3_AG_TRFRET_1536_EC50 Name: Dose response biochemical High Throughput Screening assay for agonists of the steroid receptor coactivator 3 (SRC-3) recruitment by the peroxisome proliferator-activated receptor gamma (PPARgamma) Description: Peroxisome proliferator-activated receptors (PPARs) belong to the nuclear receptor superfamily and are lipid sensors functioning as ligand-dependent transcription factors regulating gene expression patterns of diverse biological processes [1, 2]. PPARs play a critical role in metabolic processes such as glucose metabolism, lipid metabolism, and have been implicated in anti
- Electrophysiology Assay The coverslip plated with cells was placed in the experiment chamber perfused with bath solution composed of (in mM): 135 NaCl, 5 KCl, 2 CaCl2, 1 MgCl2, 10 HEPES, 5 Glucose (pH 7.4). Patch pipettes with resistance between 2-5 Megaohms, when filled with a solution containing (in mM): 135 KCl, 1 EGTA, 1 MgCl2, 10 HEPES, 2 Na2ATP (pH 7.3), were used to form gigaseals. The cells were voltage clamped at −75 mV in whole-cell configuration using an Axopatch 200b or Multiclamp 700b (Molecular Devices) amplifier controlled by pClamp Software (Molecular Devices). The current was recorded by applying a voltage step to −120 mV every 10 seconds. For each compound, 4-6 concentrations were applied for 3-8 minutes in a successive manner starting with the lowest concentration. At the end of the experiment, the cells were perfused with bath solution containing 2 mM Ba2+ to isolate the contribution of hROMK current.
- FLIPR Assay Compounds were tested for their ability to inhibit C5a-mediated calcium mobilization using a stable cell line over expressing the human C5aR & the Galpha 15 protein on the FLIPR (Fluorescent Imaging Plate Reader) Tetra system. Cells were maintained in culture media containing DMEM (Dulbecco's Modified Eagle Medium) with 4.5 g/L glucose, 10% fetal bovine serum, 100 U/mL, 1x non-essential amino acid, and 250 ug/mL G418 (Geneticin). Prior to testing of compounds, cells were plated at 10,000 cells/well in clear bottom 384-well black plate, and incubated overnight at 37C. with 5% CO2. On the day of experiment, culture media was removed, and replaced with assay buffer HBSS (Hanks' Balanced Salt Solution) with 20 mM HEPES (4-(2-hydroxyethyl)-1-piperazineethanesulfonic acid) and 0.1% BSA (bovine serum albumin) BSA containing calcium 5 dye (Molecular Devices) and 2.5 mM probenecid. After 1 hour incubation at 37C., 5% CO2 for 60 min, cells were pre-incubated with compounds for 30 minutes.
- FlexStation-Ca2+ Influx Assay On the day of the assay, after removal of the growth media, the cells were washed once with an assay buffer (7 mM Tris-Cl, 20 mM HEPES, 20 mM NaCl, 5 mM KCl, 0.8 mM MgSO4, 4 mM CaCl2, 120 mM NMDG, 5 mM D-glucose, pH 7.4), followed by addition of about 100 ul per well of a Calcium-3 dye diluted with the assay buffer, and storage at room temperature for about 1 hour. A test compound (10 mM stock in 100% dimethyl sulfoxide (DMSO)) was diluted with the assay buffer to various concentrations, from the highest at about 40 μM to be lower by ⅓, and PNU-120596 (available from Sigma) for amplifying Ca2+ permeability signaling was diluted to about 30 μM with the assay buffer. Epibatidine (available from Sigma) in a final concentration of about 1 μM was used as a positive control group.
- Functional Uptake Assay (rNET) Quantification of norepinephrine uptake was performed using synaptosomes isolated in a 0.32 M sucrose buffer from a male Wistar rat hypothalamus. The uptake of radiolabelled norepinephrine by synaptosomes (100 ug of proteins/point) was allowed by incubating them for 20 minutes at 37° C. in presence of test compounds and [3H]-norepinephrine (0.1 uCi/point). The experiment was performed in a deep well. Synaptosomes and [3H]-norepinephrine were prepared in a Krebs buffer pH 7.4 containing 25 mM NaHCO3, 11 mM glucose and 50 uM ascorbic acid. This incubation buffer was oxygenated for 5 minutes before incubation. Basal control was incubated for 20 minutes at 4° C. in order to avoid any uptake. Following this incubation, the uptake was stopped by filtration through a unifilter 96-wells GFB Packard plate washed with Krebs buffer containing 25 mM NaHCO3 in order to eliminate the free [3H]-norepinephrine.
- Glutamine Uptake The glutamine uptake assays in HEK293 cells were carried out in 96 well plates (CulturPlate-96, Perkin Elmer). Cells were plated at a density of 35,000 cells per well 24 hours prior to carrying out the assay. Each set of conditions is carried out in triplicate. The wells are washed three times with 100 uL of assay buffer at pH 6.0 (containing 137 mM NaCl, 5.1 mM KCl, 0.77 mM KH2PO4, 0.71 mM MgSO4.7H2O, 1.1 mM CaCl2, 10 mM D-glucose, and 10 mM HEPES). 1H-glutamine (500 nM) in the same buffer is added along with inhibitor and allowed to incubate for 15 min at 37° C. Following incubation, the H-glutamine/inhibitor is removed and the cells are washed three times with buffer. The cells are then lysed by the addition of 50 uL 1M NaOH. 150 uL of scintillation fluid (Microscint 40, Perkin Elmer) is added and the plates are counted on a scintillation counter (Topcount, Perkin Elmer).
- HEK-Blue TLR7 reporter assay Engineered human embryonic kidney blue cells (HEK-Blue TLR cells; Invivogen) possessing a human TLR7-secreted embryonic alkaline phosphatase (SEAP) reporter transgene were suspended in a non-selective, culture medium (DMEM high-glucose (Invitrogen), supplemented with 10% fetal bovine serum (Sigma)). HEK-Blue TLR7 cells were added to each well of a 384-well tissue-culture plate (15,000 cells per well) and incubated 16-18 h at 37° C., 5% CO2. Compounds (100 nl) were dispensed into wells containing the HEK-Blue TLR cells and the treated cells were incubated at 37° C., 5% CO2. After 18 h treatment ten microliters of freshly-prepared Quanti-Blue reagent (Invivogen) was added to each well, incubated for 30 min (37° C., 5% CO2) and SEAP levels measured using an Envision plate reader (OD=620 nm). The half maximal effective concentration values (EC50; compound concentration which induced a response halfway between the assay baseline and maximum) were calculated.
- Inhibition Assay All currents were recorded in whole-cell configuration using EPC-9 and EPC-10 amplifiers and Patchmaster software (HEKA) or similar. Patch pipettes had a resistance of 1.5-3 M and up to 75% of the series resistance was compensated. The standard pipette solution consisted of 140 mM CsAsp, 10 mM EGTA, 10 mM HEPES, 2.27 mM, 20 MgCl2, 1.91 mM CaCl2, and up to 0.3 mM Na2GTP, with pH adjusted to 7.2 with CsOH. In addition, a solution containing 145 mM CsCl, 10 mM HEPES, 10 mM EGTA, and up to 0.3 mM Na2GTP and 1 mM MgCl2 (pH 7.2 adjusted with CsOH) can be used. The standard bath solution contained 150 mM NaCl, 10 mM HEPES, 10 mM glucose, 4.5 mM KCl, 1 mM EGTA, 3 mM MgCl2, with pH adjusted to 7.4 with NaOH. In some instances, 2 mM CaCl2 was added in place of EGTA and the concentration of MgCl2 was reduced to 1 mM.
- Inhibition Assay Assay compound plates were prepared by diluting the compounds of formula (I) with chloride-free buffer (125 mM Na-gluconate, 4.8 mM K-gluconate, 1.3 mM Ca-gluconate, 1.2 mM KH2PO4, 1.2 mM MgSO4, 5.6 mM D-glucose, 25 mM HEPES, pH 7.4 with NaOH) in 100% DMSO to a final concentration of 1% DMSO. [14C]-Uric Uric acid working stock was made by addition of radiolabeled compound to a final concentration of 120 nM in chloride-free buffer. In all wells, the final assay concentration of solvent (DMSO) was 0.25%; the final assay concentration of [14C]-uric acid was 30 nM in chloride-free buffer and the final compound of formula (I) concentrations ranged from 0 to 10 uM. The vehicle comparator was DMSO (i.e. no inhibition of uric acid transport) and the pharmacological blockade (i.e. 100% inhibition of uric acid transport) was defined by benzbromarone at 10 uM final assay concentration.After pre-incubation, cells were washed with 50 uL of chloride-free buffer.
- Inhibition Assay Test Example 5: The hERG potassium current was measured in a hERG-stably-expressing Chinese hamster ovary K1 (CHO) cells. The experiments were performed using an automated planar patch-clamp system QPatch HTX (Sophion Bioscience A/S). The application of pressure for forming gigaseals and whole-cell patch clamp configuration were established using the QPatch assay software. Patch-clamp experiments were performed in voltage-clamp mode and whole-cell currents were recorded. The following stimulation protocol was applied to investigate the effects of compounds on hERG potassium channel. The test solution includes:Extracellular solution: 2 mM of CaCl2, 1 mM of MgCl2, 10 mM of HEPES, 4 mM of KCl, 145 mM of NaCl, and 10 mM of glucose; and pH adjusted to 7.4 with NaOH,Intracellular solution: 5.374 mM of CaCl2, 1.75 mM of MgCl2, 10 mM of HEPES, 10 mM of EGTA, 120 mM of KCl, and 4 mM of ATP, and pH adjusted to 7.2 with KOH.
- Inhibition Assay The ability of the substances to inhibit the SGLT-2 activity may be demonstrated in a test set-up in which a CHO-K1 cell line (ATCC No. CCL 6 1) or alternatively an HEK293 cell line (ATCC No. CRL-1573) is stably transfected with an expression vector pZeoSV (Invitrogen, EMBL accession number L36849) which contains the cDNA for the coding sequence of the human sodium glucose co-transporter 2 (Genbank Ace. No. NM003041) (CHO-hSGLT2 or HEK-hSGLT2). These cell lines transport 14C-labelled alpha-methyl-glucopyranoside (14C-AMG, Amersham) into the interior of the cell in sodium-dependent manner.The SGLT-2 assay is carried out as follows: CHO-hSGLT2 cells are cultivated in Ham's F12 Medium (BioWhittaker) with 10% foetal calf serum and 250 ug/mL zeocin (Invitrogen), and HEK293-hSGLT2 cells are cultivated in DMEM medium with 10% foetal calf serum and 250 ug/mL zeocin (Invitrogen). The cells are detached from the culture flasks by washing twice with PBS.
- Intracellular Ca2+ Mobilization Assay A monoclonal HEK-293 cell line stably transfected with a cDNA encoding for the human mGlu5a receptor was generated; for the work with mGlu5 Positive Allosteric Modulators (PAMs), a cell line with low receptor expression levels and low constitutive receptor activity was selected to allow the differentiation of agonistic versus PAM activity. Cells were cultured according to standard protocols (Freshney, 2000) in Dulbecco's Modified Eagle Medium with high glucose supplemented with 1 mM glutamine, 10% (vol/vol) heat-inactivated bovine calf serum, Penicillin/Streptomycin, 50 ug/ml hygromycin and 15 ug/ml blasticidin (all cell culture reagents and antibiotics from Invitrogen, Basel, Switzerland).About 24 hrs before an experiment, 5x10⁴ cells/well were seeded in poly-D-lysine coated, black/clear-bottomed 96-well plates. The cells were loaded with 2.5 uM Fluo-4AM in loading buffer (1xHBSS, 20 mM HEPES) for 1 hr at 37° C. and washed five times with loading buffer.
- Luminescence-based cell-based assay provider high throughput dose response assay for partial agonists of the peroxisome proliferator-activated receptor gamma (PPARg) Source (MLPCN Center Name): The Scripps Research Institute Molecular Screening Center (SRISMC) Center Affiliation: The Scripps Research Institute, TSRI Assay Provider: Patrick Griffin, TSRI Network: Molecular Library Probe Production Center Network (MLPCN) Grant Proposal Number: MH079861-01 Grant Proposal PI: Patrick Griffin, TSRI External Assay ID: PPARG_AG_LUMI_0384_3XEC50 DRUN Name: Luminescence-based cell-based assay provider high throughput dose response assay for partial agonists of the peroxisome proliferator-activated receptor gamma (PPARg). Description: Peroxisome proliferator-activated receptors (PPARs) belong to the nuclear receptor superfamily and are lipid sensors functioning as ligand-dependent transcription factors regulating gene expression patterns of diverse bHeres what I wrote for the intro.iological processes (1, 2). PPARs play a critical role in metabolic processes such as glucose metabolism, lipid metabolism, and have been implicated in anti-atherogenic, anti-
- Nav1.5 Assay To assess the potential cardiac liability of compounds at an early stage in the drug discovery process, a Nav1.5 sodium channel screening assay was be performed on Molecular Device's PatchXpress™ automated electrophysiology platform. Under voltage-clamp conditions, Nav1.5 currents were recorded from HEK cells expressing the human Nav1.5 channel in the absence and presence of increasing concentrations of the test compound to obtain an IC50 value. The external recording solution contained (in mM): 90 TEACl, 50 NaCl, 1.8 CaCl, 1 MgCl2, 10 HEPES, 10 glucose, adjusted to pH 7.4 with TEA-OH and to 300 mOsm with sucrose (if necessary), while the internal patch pipette solution contained (in mM): 129 CsF, 2 MgCl2, 11 EGTA, 10 HEPES, 3 Na2ATP adjusted to pH 7.2 with CsOH and to 290 mOsm with sucrose (if necessary). Nav1.5 channel currents were evoked using a cardiac action potential waveform at 1 Hz, digitized at 31.25 kHz and low-pass filtered at 12 kHz.
- Radioligand Binding Assay Membrane Preparation and Radioligand Binding. HEK-293 cells stably expressing mouse TAA 1 were maintained at 37 C and 5% C02 in DMEM high glucose medium, containing fetal calf serum (10%, heat inactivated for 30 min at 56 C), penicillin/streptomycin (1%), and 375 ug/ml geneticin (Gibco). Cells were released from culture flasks using trypsin/ EDTA, harvested, washed twice with ice-cold PBS (without Ca2+ and Mg2+), pelleted at 1,000 rpm for 5 min at 4 C, frozen and stored at -80 C. Frozen pellets were suspended in 20 ml HEPES-NaOH (20 mM, pH 7.4) containing 10 mM EDTA and homogenized with a Polytron (PT 6000, Kinematica) at 14,000 rpm for 20 s. The homogenate was centrifuged at 48,000 x g for 30 min at 4 C. Subsequently, the supernatant was removed and discarded, and the pellet resuspended in 20 ml HEPES-NaOH (20 mM, pH 7.4) containing 0.1 mM EDTA using the Polytron (20 s at 14,000 rpm).
- SGLT1 Inhibition Assay For sodium-dependent glucose transport assay, cells expressing hSGLT1 were seeded into a 96-well culture plate at a density of 5×10⁴ cells/well in RPMI medium 1640 containing 10% fetal bovine serum. The cells were used 1 day after plating. They were incubated in pretreatment buffer (10 mM HEPES, 5 mM Tris, 140 mM choline chloride, 2 mM KCl, 1 mM CaCl2, and 1 mM MgCl2, pH 7.4) at 37 °C. for 10 min. They were then incubated in uptake buffer (10 mM HEPES, 5 mM Tris, 140 mM NaCl, 2 mM KCl, 1 mM CaCl2, 1 mM MgCl2, and 1 mM 14C-nonlabeled AMG pH 7.4) containing 14C-labeled (8 μM) and inhibitor or dimethyl sulfoxide (DMSO) vehicle at 37 °C. for 2 h. Cells were washed twice with washing buffer (pretreatment buffer containing 10 mM AMG at room temperature) and then the radioactivity was measured using a liquid scintillation counter.
- SGLT2 Inhibition Assay For sodium-dependent glucose transport assay, cells expressing hSGLT2 were seeded into a 96-well culture plate at a density of 5×10⁴ cells/well in RPMI medium 1640 containing 10% fetal bovine serum. The cells were used 1 day after plating. They were incubated in pretreatment buffer (10 mM HEPES, 5 mM Tris, 140 mM choline chloride, 2 mM KCl, 1 mM CaCl2, and 1 mM MgCl2, pH 7.4) at 37 °C. for 10 min. They were then incubated in uptake buffer (10 mM HEPES, 5 mM Tris, 140 mM NaCl, 2 mM KCl, 1 mM CaCl2, 1 mM MgCl2, and 1 mM 14C-nonlabeled AMG pH 7.4) containing 14C-labeled AMG (8 μM) and the inventive compound or dimethyl sulfoxide (DMSO) vehicle at 37 °C. for 2 h. Cells were washed twice with washing buffer (pretreatment buffer containing 10 mM AMG at room temperature) and then the radioactivity was measured using a liquid scintillation counter.
- TLR7 Agonist Activity Assay Engineered human embryonic kidney blue cells (HEK-Blue TLR cells; Invivogen) possessing a human TLR7-secreted embryonic alkaline phosphatase (SEAP) reporter transgene were suspended in a non-selective, culture medium (DMEM high-glucose (Invitrogen), supplemented with 10% fetal bovine serum (Sigma)). HEK-Blue TLR7 cells were added to each well of a 384-well tissue-culture plate (15,000 cells per well) and incubated 16-18 h at 37° C., 5% CO2. Compounds (100 nl) were dispensed into wells containing the HEK-Blue TLR cells and the treated cells were incubated at 37° C., 5% CO2. After 18 h treatment ten microliters of freshly-prepared Quanti-Blue reagent (Invivogen) was added to each well, incubated for 30 min (37° C., 5% CO2) and SEAP levels measured using an Envision plate reader (OD=620 nm). The half maximal effective concentration values (EC50; compound concentration which induced a response halfway between the assay baseline and maximum) were calculated.
- TREK-1 Manual Patch Clamp (hMPC) assay TBDCHO-K1 cells stably expressing human TREK-1 or HEK293 cells stably expressing human TREK-2 are plated on glass coverslips, and voltage clamped in the whole-cell configuration of the patch clamp technique. Cells were voltage clamped at a holding potential of −80 mV and the stepped to 0 mV for 500 msec. The voltage was subsequently ramped from −120 mV to +80 mV over a 500 msec duration. This step-ramp protocol was repeated every 10 sec. The bathing solution contained the following: 135 mM NaCl, 5 mM KCl, 2 mM CaCl2, 1 mM MgCl2, 5 mM D-Glucose, 10 mM HEPES, 10 mM sucrose (adjusted to pH 7.4 with NaOH, 300 mosmol/kg H2O). The pipette solution contained the following: 135 mM KCl, 2 mM MgCl2, 1 mM EGTA, 10 mM HEPES, 2 mM Na 2 ATP (adjusted to pH 7.35 with KOH, 285 mosmol/kg H2O).
- YFP-Halide Influx Assay for the CFTR-WT For this purpose, HEK293 cells are transfected with plasmid DNA containing WT CFTR and seeded in 96 well plates (70,000 HEK cells/well). Two days after transfection, cells are treated with test compounds.The CFTR channels are activated by treatment with the cAMP inducer forskolin (10.67 μM) and a dose response of test compounds in 1×D-PBS (from Gibco, Cat n#14090-091) for 20 minutes prior to addition of an F solution (137 mM NaI, 2.7 mM KI, 1.76 mM KH2PO4, 10.1 mM Na2HPO4, 5 mM glucose). The I− induced quenching of fluorescence is recorded immediately after injection of for 7 seconds. The impact of a compound on the channel functionality can be measured by looking at the effect on fluorescence, and is expressed as (1-(fluorescence after 7 seconds (F)/fluorescence before injection (F0))) and an EC50 can be derived from a (1−F/F0) vs compound concentration plot.
- [3H]-2-Deoxy-D-glucose ([3H]-2-DG) Uptake Assay The stably transfected CHO cells were seeded in poly 24-well plates and were grown to 80−90% confluence. Cells were rinsed with PBS buffer and incubated in 280 μL of PBS buffer containing 61.73 μM [3H]-2-DG (PerkinElmer, Boston, MA) in the presence and absence of 50 μM test compound for 5 min. The known hGLUT1 inhibitor phloretin (Accela ChemBio, San Diego, CA) was included as a positive control. Nonradiolabeled 2-DG (40 mM) (Sigma, St. Louis, MO) was included inorder to calculate specific inhibition of predicted inhibitors. Compounds were obtained from the National Cancer Institute (NCI) or purchased from commercial vendors. The reaction was terminated by washing cells twice with ice-cold PBS, followed by the addition of 200 μL of lysis buffer (0.1% (w/v) SDS, 0.1 N NaOH).Intracellular radioactivity was determined by scintillation counting.
- Biological Assay (HTS) NMDA receptors are ion channels that are highly permeable to Ca2+ ions, rendering it possible to monitor NMDA receptor function using cell-based calcium flux assay. In this assay, co-agonists glutamate and glycine are added to cells heterologously expressing human GluN1/GluN2B NMDA receptors to initiate cellular Ca2+ influx. The time course of the changes in intracellular calcium is measured using a fluorescent dye and a FLIPR (Fluorometric Imaging Plate Reader) device. Twenty four hours before measurements, the expression of the NMDA receptors in the stable cell line is induced with Tet-On inducible system in the presence of a non-selective NMDA receptor blocker. On the day of the experiment, cell culture media is carefully washed and the cells are loaded with Calcium 5 Dye Kit (Molecular Devices) in dye loading buffer containing 137 mM NaCl, 4 mM KCl, 2 mM CaCl2), 1.5 mM MgCl2, 10 mM HEPES and 5 mM D-glucose; pH 7.4. After 1 h incubation at the room temperature, the dye is washed away with the assay buffer (150 mM, 3 mM, 2 mM CaCl2), 0.01 mM EDTA, 10 mM HEPES and 5 mM D-glucose; pH 7.4) In the FLIPR TETRA reader, various concentrations of the test compounds are added to the cells for 5 min while fluorescence is monitored to detect potential agonist activity. Next, co-agonists, glutamate and glycine are added for another 5 minutes. The concentration of glutamate corresponding to EC40 is used to maximize the assay's signal window and ability to detect NMDA receptor antagonists and negative allosteric modulators. A saturating concentration (10 μM) of glycine is also present in the assay. A non-selective NMDA receptor antagonist, (+)MK-801 is used as a positive control for antagonist activity. The fluorescent signal in the presence of test compounds is quantified and normalized to the signal defined by the appropriate control wells.
- Biological Assay (standard) NMDA receptors are ion channels that are highly permeable to Ca2+ ions, rendering it possible to monitor NMDA receptor function using cell-based calcium flux assay. In this assay, co-agonists glutamate and glycine are added to cells heterologously expressing human GluN1/GluN2B NMDA receptors to initiate cellular Ca2+ influx. The time course of the changes in intracellular calcium is measured using a fluorescent dye and a FLIPR (Fluorometric Imaging Plate Reader) device.Twenty four hours before measurements, the expression of the NMDA receptors in the stable cell line is induced with Tet-On inducible system in the presence of a non-selective NMDA receptor blocker. On the day of the experiment, cell culture media is carefully washed and the cells are loaded with Calcium 5 Dye Kit (Molecular Devices) in dye loading buffer containing 137 mM NaCl, 4 mM KCl, 2 mM CaCl2), 0.5 mM MgCl2, 10 mM HEPES and 5 mM D-glucose; pH 7.4. After 1 h incubation at the room temperature, the dye is washed away with the assay buffer (137 mM NaCl, 4 mM KCl, 2 mM CaCl2), 0.01 mM EDTA, 10 mM HEPES and 5 mM D-glucose; pH 7.4) In the FLIPR TETRA reader, various concentrations of the test compounds are added to the cells for 5 min while fluorescence is monitored to detect potential agonist activity. Next, co-agonists, glutamate and glycine are added for another 5 minutes. The concentration of glutamate corresponding to ~EC40 used to maximize the assay's signal window and ability to detect NMDA receptor antagonists and negative allosteric modulators. A saturating concentration (10 μM) of glycine is also present in the assay. A non-selective NMDA receptor antagonist, (+)MK-801 is used as a positive control for antagonist activity. The fluorescent signal in the presence of test compounds is quantified and normalized to the signal defined by the appropriate control wells.
- Cell-Based Assay of NHE3 Activity under Persistent Conditions The ability of compounds to inhibit Rat NHE3-mediated Na+-dependent H+ antiport after application and washout was measured using a modification of the pH sensitive dye method described above. Opossum kidney (OK) cells were obtained from the ATCC and propagated per their instructions. The rat NHE3 gene was introduced into OK cells via electroporation, and cells were seeded into 96 well plates and grown overnight. Medium was aspirated from the wells, cells were washed twice with NaCl-HEPES buffer (100 mM NaCl, 50 mM HEPES, 10 mM glucose, 5 mM KCl, 2 mM CaCl2, 1 mM MgCl2, pH 7.4), then overlayed with NaCl-HEPES buffer containing 0-30 μM test compound.After a 60 min incubation, the test drug containing buffer was aspirated from the cells, cells were washed twice with NaCl-HEPES buffer without drug, then incubated for 30 min at room temperature with NH4Cl-HEPES buffer (20 mM NH4Cl, 80 mM NaCl, 50 mM HEPES, 5 mM KCl, 2 mM CaCl2, 1 mM MgCl2, pH 7.4) containing 5 uM BCECF-AM. Cells were washed twice with Ammonium free, Natfree HEPES (100 mM choline, 50 mM HEPES, 10 mM glucose, 5 mM KCl, 2 mM CaCl2, 1 mM MgCl2, pH 7.4) and incubated in the same buffer for 10 minutes at room temperature to lower intracellular pH. NHE3-mediated recovery of neutral intracellular pH was initiated (40 min after compound washout) by addition of Na-HEPES buffer containing 0.4 uM ethyl isopropyl amiloride (EIPA, a selective antagonist of NHE-1 activity that does not inhibit NHE3), and monitoring the pH sensitive changes in BCECF fluorescence (λex 505 nm, λem, 538 nm) normalized to the pH insensitive BCECF fluorescence (λex 439 nm, λem, 538 nm). Initial rates were plotted as the average 2 or more replicates, and pIC50 values w
- Cell-based activity under Prompt Conditions Cell-based activity under Prompt Conditions. Rat or human NHE3-mediated Na+-dependent H+ antiport was measured using a modification of the pH sensitive dye method originally reported by Paradiso (PNAS USA. 81:7436-7440, 1984). Opossum kidney (OK) cells were obtained from the ATCC and propagated per their instructions. The rat NHE3 gene (GenBank M85300) or the human NHE3 gene (GenBank NM_004174.1) was introduced into OK cells via electroporation, and cells were seeded into 96 well plates and grown overnight. Medium was aspirated from the wells, cells were washed twice with NaCl-HEPES buffer (100 mM NaCl, 50 mM HEPES, 10 mM glucose, 5 mM KCl, 2 mM CaCl2, 1 mM MgCl2, pH 7.4), then incubated for 30 min at room temperature with NH4Cl-HEPES buffer (20 mM NH4Cl, 80 mM NaCl, 50 mM HEPES, 5 mM KCl, 2 mM CaCl2, 1 mM MgCl2, pH 7.4) containing 5 μM bis(acetoxymethyl) 3,3′-(3′,6′-bis(acetoxymethoxy)-5-((acetoxymethoxy)carbonyl)-3-oxo-3H-spiro[isobenzofuran-1,9′-xanthene]-2′,7′-diyl)dipropanoate (BCECF-AM).Cells were washed twice with Ammonium free, Na+-free HEPES (100 mM choline, 50 mM HEPES, 10 mM glucose, 5 mM KCl, 2 mM CaCl2, 1 mM MgCl2, pH 7.4) and incubated in the same buffer for 10 minutes at room temperature to lower intracellular pH. NHE3-mediated recovery of neutral intracellular pH was initiated by addition of Na-HEPES buffer containing 0.4 μM ethyl isopropyl amiloride (EIPA, a selective antagonist of NHE-1 activity that does not inhibit NHE3) and 0-30 μM test compound, or a pharmaceutically acceptable salt thereof, and monitoring the pH sensitive changes in BCECF fluorescence (λex 505 nm, λem, 538 nm) normalized to the pH insensitive BCECF fluorescence (λex 439 nm, λem, 538 nm). Initial rates were plotted as the average 2 or more replicates, and pIC50 values were estimated using GraphPad Prism.
- Electrophysiology Assay HEK293 cells were cultured in DMEM with 4.5 g L-1 glucose, L-glutamine, and sodium pyruvate (Mediatech) containing 10% (v/v) FBS (Axenia BioLogix) and 1% (v/v) penicillin-streptomycin, at 37° C. and with 5% CO2. Cells were lifted with trypsin-EDTA (Life Technologies) and passaged to 6-well plates (Warner Instruments) 3-4 d before recording. Transient transfection was performed with Lipofectamine 2000 (Thermo Fisher Scientific) 2 days before recording. The plasmids of human Kir6.2 and SUR1 were the gift from Dr. Show-Ling Shyng (Oregon Health and Science University), and we fused mCherry fluorescent protein to the C-terminus of Kir6.2. The vector ratio for co-transfection of Kir6.2 to SUR1 was 1:10. Before recording, cells were lifted with trypsin-EDTA, kept in modified Tyrode's saline (140 mM NaCl, 5 mM KCl, 10 mM HEPES, 2 mM CaCl2), 1 mM MgCl2, 10 mM glucose, pH 7.2 ˜ 7.3 with HCl), and were used within 8 hours. For recording, an aliquot of cells was transferred to a recording chamber on a Nikon-TE2000 Inverted Scope (Nikon Instruments), and transfection was confirmed with fluorescent microscopy. The pipette solution contained: 145 mM KCl, 1 mM MgCl2, 5 mM EGTA, 2 mM CaCl2), 20 mM HEPES, 0.3 mM K2-ATP and 0.3 mM K2-ADP. Patch borosilicate pipettes (Sutter Instrument) were pulled from a Sutter P-97 puller with resistances of 2-3 MΩ. Data were acquired using a Axopatch 200B amplifier controlled by Clampex 10.2 via Digidata 1550 Å (Axon Instruments), sampled at 10 kHz, filtered at 2 kHz. Membrane capacitance was around 15 pF. Rs was around 5 MΩ. The membrane potential was held at −80 mV and a ramp to +80 mV (1 mV/ms) was applied every second. Bath was switched to 150 mM KCl, 10 mM HEPES, 2 mM CaCl2), and the chemical to be tested was dissolved in it and puffed with VC3-8xP pressurized perfusion system (ALA Science).
- NMDA receptor FLIPR assay NMDA receptors are ion channels that are highly permeable to Ca2+ ions, rendering it possible to monitor NMDA receptor function using cell-based calcium flux assay. In this assay, co-agonists glutamate and glycine are added to cells heterologously expressing human GluN1/GluN2B NMDA receptors to initiate cellular Ca2+ influx. The time course of the changes in intracellular calcium is measured using a fluorescent dye and a FLIPR (Fluorometric Imaging Plate Reader) device.Twenty four hours before measurements, the expression of the NMDA receptors in the stable cell line is induced with Tet-On inducible system in the presence of a non-selective NMDA receptor blocker. On the day of the experiment, cell culture media is carefully washed and the cells are loaded with Calcium 5 Dye Kit (Molecular Devices) in dye loading buffer containing 149 mM NaCl, 4 mM KCl, 2 mM CaCl2, and 1.5 mM MgCl2, 10 mM HEPES and 5 mM D-glucose; pH 7.4. After 1 h incubation at the room temperature, the dye is washed away with the assay buffer (149 mM NaCl (standard assay) or 150 mM (HTS assay), 4 mM KCl (standard assay) or 3 mM (HTS assay), 2 mM CaCl2, 0.01 mM EDTA, 10 mM HEPES and 5 mM D-glucose; pH 7.4) In the FLIPR TETRA reader, various concentrations of the test compounds are added to the cells for 5 min while fluorescence is monitored to detect potential agonist activity. Next, co-agonists, glutamate and glycine are added for another 5 minutes. The concentration of glutamate corresponding to EC80 (standard assay) or EC40 (HTS assay) is used to maximize the assay's signal window or the ability to detect NMDA receptor antagonists and negative allosteric modulators, respectively. A saturating concentration (10 μM) of glycine is also present in the assay. A non-selective NMDA receptor antagonist, (+)MK-801 is used as a positive control for antagonist activity. The fluorescent signal in the presence of test compounds is quantified and normalized to the signal defined by the appropriate control wells.
- NR2B standard assay NMDA receptors are ion channels that are highly permeable to Ca2+ ions, rendering it possible to monitor NMDA receptor function using cell-based calcium flux assay. In this assay, co-agonists glutamate and glycine are added to cells heterologously expressing human GluN1/GluN2B NMDA receptors to initiate cellular Ca2+ influx. The time course of the changes in intracellular calcium is measured using a fluorescent dye and a FLIPR (Fluorometric Imaging Plate Reader) device.Twenty four hours before measurements, the expression of the NMDA receptors in the stable cell line is induced with Tet-On inducible system in the presence of a non-selective NMDA receptor blocker. On the day of the experiment, cell culture media is carefully washed and the cells are loaded with Calcium 5 Dye Kit (Molecular Devices) in dye loading buffer containing 149 mM NaCl, 4 mM KCl, 2 mM CaCl2, and 1.5 mM MgCl2, 10 mM HEPES and 5 mM D-glucose; pH 7.4. After 1 h incubation at the room temperature, the dye is washed away with the assay buffer (149 mM NaCl (standard assay) or 150 mM (HTS assay), 4 mM KCl (standard assay) or 3 mM (HTS assay), 2 mM CaCl2, 0.01 mM EDTA, 10 mM HEPES and 5 mM D-glucose; pH 7.4) In the FLIPR TETRA reader, various concentrations of the test compounds are added to the cells for 5 min while fluorescence is monitored to detect potential agonist activity. Next, co-agonists, glutamate and glycine are added for another 5 minutes. The concentration of glutamate corresponding to EC80 (standard assay) or EC40 (HTS assay) is used to maximize the assay's signal window or the ability to detect NMDA receptor antagonists and negative allosteric modulators, respectively. A saturating concentration (10 μM) of glycine is also present in the assay. A non-selective NMDA receptor antagonist, (+)MK-801 is used as a positive control for antagonist activity. The fluorescent signal in the presence of test compounds is quantified and normalized to the signal defined by the appropriate control wells.
- Rat P2X3 Receptor Inhibition RSA Assay Rat P2X3 receptor gene (GenBank accession number NM_031075) was expressed in C6BU-1 cell. The cells stably expressing rat P2X3 were seeded in a 96-well microtiter plate at a :concentration of 8000 cells/well and cultured in the medium (8.3% fetal bovine serum, 8.3% horse serum, 1% antibiotic and antifungal in DMEM) for one day at 37° C. under 5% carbon dioxide atmosphere. In transiently expressing system, the C6BU-1 cells were seeded in a 96-well microtiter plate at a concentration of 2500 cells/well and cultured in the medium for one day at 37° C. under 5% carbon dioxide atmosphere. The plasmid was transfected into the cells using transfection reagent FuGENE6 (Roche). The transfected cells were cultured in the medium for one day at 37° C. under 5% carbon dioxide atmosphere. The medium was replaced with 4 μM Fluo-3-AM solution (pH 7.5) containing 20 mM HEPES, 137 mM NaCl, 2.7 mM KCl, 0.9 mM MgCl2, 5.0 mM CaCl2, 5.6 mM D-glucose, 2.5 mM probenecid, 10% BSA, and 0.08% Pluronic F-127, and incubated at 37° C. under 5% carbon dioxide atmosphere for one hour. The plate was washed with washing buffer (20 mM HEPES, 137 mM NaCl, 2.7 mM KCl, 0.9 mM MgCl2, 5.0 mM CaCl2, 5.6 mM D-glucose, 2.5 mM probenecid, pH 7.5), and each well was added with 40 μL of this buffer. The plate was placed in High-Throughput Screening System FDSS 3000 (Hamamatsu Photonics K.K.). Measurement of fluorescence intensity by FDSS 3000 was started, and 40 μL of DMSO solutions containing 1% RSA (final concentrations) and different concentrations of the test compound as prepared by dilution with dilution buffer (20 mM HEPES, 137 mM NaCl, 2.7 mM KCl, 0.9 mM MgCl2, 5.0 mM CaCl2, 5.0 mM D-glucose, 2.5 mM probenecid, 0.1% Pluronic F-127, pH 7.5) were dispensed to each well through the built-in automatic dispenser. Five minutes after, 50 nM ATP solution (50 μL) prepared by dilution with the dilution buffer was dispensed through the built-in automatic dispenser, and the measurement of fluorescence intensity was continued for 3 min. For each well, the specific maximum fluorescence intensity was calculated as the ratio of the maximum fluorescence intensity after addition of the ATP solution to the fluorescence intensity at the starting of the measurement. The 50% inhibitory concentration (IC50) was calculated under the assumption that the specific maximum fluorescence intensity without test compound is 0% inhibition and that the specific maximum fluorescence intensity when the dilution buffer was added in place of ATP solution is 100% inhibition, to evaluate the inhibitory activity of the test compound. FDSS software (Hamamatsu Photonics K.K.) was used for calculation of the specific maximum fluorescence intensity. IC50 was calculated using Microsoft Excel (Microsoft Corporation) and XLfit (idbs Ltd.).
- Binding Assay Fluorescent Imaging Plate Reader (FLIPR) assay: Briefly, 293-human or mouse P2X7 stable cells were incubated in sucrose buffer, pH 7.4 [KCl (5 mM), NaH2PO4.2H2O (9.6 mM), HEPES (25 mM), sucrose (280 mM), glucose (5 mM), CaCl2 (0.5 mM), and probenecid (0.1425 g in 3 mL 1N NaOH was added for 500 mL solution)] in 384-well plates.293-rat P2X7 stable cells were incubated in HHPB (pH 7.4) [consisting of Hank's BSS (1×); HEPES (pH 7.4) (20 mM) (Sigma); probenecid (0.710g/5 mL 1N NaOH) (Sigma); and BSA (0.05%) (Roche) which was added after the pH had been adjusted] in 384-well plates. Fluo-4 NW dye mix (Molecular Probes, Inc., Eugene, Oreg., USA) was prepared in buffer (see manufacturer's instructions). Cell plates were removed from the 37° C. incubator, the media discarded and then 30 μL of dye was added to each well. Plates were placed in the 37° C., non-CO2 incubator for 30 minutes and then room temperature for 30 minutes.
- Biological Activity of Disclosed Compounds In Vitro The ability of compounds to inhibit endogenous, cell-bound CD73 enzyme activity was demonstrated using SK-MEL-28 cells, which express CD73 on their surface. The day before the experiment, 5000 cells were plated per well in a 96-well plate. Cells were washed twice with 200 μL reaction buffer (20 mM HEPES, pH 7.4, 125 mM NaCl, 1 mM KCl, 2 mM MgCl2, 10 mM glucose) to remove residual inorganic phosphate. After washing, assays contained serial dilutions of test compounds and 100 μM of AMP in a total volume of 200 μL reaction buffer, with a final DMSO concentration ≤0.5%. After 30 minutes at room temperature, supernatant was removed from the cells. A volume of 100 μL Malachite Green (Cell Signaling Technology, Cat. No. 12776) was added to 25 μL of supernatant. After 5 minutes at room temperature, absorbance at 630 nm was determined on a microplate spectrophotometer. The concentration of inorganic phosphate was determined using a phosphate standard curve to determine IC50.
- Functional Uptake Assay (rDAT) Quantification of dopamine uptake was performed using synaptosomes isolated in a 0.32 M sucrose buffer from a male Wistar rat striatum. The uptake of radiolabelled dopamine by synaptosomes (20 ug of proteins/point) was allowed by incubating them for 15 minutes at 37° C. in the presence of test compounds and [3H]-dopamine (0.1 uCi/point). The experiment was performed in a deep well. Synaptosomes and [3H]-dopamine were prepared in a Krebs buffer pH 7.4 containing 25 mM NaHCO3, 11 mM glucose and 50 uM ascorbic acid. This incubation buffer was oxygenated for 5 minutes before incubation. Basal control was incubated for 15 minutes at 4° C. in order to avoid any uptake. Following this incubation, the uptake was stopped by filtration through a unifilter 96-wells GFB Packard plate washed with Krebs buffer containing 25 mM NaHCO3 in order to eliminate free [3H]-dopamine. The radioactivity associated to the synaptosomes retained onto the unifilter corresponding to the uptake was then measured with a microplate scintillation counter (Topcount, Packard) using a scintillation fluid.
- Functional Uptake Assay (rSERT) Quantification of 5-HT uptake was performed using synaptosomes isolated in a 0.32M sucrose buffer from a male Wistar rat cortex. The uptake of radiolabelled 5-HT by synaptosomes (100 ug of proteins/point) was allowed by incubating them in a well for 15 min at 37° C. in presence of test compounds and [3H]5-hydroxytryptamine (serotonin; 0.1 uCi/point). Synaptosomes and [3H]serotonin were prepared in a Krebs buffer pH 7.4 containing 25 mM NaHCO3, 11 mM glucose and 50 uM ascorbic acid. This incubation buffer was oxygenated during 5 minutes before incubation. Basal control was incubated for 15 minutes at 4° C. in order to avoid any uptake. Following this incubation the uptake was stopped by filtration through a unifilter 96-wells GFB Packard plate washed with Krebs buffer containing 25 mM NaHCO3 in order to eliminate the free [3H]serotonin. The radioactivity associated to the synaptosomes retained on the unifilter corresponding to the uptake was then measured with a microplate scintillation counter (Topcount, Packard) using a scintillation fluid.
- GPR6 In Vitro Assay (A.1) This cell based assay measures the ability of compounds to inhibit the constitutive cAMP activity of GPR6 receptor expressed in CHO-K1 cells. CHO cells were stably expressed with GPR6 receptor, whose expression is controlled by a tetracycline inducable element. The cells were cultured in medium containing F12K, 10% FBS, 1% PennStrep, 200 ug/mL Hygromycin. GPR6 receptor expression was induced for 20 hrs with 1 ug/ml doxycycline (sigma D9891) in growth media. After addition of doxycycline cells were plated at a density of 250-500 cells per well in half-volume black clear bottom plates (Costar) and place in an incubator (37° C, 5% C(O)2) for 20 hours prior to cAMP assays.Culture media was removed from cells and they were washed with 50 uL of Ringer's Buffer (MgCl2 0.047 mg/mL, NaH2PO4 0.18 mg/mL, Na2HPO4 0.1 mg/mL, KCl 0.34 mg/mL, NaHC(O)3 1.26 mg/mL, D-glucose 1.8 mg/mL, NaCl 7 mg/mL; pH=7.4). Compounds suspended in DMSO were diluted in Ringer's Buffer.
- GPR6 In Vitro Assay (A.2) This cell based assay measures the ability of compounds to inhibit the constitutive cAMP activity of GPR6 receptor expressed in CHO-K1 cells. CHO cells were stably expressed with GPR6 receptor, whose expression is controlled by a tetracycline inducable element. The cells were cultured in medium containing F12K, 10% FBS, 1% PennStrep, 200 ug/mL Hygromycin. GPR6 receptor expression was induced for 20 hrs with 2 ug/ml doxycycline (sigma D9891) in growth media. After addition of doxycycline cells were plated at a density of 450-750 cells per well in 96-well half-volume black tissue culture plates (Costar) and placed in an incubator (37°, 5% CO2) for 20 hours prior to cAMP assays. Culture media was removed from cells and they were washed with 50 uL/well of Ringer's Buffer (MgCl2 0.047 mg/mL, NaH2PO4 0.18 mg/mL, Na2HPO4 0.1 mg/mL, KCl 0.34 mg/mL, NaHCO3 1.26 mg/mL, D-glucose 1.8 mg/mL, NaCl 7 mg/mL; pH=7.4). Compounds suspended in DMSO were diluted in Ringer's Buffer.
- GPa Inhibition Assay RMGPa (Rabbit Muscle Glycogen Phosphorylase a) activity was measured in the direction of glycogen synthesis by the formation of inorganic phosphate from glucose-1-phosphate using a 384 well plate at 22 deg with a 30 min incubation time. Phosphate was measured at 620 nm, 5 min after the addition of ammonium molybdate and malachite green. Test compounds were added to the assay. Compounds were tested against a caffeine standard in 11 point concentration-response curve in duplicate on two separate occasions. Data was analyzed using GraphPad Prism v.4.03.A nonlinear regression (curve fit) analysis with a sigmoidal dose-response equation (variable slope) was applied to generate IC50 and Hill slope values. The reported IC50 had a Hill slope between 0.7 and 1.2 and a Z value of ~0.8. Compounds were screened with maximal concentrations of 222 uM. The assay was carefully monitored for signs of compound insolubility. The results are presented as mean values from 4 determinations. Samples used in screening were of 98-100% purity.
- Glucosylceramide Synthase Assay To determine glucosylceramide synthase inhibition, substrates at 2× of their Km (fluorescent ceramide and UDP-glucose, 3 μM and 4 μM respectively) and microsomes (1:50 dilution) are combined 1:1 and incubated at room temperature for 1 hour in the dark on a plate shaker. The reaction is stopped by the addition of 150 μL of 100 μM C8-ceramide in 50% aq. isopropanol; 10 μL of the final mix is analyzed on HPLC (with fluorescence detector). The mobile phase is 1% formic acid added to 81% methanol/19% water with flow rate 0.5 mL/min. Fluorescence is detected with λex=470 nm and λem=530 nm. Under these conditions, NBD-C6-GluCer had a retention time of about 1.7 min and NBD-C6-Cer elutes from the column after about 2.1 min. Both peaks are separated from each other and the baseline and were integrated automatically by the HPLC software. The percent conversion of substrate to product is used as the readout for inhibitor testing.
- In Vitro Assay (Protocol 2) Compounds of Formula (I), were diluted in eight concentrations in the extracellular solution composed of physiological saline, buffered with HEPES (mM): NaCl, 137; KCl, 4; CaCl2, 3.8; MgCl2, 1; HEPES, 10; Glucose, 10; pH 7.4. The extracellular solution is composed of (mM) CsCl, 50; CsF, 90; MgCl2, 5; EGTA, 5; HEPES, 10; pH 7.2. The duration of exposure of each compound with the cells expressing Nav 1.7 or Nav 1.8 was at least five minutes and the assays were performed at room temperature.The measurements of the sodium currents of Nav 1.8 and Nav 1.7 were obtained using the voltage protocols described below: A holding voltage of-100 mV was established followed by an inactivation voltage step at −40 mV for 8 seconds, followed by a −100 mV step for 20 ms, followed by a 20 ms step for 10 mV for Nav 1.8 or 0 mV for Nav 1.7 (TP1A) before returning to the holding voltage of-100 mV. Protocols were repeated at a frequency of 0.05 Hz and current amplitude was quantified over the TP1A phase log.
- In Vitro Assay Fluorescent Imaging Plate Reader (FLIPR) assay: Briefly, 293-human or mouse P2X7 stable cells were incubated in sucrose buffer, pH 7.4 [KCl (5 mM), NaH2PO4.2H2O (9.6 mM), HEPES (25 mM), sucrose (280 mM), glucose (5 mM), CaCl2 (0.5 mM), and probenecid (0.1425 g in 3 mL 1N NaOH was added for 500 mL solution)] in 384-well plates. 293-rat P2X7 stable cells were incubated in HHPB (pH 7.4) [consisting of Hank's BSS (1×); HEPES (pH 7.4) (20 mM) (Sigma); probenecid (0.710 g/5 mL 1N NaOH) (Sigma); and BSA (0.05%) (Roche) which was added after the pH had been adjusted] in 384-well plates. Fluo-4 NW dye mix (Molecular Probes, Inc., Eugene, Oreg., USA) was prepared in buffer (see manufacturer's instructions). Cell plates were removed from the 37° C. incubator, the media discarded and then 30 μL of dye was added to each well. Plates were placed in the 37° C., non-CO2 incubator for 30 minutes and then room temperature for 30 minutes.
- Inhibition Assay For sodium-dependent glucose transport assay, cells expressing hSGLT2 were seeded into a 96-well culture plate at a density of 5x10⁴ cells/well in RPMI medium 1640 containing 10% fetal bovine serum. The cells were used 1 day after plating. They were incubated in pretreatment buffer (10 mM HEPES, 5 mM Tris, 140 mM choline chloride, 2 mM KCl, 1 mM CaCl2, and 1 mM MgCl2, pH 7.4) at 37 C. for 10 min. They were then incubated in uptake buffer (10 mM HEPES, 5 mM Tris, 140 mM NaCl, 2 mM KCl, 1 mM CaCl2, 1 mM MgCl2, and 1 mM 14C-nonlabeled AMG pH 7.4) containing 14C-labeled AMG (8 uM) and the inventive compound or dimethyl sulfoxide (DMSO) vehicle at 37 C. for 2 h. Cells were washed twice with washing buffer (pretreatment buffer containing 10 mM AMG at room temperature) and then the radioactivity was measured using a liquid scintillation counter. IC50 was determined by nonlinear regression analysis using GraphPad PRISM [Katsuno, K. et al. J. Pharmacol. Exp. Ther. 2007, 320, 323-330].
- Inhibition Assay MDCK cells stably transfected with rat PGT (Endo et al., 2002) were seeded at 15-20% confluence on 24-well plates. The day on which the cells were seeded was considered day 1. PGE2 uptake experiments were conducted on day 4. All of the PGE2 uptake experiments were conducted at room temperature. On day 4, cells were washed twice with Waymouth buffer (135 mM NaCl, 13 mM H-Hepes, 13 mM Na-Hepes, 2.5 mM CaCl2, 1.2 mM MgCl2, 0.8 mM MgSO4, 5 mM KCl, and 28 mM D-glucose). Then 200 μL of Waymouth buffer containing [3H]PGE2 (purchased from Perkin Elmer) was added to each well. At the designed time, the uptake of [3H]PGE2 was stopped by aspiration of uptake buffer; this was followed by immediate washing twice with 500 μL of chilled Waymouth buffer. Cells were then lysed with 100 μL lysis buffer containing 0.25% SDS and 0.05 N NaOH. 1.5 mL of scintillation solution was added to each well, and intracellular [3H]PGE2 was counted by MicroBeta Counter.
- Patch Clamp/Inhibition Assay Cells and methods: Functional inhibition of the sodium currents is studied using whole cell patch clamp methods (Hamill O. P., Marty A., Neher E., Sakmann B., Sigworth F. J., Pflugers Arch. 391 (2): 85-100 (1981)) on the hybrid cell line ND7/23 (Wood J N, Bevan S J, Coote P R, Dunn P M, Harmar A, Hogan P, Latchman D S, Morrison C, Rougon G, Theveniau M.: "Novel cell lines display properties of nociceptive sensory neurons". Proc. Biol. Sci. Sep 22; 241(1302):187-94 (1990)), that express a mixed population of voltage gated sodium channels. For sodium current recording control bath solution contained (mM): NaCl (80), choline chloride (38), CaCl2 (1.3), MgCl2 (2), KCl (2), CdCl2 (0.4), NiCl2 (0.3), TEA.Cl (20), Hepes (10), glucose (10). Internal pipette solution consists of (mM): CsF (65), CsCl (65), NaCl (10), CaCl2 (1.3), MgCl2 (2), Hepes (10), EGTA (10), MgATP (1). Compounds are dissolved as 20 mM stock solutions in DMSO and then diluted to the final concentration in the external solutions.
- Radioligand Binding Assay HEK-293 cells stably expressing mouse TAAR1 were maintained at 37° C. and 5% CO2 in DMEM high glucose medium, containing fetal calf serum (10%, heat inactivated for 30 min at 56° C.), penicillin/streptomycin (1%), and 375 ug/ml geneticin (Gibco). Cells were released from culture flasks using trypsin/EDTA, harvested, washed twice with ice-cold PBS (without Ca2+ and Mg2+), pelleted at 1,000 rpm for 5 min at 4° C., frozen and stored at -80° C. Frozen pellets were suspended in 20 ml HEPES-NaOH (20 mM, pH 7.4) containing 10 mM EDTA and homogenized with a Polytron (PT 6000, Kinematica) at 14,000 rpm for 20 s. The homogenate was centrifuged at 48,000xg for 30 min at 4° C. Subsequently, the supernatant was removed and discarded, and the pellet resuspended in 20 ml HEPES-NaOH (20 mM, pH 7.4) containing 0.1 mM EDTA using the Polytron (20 s at 14,000 rpm). This procedure was repeated and the final pellet resuspended in HEPES-NaOH containing 0.1 mM EDTA and homogenized.
- Radioligand Binding Assay HEK-293 cells stably expressing mouse TAAR1 were maintained at 37° C. and 5% CO2 in DMEM high glucose medium, containing fetal calf serum (10%, heat inactivated for 30 min at 56° C.), penicillin/streptomycin (1%), and 375 μg/ml geneticin (Gibco). Cells were released from culture flasks using trypsin/EDTA, harvested, washed twice with ice-cold PBS (without Ca2+ and Mg2+), pelleted at 1'000 rpm for 5 min at 4° C., frozen and stored at −80° C. Frozen pellets were suspended in 20 ml HEPES-NaOH (20 mM, pH 7.4) containing 10 mM EDTA and homogenized with a Polytron (PT 6000, Kinematica) at 14'000 rpm for 20 s. The homogenate was centrifuged at 48'000×g for 30 min at 4° C. Subsequently, the supernatant was removed and discarded, and the pellet resuspended in 20 ml HEPES-NaOH (20 mM, pH 7.4) containing 0.1 mM EDTA using the Polytron (20 s at 14'000 rpm). This procedure was repeated and the final pellet resuspended in HEPES-NaOH containing 0.1 mM EDTA and homogenized using the Polytron.
- Radioligand Binding Assay HEK-293 cells stably expressing rat TAAR1 were maintained at 37 C and 5% CO2 in DMEM high glucose medium, containing fetal calf serum (10%, heat inactivated for 30 min at 56 C), penicillin/streptomycin (1%), and 375 ug/ml geneticin (Gibco). Cells were released from culture flasks using trypsin/ EDTA, harvested, washed twice with ice-cold PBS (without Ca2+ and Mg2+), pelleted at 1,000 rpm for 5 min at 4 C, frozen and stored at -80 C. Frozen pellets were suspended in 20 ml HEPES-NaOH (20 mM, pH 7.4) containing 10 mM EDTA and homogenized with a Polytron (PT 6000, Kinematica) at 14,000 rpm for 20 s. The homogenate was centrifuged at 48,000 x g for 30 min at 4 C. Subsequently, the supernatant was removed and discarded, and the pellet resuspended in 20 ml HEPES-NaOH (20 mM, pH 7.4) containing 0.1 mM EDTA using the Polytron (20 s at 14,000 rpm). This procedure was repeated and the final pellet resuspended in HEPES-NaOH containing 0.1 mM EDTA.
- Radioligand Binding Assay HEK-293 cells stably expressing rat TAAR1 were maintained at 37° C. and 5% CO2 in DMEM high glucose medium, containing fetal calf serum (10%, heat inactivated for 30 min at 56° C.), penicillin/streptomycin (1%), and 375 μg/ml geneticin (Gibco). Cells were released from culture flasks using trypsin/EDTA, harvested, washed twice with ice-cold PBS (without Ca2+ and Mg2+), pelleted at 1'000 rpm for 5 min at 4° C., frozen and stored at −80° C. Frozen pellets were suspended in 20 ml HEPES-NaOH (20 mM, pH 7.4) containing 10 mM EDTA and homogenized with a Polytron (PT 6000, Kinematica) at 14′000 rpm for 20 s. The homogenate was centrifuged at 48'000×g for 30 min at 4° C. Subsequently, the supernatant was removed and discarded, and the pellet resuspended in 20 ml HEPES-NaOH (20 mM, pH 7.4) containing 0.1 mM EDTA using the Polytron (20 s at 14'000 rpm). This procedure was repeated and the final pellet resuspended in HEPES-NaOH containing 0.1 mM EDTA and homogenized using the Polytron.
- Radioligand Binding HEK-293 cells stably expressing mouse TAAR1 were maintained at 37 C. and 5% CO2 in DMEM high glucose medium, containing fetal calf serum (10%, heat inactivated for 30 min at 56 C.), penicillin/streptomycin (1%), and 375 ug/ml geneticin (Gibco). Cells were released from culture flasks using trypsin/EDTA, harvested, washed twice with ice-cold PBS (without Ca2+ and Mg2+), pelleted at 1,000 rpm for 5 min at 4 C., frozen and stored at -80 C. Frozen pellets were suspended in 20 ml HEPES-NaOH (20 mM, pH 7.4) containing 10 mM EDTA and homogenized with a Polytron (PT 6000, Kinematica) at 14,000 rpm for 20 s. The homogenate was centrifuged at 48,000xg for 30 min at 4 C. Subsequently, the supernatant was removed and discarded, and the pellet resuspended in 20 ml HEPES-NaOH (20 mM, pH 7.4) containing 0.1 mM EDTA using the Polytron (20 s at 14,000 rpm). This procedure was repeated and the final pellet resuspended in HEPES-NaOH containing 0.1 mM EDTA.
- Radioligand Binding HEK-293 cells stably expressing rat TAAR1 were maintained at 37 C. and 5% CO2 in DMEM high glucose medium, containing fetal calf serum (10%, heat inactivated for 30 min at 56 C.), penicillin/streptomycin (1%), and 375 ug/ml geneticin (Gibco). Cells were released from culture flasks using trypsin/EDTA, harvested, washed twice with ice-cold PBS (without Ca2+ and Mg2+), pelleted at 1,000 rpm for 5 min at 4 C., frozen and stored at --80 C. Frozen pellets were suspended in 20 ml HEPES-NaOH (20 mM, pH 7.4) containing 10 mM EDTA and homogenized with a Polytron (PT 6000, Kinematica) at 14,000 rpm for 20 s. The homogenate was centrifuged at 48,000xg for 30 min at 4 C. Subsequently, the supernatant was removed and discarded, and the pellet resuspended in 20 ml HEPES-NaOH (20 mM, pH 7.4) containing 0.1 mM EDTA using the Polytron (20 s at 14,000 rpm). This procedure was repeated and the final pellet resuspended in HEPES-NaOH containing 0.1 mM EDTA.
- UDP-Glo Glucosylceramide Synthase Biochemical Assay Using Promega's UDP-Glo™ Glycosyltransferase assay kit (Promega Corporation, Madison, WI, USA (Promega)), GCS activity was indirectly measured by detecting the amount of UDP produced. An aliquot of GCS enzyme (1.5 μg crude golgi preparation, total protein) and titrated test compound were aliquoted to each well and incubated for 30 minutes at room temperature. Substrate mixture was prepared by mixing C6 ceramide (Avanti Polar Lipids, Alabaster, AL USA (Avanti)) (micelles prepared at 0.6 mM in 0.6 mM DOPC) and UDP-glucose (20 μ.M; Promega), at concentrations equivalent to 2×Km, in assay buffer (25 mM HEPES (pH 7.5), 50 mM KCl, 5 mM MgCl2). An equivalent volume of substrate mixture was then added to each well. Following a 20 h incubation at room temperature to allow for GCS turnover of substrate, an equal volume of UDP detection reagent (Promega) was added to each well and incubated for an additional 75 minutes at room temperature to simultaneously convert the accumulated UDP product into ATP and generate light in a luciferase reaction.
- UDP-Glo™ Glucosylceramide Synthase Biochemical Assay Using Promega's UDP-Glo™ Glycosyltransferase assay kit (Promega Corporation, Madison, WI, USA (Promega)), GCS activity was indirectly measured by detecting the amount of UDP produced. An aliquot of GCS enzyme (1.5 μg crude golgi preparation, total protein) and titrated test compound were aliquoted to each well and incubated for 30 minutes at room temperature. Substrate mixture was prepared by mixing C6 ceramide (Avanti Polar Lipids, Alabaster, AL USA (Avanti)) (micelles prepared at 0.6 mM in 0.6 mM DOPC) and UDP-glucose (20 μM; Promega), at concentrations equivalent to 2×Km, in assay buffer (25 mM HEPES (pH 7.5), 50 mM KCl, 5 mM MgCl2). An equivalent volume of substrate mixture was then added to each well. Following a 20 h incubation at room temperature to allow for GCS turnover of substrate, an equal volume of UDP detection reagent (Promega) was added to each well and incubated for an additional 75 minutes at room temperature to simultaneously convert the accumulated UDP product into ATP and generate light in a luciferase reaction.
- hERG Inhibition Assay Compounds were solubilised to 100 mM in DMSO before dilution in HBPS to 300 μM. 6-Point concentration-response curves were generated using 3.16-fold serial dilutions from the top test concentration. Procedure: Electrophysiological recordings were made from a Chinese Hamster Ovary cell line stably expressing the full-length hERG potassium channel. Single cell ionic currents were measured in whole-cell patch clamp configuration at room temperature (21-23° C.) using the QPatch HTX platform (Sophion). Intracellular solution contained (mM): 120 KF, 20 KCl, 10 EGTA, 10 HEPES and was buffered to pH 7.3. The extracellular solution (HEPES-buffered physiological saline, HBPS) contained (mM): 145 NaCl, 4 KCl, 2 CaCl2, 1 MgCl2, 10 HEPES, 10 glucose, buffered to pH7.4. Cells were clamped at a holding potential of −80 mV. Cells were stepped to +20 mV for 2 s then −40 mV for 3s before returning to the holding potential. This sweep was repeated 10 times at 10 s intervals. hERG currents were measured from the tail step and referenced to the holding current.
- Biochemical Assay Buffer pH7.4: Prepare 1 (M) KH2PO4 and 1 (M) K2HPO4. Titrate 1(M) K2HPO4 with 1 (M) KH2PO4 to obtain pH 7.40. Dilute this buffer 10 fold in Water (30 ml buffer+270 ml of water) to obtain 100 mM phosphate buffer. Adjust pH to 7.40±0.02 using 5(N) HCl or 5(N) NaOH. NADPH Regeneration System (NRS): Prepare a solution containing 13 mM NADP, 33 mM Glucose-6-phosphate, 33 mM MgCl2and 4 U/ml Glucose-6-phosphate dehydrogenase in buffer. Liver Microsome (LM) suspension: Thaw LM vial on ice, then mix 1.0 ml LM (20 mg/ml) with 19 ml buffer [final LM Conc: 1 mg/ml] LM+NRS suspension: Mix 5.0 ml NRS with 20 ml LM suspension [final LM Conc: 0.8 mg/ml] System suitability standard: a synthesized compound having Mol wt 686.2 used as System suitability standard. Dissolve this compound in ice-cold acetonitrile to obtain concentration of 0.1 μg/ml and store at 4° C. Compound Dilution: Compound Stock: 10 mM in DMSO Sub stock (100 μM): 4 μl of 10 mM Compound Stock+398 μl Acetonitrile. Working plate (2 μM): 10 μl of 100 μM Sub stock+490 μl buffer Assay Procedure Incubate all plastic materials including tips at 37° C. overnight. Incubate LM suspension and NRS at 37° C. for 15 min before use. Add 40 μl buffer to the wells of blank plate. Add 40 μl compound (from working plate) to 0, 5, 10, 20, 30 and 60 min plates. Initiate reaction by adding 40 μl of LM+NRS suspension in each plate. Terminate reaction by adding 240 μl ice-cold acetonitrile containing system suitability standard at designated time points. For T=0 add 240 μl ice-cold acetonitrile containing system suitability standard before LM+NRS addition. Centrifuge (3500 rpm, 20 min and 15° C.) the plates. Mix 110 μl supernatant with 110 μl water and quantitate amount of Compound in the solution using LC-MS/MS.
- Effect of Compounds of Formula (I) on Cloned Human GluN1/GluN2B Ion Channels Expressed in Mammalian Cells NMDA receptors are ion channels that are highly permeable to Ca2+ ions, rendering it possible to monitor NMDA receptor function using cell-based calcium flux assay. In this assay, co-agonists glutamate and glycine are added to cells heterologously expressing human GluN1/GluN2B NMDA receptors to initiate cellular Ca2+ influx. The time course of the changes in intracellular calcium is measured using a fluorescent dye and a FLIPR (Fluorometric Imaging Plate Reader) device.Twenty four hours before measurements, the expression of the NMDA receptors in the stable cell line is induced with Tet-On inducible system in the presence of a non-selective NMDA receptor blocker. On the day of the experiment, cell culture media is carefully washed and the cells are loaded with Calcium 5 Dye Kit (Molecular Devices) in dye loading buffer containing 137 mM NaCl, 4 mM KCl, 2 mM CaCl2, 0.5 mM MgCl2 (standard assay) or 1.5 mM MgCl2 (HTS assay), 10 mM HEPES and 5 mM D-glucose; pH 7.4. After 1 h incubation at the room temperature, the dye is washed away with the assay buffer (137 mM NaCl (standard assay) or 150 mM (HTS assay), 4 mM KCl (standard assay) or 3 mM (HTS assay), 2 mM CaCl2, 0.01 mM EDTA, 10 mM HEPES and 5 mM D-glucose; pH 7.4) In the FLIPR TETRA reader, various concentrations of the test compounds are added to the cells for 5 min while fluorescence is monitored to detect potential agonist activity. Next, co-agonists, glutamate and glycine are added for another 5 minutes. The concentration of glutamate corresponding to EC40 (standard assay) or EC40 (HTS assay) is used to maximize the assay's signal window and ability to detect NMDA receptor antagonists and negative allosteric modulators. A saturating concentration (10 μM) of glycine is also present in the assay. A non-selective NMDA receptor antagonist, (+)MK-801 is used as a positive control for antagonist activity. The fluorescent signal in the presence of test compounds is quantified and normalized to the signal defined by the appropriate control wells.
- Effects of Test Articles on Cloned Human NR1/GuN2B Ion Channels Expressed in Mammalian Cells NMDA receptors are ion channels that are highly permeable to Ca2+ ions, rendering it possible to monitor NMDA receptor function using cell-based calcium flux assay. In this assay, co-agonists glutamate and glycine are added to cells heterologously expressing human GluN1/GluN2B NMDA receptors to initiate cellular Ca2+ influx. The time course of the changes in intracellular calcium is measured using a fluorescent dye and a FLIPR (Fluorometric Imaging Plate Reader) device.Twenty-four hours before measurements, the expression of the NMDA receptors in the stable cell line is induced with Tet-On inducible system in the presence of a non-selective NMDA receptor blocker. On the day of the experiment, cell culture media is carefully washed, and the cells are loaded with Calcium 5 Dye Kit (Molecular Devices) in dye loading buffer containing 137 mM NaCl, 4 mM KCl, 2 mM CaCl2, 0.5 mM MgCl2 (standard assay) or 1.5 mM MgCl2 (HTS assay), 10 mM HEPES and 5 mM D-glucose; pH 7.4. After 1 h incubation at the room temperature, the dye is washed away with the assay buffer (137 mM NaCl (standard assay) or 150 mM (HTS assay), 4 mM KCl (standard assay) or 3 mM (HTS assay), 2 mM CaCl2), 0.01 mM EDTA, 10 mM HEPES and 5 mM D-glucose; pH 7.4) In the FLIPR TETRA reader, various concentrations of the test compounds are added to the cells for 5 min while fluorescence is monitored to detect potential agonist activity. Next, co-agonists, glutamate and glycine are added for another 5 minutes. The concentration of glutamate corresponding to EC40 (standard assay) or EC40 (HTS assay) is used to maximize the assay's signal window and ability to detect NMDA receptor antagonists and negative allosteric modulators. A saturating concentration (10 μM) of glycine is also present in the assay. A non-selective NMDA receptor antagonist, (+)MK-801 is used as a positive control for antagonist activity. The fluorescent signal in the presence of test compounds is quantified and normalized to the signal defined by the appropriate control wells.
- HTS cell-based calcium flux assay NMDA receptors are ion channels that are highly permeable to Ca2+ ions, rendering it possible to monitor NMDA receptor function using cell-based calcium flux assay. In this assay, co-agonists glutamate and glycine are added to cells heterologously expressing human GluN1/GluN2B NMDA receptors to initiate cellular Ca2+ influx. The time course of the changes in intracellular calcium is measured using a fluorescent dye and a FLIPR (Fluorometric Imaging Plate Reader) device.Twenty four hours before measurements, the expression of the NMDA receptors in the stable cell line is induced with Tet-On inducible system in the presence of a non-selective NMDA receptor blocker. On the day of the experiment, cell culture media is carefully washed and the cells are loaded with Calcium 5 Dye Kit (Molecular Devices) in dye loading buffer containing 137 mM NaCl, 4 mM KCl, 2 mM CaCl2, 0.5 mM MgCl2 (standard assay) or 1.5 mM MgCl2 (HTS assay), 10 mM HEPES and 5 mM D-glucose; pH 7.4. After 1 h incubation at the room temperature, the dye is washed away with the assay buffer (137 mM NaCl (standard assay) or 150 mM (HTS assay), 4 mM KCl (standard assay) or 3 mM (HTS assay), 2 mM CaCl2, 0.01 mM EDTA, 10 mM HEPES and 5 mM D-glucose; pH 7.4) In the FLIPR TETRA reader, various concentrations of the test compounds are added to the cells for 5 min while fluorescence is monitored to detect potential agonist activity. Next, co-agonists, glutamate and glycine are added for another 5 minutes. The concentration of glutamate corresponding to EC40 (HTS assay) is used to maximize the assay's signal window and ability to detect NMDA receptor antagonists and negative allosteric modulators. A saturating concentration (10 μM) of glycine is also present in the assay. A non-selective NMDA receptor antagonist, (+)MK-801 is used as a positive control for antagonist activity. The fluorescent signal in the presence of test compounds is quantified and normalized to the signal defined by the appropriate control wells.
- Intracellular Calcium Measurement to Assess Antagonist Activity at Human P2X3 and Human P2X2/3 Receptors A fluorescent imaging plate reader (FLEX/FLIPR station; Molecular Devices) was used to monitor intracellular calcium levels using the calcium-chelating dye Fluo-4 (Molecular Probes). The excitation and emission wavelengths used to monitor fluorescence were 470-495 nm and 515-575 nm, respectively. Cells expressing purinergic receptors P2X3 (human) or P2X2/3 (human) were plated at a density of 15,000 cells/well in collagen-coated 384-well plates approximately 20 hours before beginning the assay. On the day of the assay, 20 μl of loading buffer (Hank's balanced salt solution, 20 mM HEPES, 0.5 mM CaCl2, 0.5 mM MgCl2, 0.1% BSA, 5 mM probenecid, 10 mM D-glucose monohydrate, 2 μM Fluo-4, and 5 units/mL, hexokinase, pH=7.4) was added and cells dye-loaded for 90 min at 37° C. The dye supernatant was removed and replaced with 45 μl probenecid buffer (Hank's balanced salt solution, 20 mM HEPES, 0.5 mM CaCl2, 0.5 mM MgCl2, 0.1% BSA, 5 mM probenecid, 10 mM D-glucose monohydrate, pH=7.4). The test compound was added in a volume of 5 μl and allowed to incubate for 30 min at 37° C. The final assay DMSO concentration is 1%. The agonist, α,β-Me-ATP, was added in a volume of 20 μl at a concentration representing the EC80 value. The fluorescence was measured for an interval of 90 sec at 2 sec intervals and analyzed based on the increase in peak relative fluorescence units (RFU) compared to the basal fluorescence. Peak fluorescence was used to determine the response to agonist obtained at each concentration of test compound by the following equation: % Response=100*(RFU(test compound)−RFU(control))/(RFU(DMSO)−RFU(control))The Examples were tested in triplicates per plate and mean values were plotted in Excel XLFit to determine IC50 values at the human P2X3 and human P2X2/3 receptors, percentage of maximal inhibition and the Hill coefficients.
- Standard cell-based calcium flux assay NMDA receptors are ion channels that are highly permeable to Ca2+ ions, rendering it possible to monitor NMDA receptor function using cell-based calcium flux assay. In this assay, co-agonists glutamate and glycine are added to cells heterologously expressing human GluN1/GluN2B NMDA receptors to initiate cellular Ca2+ influx. The time course of the changes in intracellular calcium is measured using a fluorescent dye and a FLIPR (Fluorometric Imaging Plate Reader) device.Twenty four hours before measurements, the expression of the NMDA receptors in the stable cell line is induced with Tet-On inducible system in the presence of a non-selective NMDA receptor blocker. On the day of the experiment, cell culture media is carefully washed and the cells are loaded with Calcium 5 Dye Kit (Molecular Devices) in dye loading buffer containing 137 mM NaCl, 4 mM KCl, 2 mM CaCl2, 0.5 mM MgCl2 (standard assay) or 1.5 mM MgCl2 (HTS assay), 10 mM HEPES and 5 mM D-glucose; pH 7.4. After 1 h incubation at the room temperature, the dye is washed away with the assay buffer (137 mM NaCl (standard assay) or 150 mM (HTS assay), 4 mM KCl (standard assay) or 3 mM (HTS assay), 2 mM CaCl2, 0.01 mM EDTA, 10 mM HEPES and 5 mM D-glucose; pH 7.4) In the FLIPR TETRA reader, various concentrations of the test compounds are added to the cells for 5 min while fluorescence is monitored to detect potential agonist activity. Next, co-agonists, glutamate and glycine are added for another 5 minutes. The concentration of glutamate corresponding to EC40 (standard assay) is used to maximize the assay's signal window and ability to detect NMDA receptor antagonists and negative allosteric modulators. A saturating concentration (10 μM) of glycine is also present in the assay. A non-selective NMDA receptor antagonist, (+)MK-801 is used as a positive control for antagonist activity. The fluorescent signal in the presence of test compounds is quantified and normalized to the signal defined by the appropriate control wells.
- Biochemical CD73 Assay Activity of recombinant CD73 was measured by quantification of free phosphate using the Malachite Green detection system (R&D Systems #DY996). Test compounds were solubilized in DMSO and dispensed into 384-well polystyrene plates in a 8-point 3× titration in duplicates. Then, 10 μL of 4 nM human CD73 enzyme (Novoprotein #C446) in phosphate- free assay buffer (10 mM HEPES, pH 7.4, 125 mM NaCl, 1 mM KCl, 10 mM glucose, 2 mM MgCl2) was added to the plates. The compound and enzyme were incubated for 15 min at RT. Then, 10 μL of 80 μM AMP (Sigma Aldrich #A1752) in the assay buffer was added and the reaction mixture was incubated for 45 mM at 37° C. The final concentrations of CD73 and AMP in the reaction were 2 nM and 40 μM, respectively. The reaction was stopped by adding 5 μL of Malachite Green reagent A and incubating for 10 mM at RT, followed by addition of 5 μL of Malachite Green reagent B and incubation for 20 mM at RT. Absorbance was then read at 620 nM with the Flexstation spectrophotometer (Molecular Devices).
- Biochemical CD73 Assay Activity of recombinant CD73 was measured by quantification of free phosphate using the Malachite Green detection system (R&D Systems #DY996). Test compounds were solubilized in DMSO and dispensed into 384-well polystyrene plates in a 8-point 3× titration in duplicates. Then, 10 μL of 4 nM human CD73 enzyme (Novoprotein #C446) in phosphate-free assay buffer (10 mM HEPES, pH 7.4, 125 mM NaCl, 1 mM KCl, 10 mM glucose, 2 mM MgCl2) was added to the plates. The compound and enzyme were incubated for 15 min at RT. Then, 10 μL of 80 μM AMP (Sigma Aldrich #A1752) in the assay buffer was added and the reaction mixture was incubated for 45 min at 37° C. The final concentrations of CD73 and AMP in the reaction were 2 nM and 40 μM, respectively. The reaction was stopped by adding 5 μL of Malachite Green reagent A and incubating for 10 min at RT, followed by addition of 5 μL of Malachite Green reagent B and incubation for 20 min at RT. Absorbance was then read at 620 nM with the Flexstation spectrophotometer (Molecular Devices).
- Electrophysiology Assay In vitro assays were performed in a recombinant cell line expressing cDNA encoding the alpha subunit (Nav1.7, SCN9a, PN1, NE) of human Nav1.7 (Accession No. NM_002977). The cell line was provided by investigators at Yale University (Cummins et al, J. Neurosci. 18(23): 9607-9619 (1998)). For dominant selection of the Nav1.7-expressing clones, the expression plasmid co-expressed the neomycin resistance gene. The assay buffer was formulated by removing 120 mL from a 1 L bottle of fresh, sterile dH2O (Mediatech, Herndon, Va.) and adding 100 mL of 10×HBSS that does not contain Ca++ or Mg++ (Gibco, Invitrogen, Grand Island, N.Y.) followed by 20 mL of 1.0 M Hepes, pH 7.3 (Fisher Scientific, BP299-100). The final buffer consisted of 20 mM Hepes, pH 7.3, 1.261 mM CaCl2, 0.493 mM MgCl2, 0.407 mM Mg(SO)4, 5.33 mM KCl, 0.441 mM KH2PO4, 137 mM NaCl, 0.336 mM Na2HPO4 and 0.556 mM D-glucose (Hanks et al., Proc. Soc. Exp. Biol. Med. 71:196 (1949)), and the simple formulation was typically the basic buffer throughout the assay (i.e., all wash and addition steps).
- Electrophysiology Assay The coverslip plated with cells was placed in the experiment chamber perfused with bath solution composed of (in mM): 135 NaCl, 5 KCl, 2 CaCl2), 1 MgCl2, 10 HEPES, 5 Glucose (pH 7.4). Patch pipettes with resistance between 2-5 Megaohms, when filled with a solution containing (in mM): 135 KCl, 1 EGTA, 1 MgCl2, 10 HEPES, 2 Na2ATP (pH 7.3), were used to form gigaseals. The cells were voltage clamped at −75 mV in whole-cell configuration using an Axopatch 200b or Multiclamp 700b (Molecular Devices) amplifier controlled by pClamp Software (Molecular Devices). The current was recorded by applying a voltage step to −120 mV every 10 seconds. For each compound, 4-6 concentrations were applied for 3-8 minutes in a successive manner starting with the lowest concentration. At the end of the experiment, the cells were perfused with bath solution containing 2 mM Ba2+ to isolate the contribution of hROMK current.Data analysis: Raw current values (5 traces each for control, different compound concentration and Ba2+ treatment groups) were exported from Clampfit into Microsoft Excel where the current remaining after application of Ba2+ was subtracted from raw current to obtain hROMK specific current.
- FLIPR Assay Assay Buffer: The assay buffer was formulated by removing 120 mL from a 1 L bottle of fresh, sterile dH2O (Mediatech, Herndon, Va.) and adding 100 mL of 10xHBSS that does not contain Ca++ or Mg++ (Gibco, Invitrogen, Grand Island, N.Y.) followed by 20 mL of 1.0 M Hepes, pH 7.3 (Fisher Scientific, BP299-100). The final buffer consisted of 20 mM Hepes, pH 7.3, 1.261 mM CaCl2, 0.493 mM MgCl2, 0.407 mM Mg(SO)4, 5.33 mM KCl, 0.441 mM KH2PO4, 137 mM NaCl, 0.336 mM Na2HPO4 and 0.556 mM D-glucose (Hanks et al., Proc. Soc. Exp. Biol. Med. 71:196 (1949)), and the simple formulation was typically the basic buffer throughout the assay (i.e., all wash and addition steps). At the start of the assay, the media was flicked from the cells and the wells were washed once with 50 ul/well assay buffer (1x Hank's balanced salt solution without sodium bicarbonate or phenol red, 20 mM Hepes, pH 7.3) and then pre-incubated with the test articles, CoroNa Green AM sodium dye (for cell loading) and KCl for re
- FLIPR Assay In vitro assays were performed in a recombinant cell line expressing cDNA encoding the alpha subunit (Nav1.7, SCN9a, PN1, NE) of human Nav1.7 (Accession No. NM_002977). The cell line was provided by investigators at Yale University (Cummins et al, J. Neurosci. 18(23): 9607-9619 (1998)). For dominant selection of the Nav1.7-expressing clones, the expression plasmid co-expressed the neomycin resistance gene. The assay buffer was formulated by removing 120 mL from a 1 L bottle of fresh, sterile dH2O (Mediatech, Herndon, Va.) and adding 100 mL of 10×HBSS that does not contain Ca++ or Mg++ (Gibco, Invitrogen, Grand Island, N.Y.) followed by 20 mL of 1.0 M Hepes, pH 7.3 (Fisher Scientific, BP299-100). The final buffer consisted of 20 mM Hepes, pH 7.3, 1.261 mM CaCl2, 0.493 mM MgCl2, 0.407 mM Mg(SO)4, 5.33 mM KCl, 0.441 mM KH2PO4, 137 mM NaCl, 0.336 mM Na2HPO4 and 0.556 mM D-glucose (Hanks et al., Proc. Soc. Exp. Biol. Med. 71:196 (1949)), and the simple formulation was typically the basic buffer throughout the assay (i.e., all wash and addition steps).
- In Vitro Assay For sodium-dependent glucose transport assay, cells expressing hSGLT2 were seeded into a 96-well culture plate at a density of 5x10⁴ cells/well in RPMI medium 1640 containing 10% fetal bovine serum. The cells were used 1 day after plating. They were incubated in pretreatment buffer (10 mM HEPES, 5 mM Tris, 140 mM choline chloride, 2 mM KCl, 1 mM CaCl2, and 1 mM MgCl2, pH 7.4) at 37 C. for 10 min. They were then incubated in uptake buffer (10 mM HEPES, 5 mM Tris, 140 mM NaCl, 2 mM KCl, 1 mM CaCl2, 1 mM MgCl2, and 1 mM 14C-nonlabeled AMG pH 7.4) containing 14C-labeled (8 uM) and inhibitor or DMSO vehicle at 37 C. for 2 h. Cells were washed twice with washing buffer (pretreatment buffer containing 10 mM AMG at room temperature) and then the radioactivity was measured using a liquid scintillation counter. IC50 was determined by nonlinear regression analysis using GraphPad PRISM [Katsuno, K. et al. J. Pharmacol. Exp. Ther. 2007, 320, 323-330; Han, S. et al. Deabetes, 2008, 57, 1723-9].
- Inhibition of FGFR2-Dependent Cell Growth The cell-based effects of FGFR inhibitors were determined by measuring inhibition of FGFR-dependent cell line growth. The cell lines SNU-16 was used for these assays. SNU-16 cells were seeded in a 96-well plate at 5,000 cells per well in RPMI 1640 high glucose medium with 10% fetal bovine serum (FBS. Cells were incubated at 37° C. for 24 hrs. in 5% CO2. Compound dilutions were added to cells starting at a concentration of 30 uM and decreasing in tripling dilutions. The final DMSO concentration was 0.1%. The concentration range was adjusted as needed for compounds of different potencies. The cells treated with compounds were incubated for 72 hrs. at 37° C. in 5% CO2. At the end of the 72 hour incubation period, cell viability was determined using the Cell-titer Glo Luminescence assay from Promega. Percent inhibition of cell growth was calculated as a percentage of untreated cell viability. The percent inhibition was plotted as a function of log compound concentration. The IC50 was then calculated for each compound using Prism software from GraphPad.
- TNF induced HEK-Blue assay Test compounds serially diluted in DMSO were plated in an assay plate (Labcyte, Cat. #LP-0200) at final concentrations ranging from 0.004 μM to 25μM. TNFα (final concentration 0.5 ng/ml) or CD4OL (final concentration 30 ng/ml) in assay buffer [DMEM, 4.5 g/l glucose (Gibco, Cat. 21063-029), 10% FBS (Sigma, F4135), 1% Penicillin-Streptomycin (Gibco, Cat. 15140-122), 1% Anti-Anti (Gibco, Cat. 15240-112) and 2 mM L-glutamine (Gibco, Cat. 25030-081)] was then added to the assay plate. After a 30 minute pre-incubation at 37° C. and 5% CO2, HEK-Blue-CD40L cells (InvivoGen, Cat. Code hkb-cd40) containing a NF-κB-driven secreted alkaline phosphatase reporter gene were seeded into the assay plate at a density of 20,000 cells per well. This plate was then incubated for 18 h at 37° C. and 5% CO2. Secreted alkaline phosphatase expression was measured using QUANTI-Blue (InvivoGen, Cat. Code rep-qb1) according to manufacturer's specifications and the assay plate was read on a PerkinElmer Envision at 620 nm.
- TREK1 Assay The hTREK1 stable cell lines were seeded at a density of 10 000 cells/well in a 12-well plate. Whole-cell membrane currents were amplified using the Axopatch 200A patch-clamp system. Currents were elicited by 1-second voltage ramps descending from +50 mV to -150 mV (from a holding potential of -70 mV). Data acquisition was controlled by pclamp 10.2 software (Molecular Devices, Sunnyvale,CA, USA). A Digidata 1322A interface was used to convert digital-analog signals between amplifier and computer. Data were sampled at 5 kHz and filtered at 2 kHz. Cell membrane capacitance was measured using the 'membrane test' protocolbuilt into pClampex. The bath solution contained (in mM) 150 NaCl, 10 HEPES, 3 KCl, 2 CaCl2, 2 MgCl2, and 5.5 glucose adjusted to pH 7.3 with NaOH. The pipette solution contained (in mM) 145 KCl, 0.5 CaCl2, 10 HEPES, 4 Mg-ATP, 0.3 Na3-GTPadjusted to pH 7.2 with KOH. All experiments were performed at a room temperature of 20-22 °C. TREK1 currents were recorded in the presence of each 10 μm hit compounds. The block percentage of inhibitors was obtained by measuring the percentage of remaining current.
- UDP-Glo Glucosylceramide Synthase Biochemical Assay Using Promega's UDP-Glo Glycosyltransferase assay kit (Promega Corporation, Madison, WI, USA (Promega)), GCS activity was indirectly measured by detecting the amount of UDP produced. An aliquot of GCS enzyme (1.5 μg crude golgi preparation, total protein) and titrated test compound were aliquoted to each well and incubated for 30 minutes at room temperature. Substrate mixture was prepared by mixing C6 ceramide (Avanti Polar Lipids, Alabaster, AL USA (Avanti)) (micelles prepared at 0.6 mM in 0.6 mM DOPC) and UDP-glucose (20 μM; Promega), at concentrations equivalent to 2 Km, in assay buffer (25 mM HEPES (pH 7.5), 50 mM KCl, 5 mM MgCl2). An equivalent volume of substrate mixture was then added to each well. Following a 20 h incubation at room temperature to allow for GCS turnover of substrate, an equal volume of UDP detection reagent (Promega) was added to each well and incubated for an additional 75 minutes at room temperature to simultaneously convert the accumulated UDP product into ATP and generate light in a luciferase reaction. The generated light was detected using a luminometer.
- UDP-Glo Glucosylceramide Synthase Biochemical Assay Using Promega's UDP-Glo Glycosyltransferase assay kit (Promega Corporation, Madison, WI, USA (Promega)), GCS activity was indirectly measured by detecting the amount of UDP produced. An aliquot of GCS enzyme (1.5 μg crude golgi preparation, total protein) and titrated test compound were aliquoted to each well and incubated for 30 minutes at room temperature. Substrate mixture was prepared by mixing C6 ceramide (Avanti Polar Lipids, Alabaster, AL USA (Avanti)) (micelles prepared at 0.6 mM in 0.6 mM DOPC) and UDP-glucose (20 μM; Promega), at concentrations equivalent to 2×Km, in assay buffer (25 mM HEPES (pH 7.5), 50 mM KCl, 5 mM MgCl2). An equivalent volume of substrate mixture was then added to each well. Following a 20 h incubation at room temperature to allow for GCS turnover of substrate, an equal volume of UDP detection reagent (Promega) was added to each well and incubated for an additional 75 minutes at room temperature to simultaneously convert the accumulated UDP product into ATP and generate light in a luciferase reaction. The generated light was detected using a luminometer.
- Cell-Based Assay of NHE-3 Activity (Persistent Inhibition) The ability of compounds to inhibit human and rat NHE-3-mediated Na+ dependent H+ antiport after application and washout was measured using a modification of the pH sensitive dye method described above. PS120 fibroblasts stably expressing human NHE3 and NHERF2 were obtained from Mark Donowitz (Baltimore, Md.). Opossum kidney (OK) cells were obtained from the ATCC and propagated per their instructions. The rat NHE-3 gene was introduced into OK cells via electroporation, and cells were seeded into 96 well plates and grown overnight. Medium was aspirated from the wells, cells were washed once with NaCl-HEPES buffer (100 mM NaCl, 50 mM HEPES, 10 mM glucose, 5 mM KCl, 2 mM CaCl2, 1 mM MgCl2, pH 7.4), then overlayed with NaCl-HEPES buffer containing 0-30 μM test compound. After a 60 min incubation at room temperature, the test drug containing buffer was aspirated from the cells. Following aspiration, cells were washed once with NaCl-HEPES buffer without drug, then incubated for 30 min at 37° C. with NH4Cl-HEPES buffer (20 mM NH4Cl, 80 mM NaCl, 50 mM HEPES, 5 mM KCl, 2 mM CaCl2, 1 mM MgCl2, pH 7.4) containing 5 μM BCECF-AM. Cells were washed once with Ammonium free, Na+-free HEPES (100 mM choline, 50 mM HEPES, 10 mM glucose, 5 mM KCl, 2 mM CaCl2, 1 mM MgCl2, pH 7.4) and incubated in the same buffer for 10 minutes at room temperature to lower intracellular pH. NHE-3-mediated recovery of neutral intracellular pH was initiated (10 min after compound washout) by addition of Na-HEPES buffer. For the rat NHE3 assay, the Na-HEPES buffer contained 0.4 ethyl isopropyl amiloride (EIPA, a selective antagonist of NHE-1 activity that does not inhibit NHE-3). Changes in intracellular pH were monitored using a FLIPR Tetra (Molecular Devices, Sunnyvale, Calif.) by excitation at λex 439 to 505 nm, and measuring BCECF fluorescence at λem 538 nm. The initial rate of the fluorescence ratio change was used as a measure of NHE-mediated Na+/H+ activity, and reported as the change in fluorescence ratio per minute. Initial rates were plotted as the average of 2 or more replicates, and pIC50 values were estimated using GraphPad Prism.
- pH-based Assay pH dependent Ca2+ responses in TRPV1/CHO cells cultured in a 96-well plate were determined (see, e.g., FIG. 2 of U.S. Patent Application Publication No. US 2009/0170868 A1). In particular, Ca2+ influx into TRPV1/CHO cells in response to low pH as measured by Fura-2 AM fluorescence was determined. The cells were stimulated using 3.0 mM (well numbers B1-B6), 3.1 mM (C1-C6), 3.2 mM (D1-D6), 3.3 mM (E1-E6), 3.4 mM (F1-F6), 3.5 mM (G1-G6), or 3.6 mM (H1-H6) H2SO4 or pH 7.2 measuring buffer without H2SO4 (A1-A6). Culture medium was removed using an 8-channel-pipette (Rainin, USA) from the 96-well plate and the wells were refilled with 100 uL of loading buffer (20 mM HEPES, 115 mM NaCl, 5.4 mM KCl, 0.8 mM MgCl2, 1.8 mM CaCl2, 13.8 mM D-glucose, 2.5 mM probenecid, pH 7.4) containing 5 uM Fura-2 AM (Dojin, Japan). The 96-well plate was incubated at 37° C. for 45 min. The loading buffer was removed from each well. The cells were subsequently washed twice with 150 uL of measuring buffer (20 mM HEPES, 115 mM NaCl, 5.4 mM KCl, 0.8 mM MgCl2, 5.0 mM CaCl2, 13.8 mM D-glucose, 0.1% BSA, pH 7.4) (no probenecid). The wells were then refilled with 80 uL of measuring buffer. After an incubation at 4° C. for 15 min, the 96-well plate was transferred to a model FDSS-3000 plate reader apparatus (Hamamatsu Photonics K.K., Japan). The Fura-2 fluorescent intensity was monitored at a wavelength of 340 nm and at 380 nm, respectively, at a rate of 0.5 Hz for a total of 240 seconds. After 16 time points (32 sec) of baseline detection, 20 uL of agonist solution was added to each well. The final volume was 100 uL/well. Fluorescence intensity ratio refers to the fluorescence intensity at 340 nm over the fluorescence intensity at 380 nm at a particular time point. The baseline was set as the average of the fluorescent intensity ratios for the first 16 time points before the addition of agonist solution. The maximum response was the highest fluorescent intensity ratio during the 60 time points following addition of agonist solution.
- HEK-Blue-hTLR7 assay HEK-Blue-hTLR7 cells were incubated at a density of 250,000˜450,000 cells/mL in a volume of 180 μL in a 96-well plate in Dulbecco's Modified Eagle's medium (DMEM) containing 4.5 g/L glucose, 50 U/mL penicillin, 50 mg/mL streptomycin, 100 mg/mL Normocin, 2 mM L-glutamine, 10% (V/V) heat-inactivated fetal bovine serum for 24 hrs. Then the HEK-Blue-hTLR-7 cells were incubated with addition of 20 μL test compound in a serial dilution in the presence of final DMSO at 1% and perform incubation under 37° C. in a CO2 incubator for 20 hrs. Then 20 μL of the supernatant from each well was incubated with 180 μL Quanti-blue substrate solution at 37° C. for 2 hrs and the absorbance was read at 620˜655 nm using a spectrophotometer. The signalling pathway that TLR7 activation leads to downstream NF-κB activation has been widely accepted, and therefore similar reporter assay was also widely used for evaluating TLR7 agonist (Tsuneyasu Kaisho and Takashi Tanaka, Trends in Immunology, Volume 29, Issue 7, July 2008, Pages 329.sci; Hiroaki Hemmi et al, Nature Immunology 3, 196-200 (2002)).
- IPOne assay IP1 accumulation measurements using the IPOne assay system 1321N1 cells stably expressing human GPR40 receptor (Euroscreen, Belgium) are seeded 24 h before the assay in white 384-well plates in culture medium containing 10% FCS, 1% Na-Pyruvate and 400 μg/mL G418. IP1 is assayed according to the manufacturer's description (Cisbio Bioassays, France). In brief, the assay is started by substitution of the culture medium by stimulation buffer (Hepes 10 mM, CaCl2 1 mM, MgCl2 0.5 mM, KCl 4.2 mM, NaCl 146 mM, glucose 5.5 mM and LiCl 50 mM, pH 7.4). Cells are stimulated for 1 h at 37° C., 5% CO2 by addition of the compounds that are diluted in stimulation buffer containing LiCl. Assays are stopped by adding HTRF-conjugates (IP1-d2 and Anti-IP1 cryptate Tb) and lysis buffer, provided by the manufacturer. After an incubation time of 1 h at room temperature plates are measured using an EnVision , Perkin Elmer. The obtained fluorescence ratios at 665/615 nM are then used to calculate the pEC50 values using Assay Explorer 3.3 Software (Accelrys, Inc.) by interpolation using an IP1 reference curve and subsequent sigmoidal curve fitting allowing for a variable hill slope.
- IPOne assay IP1 accumulation measurements using the IPOne assay system 1321N1 cells stably expressing human GPR40 receptor (Euroscreen, Belgium) are seeded 24 h before the assay in white 384-well plates in culture medium containing 10% FCS, 1% Na-Pyruvate and 400 μg/mL G418. IP1 is assayed according to the manufacturer's description (Cisbio Bioassays, France). In brief, the assay is started by substitution of the culture medium by stimulation buffer (Hepes 10 mM, CaCl2) 1 mM, MgCl2 0.5 mM, KCl 4.2 mM, NaCl 146 mM, glucose 5.5 mM and LiCl 50 mM, pH 7.4). Cells are stimulated for 1 h at 37° C., 5% CO2 by addition of the compounds that are diluted in stimulation buffer containing LiCl. Assays are stopped by adding HTRF-conjugates (IP1-d2 and Anti-IP1 cryptate Tb) and lysis buffer, provided by the manufacturer. After an incubation time of 1 h at room temperature plates are measured using an EnVision , Perkin Elmer. The obtained fluorescence ratios at 665/615 nM are then used to calculate the pEC50 values using Assay Explorer 3.3 Software (Accelrys, Inc.) by interpolation using an IP1 reference curve and subsequent sigmoidal curve fitting allowing for a variable hill slope.
- In Vitro Assay (Protocol 1) Compounds of Formula (I), were diluted in eight concentrations in the extracellular solution composed of physiological saline, buffered with HEPES (mM): NaCl, 137; KCl, 4; CaCl2, 3.8; MgCl2, 1; HEPES, 10; Glucose, 10; pH 7.4. The extracellular solution is composed of (mM) CsCl, 50; CsF, 90; MgCl2, 5; EGTA, 5; HEPES, 10; pH 7.2. The duration of exposure of each compound with the cells expressing Nav 1.7 or Nav 1.8 was at least five minutes and the assays were performed at room temperature.The measurements of the sodium currents of Nav 1.8 and Nav 1.7 were obtained using the voltage protocols described below: a holding voltage of-90 mV was established followed by a voltage phase of 200 ms to-120 mV, followed by a voltage step of 10 mV for 1 second for Nav 1.8 or 0 mV for Nav 1.7, followed by a step of-100 mV for 20 ms, followed by a step of 20 ms for 10 mV for Nav 1.8 or 0 mV for Nav 1.7 (TP1A) before returning to the holding voltage of-90 mV. Protocols were repeated at a frequency of 0.1 Hz and current amplitude was quantified over the TP1A phase log.
- Measurement of Sodium Ion Channel Blocking Effects In order to measure the sodium ion channel blocking effect, an IonFlux16 Auto patch clamp system (Fluxion, Inc.) and a plate for exclusive use were used. The cells were distributed in an extracellular solution (4 mM KCl, 138 mM NaCl, 1 mM MgCl2, 1.8 mM CaCl2, 5.6 mM glucose, 10 mM HEPES, pH 7.45), and then dispensed in the specified region of the plate, and each of the prepared compound samples was diluted at various concentrations, and then dispensed in the specified region of the plate. After the dispensation of the cells, the compound samples and an intracellular solution (100 mM CsF, 45 mM CsCl, 5 mM NaCl, 5 mM EGTA, 10 mM HEPES, pH 7.2) in the plate has been completed, the plate was mounted in the patch clamp system, and whether the compounds inhibited the ion channel was measured according to a set program.Specifically, eight concentrations per compound were set, and percent inhibition was determined by calculating the percentage of inhibition of the peak current, generated after treating the cells with each concentration of the compound for 50 seconds, relative to the peak current generated before treatment with the compound, and the IC50 value was calculated using the Sigma plot program.
- Patch Clamp Assay TRPC5 cells were induced 20-48 hours, removed from growth plates, and replated at low density (to attain good single-cell physical separation) on glass coverslips for measurement. In some cases, cells were grown in low density overnight on glass coverslips. Patch clamp recordings were made in the whole-cell mode with a holding potential of −40 mV. Every 5 seconds, a voltage ramp was applied from −120 to +100 mV, 400 ms in duration. Currents elicited were quantified at −80 mV and +80 mV. The internal solution consisted of 140 mM cesium aspartate, 10 mM HEDTA, 2 mM CaCl2, 2.27 mM MgCl2 and 10 mM HEPES, pH 7.2, with 1,400 nM calculated free Ca2+. The external solution consisted of 150 mM NaCl, 4.5 mM KCl, 1 mM MgCl2, 2 mM CaCl2 10 mM HEPES, 10 mM glucose, 1 mM EGTA, pH 7.4. Upon addition of LaCl3, TRPC5 current was induced only in TRPC5-expressing cells and not in parental HEK293 TREx cells. Removal of the LaCl3 stimulus causes most of the current to go away. Potential blockers were tested for ability to block both inward and outward currents in the continued presence of LaCl3.
- Patch Clamp Electrophysiology Whole cell currents were measured with HEKA EPC-10 amplifiers using PatchMaster software or by using the high throughput QPatch platform (Sophion). Bath solution for all experiments contained (in mM): NaCl 137 mM, KCl 4 mM, CaCl2 1.8 mM, MgCl 2 1 mM, HEPES 10 mM, D-Glucose 10 mM, pH (NaOH) 7.4. In some cases 0.005% cremophor was also added. Intracellular (pipette) solution contained: KCl 130 mM, MgCl 2 1 mM, Mg-ATP 5 mM, HEPES 10 mM, EGTA 5 mM, pH 7.2. During experiments, cells and solutions were maintained at room temperature (19° C.-30° C.). For manual patch clamp recordings, cell culture dishes were placed on the dish holder of the microscope and continuously perfused (1 ml/min) with bath solution. After formation of a Gigaohm seal between the patch electrodes and the cell (pipette resistance range: 2.5 MΩ-6.0 MΩ; seal resistance range: >1 GΩ) the cell membrane across the pipette tip was ruptured to assure electrical access to the cell interior (whole-cell patch-configuration). For experiments using the QPatch system, cells were transferred as suspension to the QPatch system in the bath solution and automated whole cell recordings were performed.
- Pharmacological Assay IP1 accumulation measurements using the IPOne assay system 1321N1 cells stably expressing human GPR40 receptor (Euroscreen, Belgium) are seeded 24 h before the assay in white 384-well plates in culture medium containing 10% FCS, 1% Na-Pyruvate and 400 μg/mL G418. IP1 is assayed according to the manufacturer's description (Cisbio Bioassays, France). In brief, the assay is started by substitution of the culture medium by stimulation buffer (Hepes 10 mM, CaCl2 1 mM, MgCl2 0.5 mM, KCl 4.2 mM, NaCl 146 mM, glucose 5.5 mM and LiCl 50 mM, pH 7.4). Cells are stimulated for 1 h at 37° C., 5% CO2 by addition of the compounds that are diluted in stimulation buffer containing LiCl. Assays are stopped by adding HTRF-conjugates (IP1-d2 and Anti-IP1 cryptate Tb) and lysis buffer, provided by the manufacturer. After an incubation time of 1 h at room temperature plates are measured using an EnVision, Perkin Elmer. The obtained fluorescence ratios at 665/615 nM are then used to calculate the pEC50 values using Assay Explorer 3.3 Software (Accelrys, Inc.) by interpolation using an IP1 reference curve and subsequent sigmoidal curve fitting allowing for a variable hill slope.
- Radioligand Binding Assay HEK-293 cells stably expressing mouse TAAR1 were maintained at 37° C. and 5% CO2 in DMEM high glucose medium, containing fetal calf serum (10%, heat inactivated for 30 min at 56° C.), penicillin/streptomycin (1%), and 375 μg/ml geneticin (Gibco). Cells were released from culture flasks using trypsin/EDTA, harvested, washed twice with ice-cold PBS (without Ca2+ and Mg2+), pelleted at 1,000 rpm for 5 min at 4° C., frozen and stored at −80° C. Frozen pellets were suspended in 20 ml HEPES-NaOH (20 mM, pH 7.4) containing 10 mM EDTA and homogenized with a Polytron (PT 6000, Kinematica) at 14,000 rpm for 20 s. The homogenate was centrifuged at 48,000×g for 30 min at 4° C. Subsequently, the supernatant was removed and discarded, and the pellet resuspended in 20 ml HEPES-NaOH (20 mM, pH 7.4) containing 0.1 mM EDTA using the Polytron (20 s at 14,000 rpm). This procedure was repeated and the final pellet resuspended in HEPES-NaOH containing 0.1 mM EDTA and homogenized using the Polytron. Typically, aliquots of 2 ml membrane portions were stored at −80° C. With each new membrane batch the dissociation constant (Kd) was determined via a saturation curve.
- The Alizarin Assay (ARS) (Lactate) The alizarin-red binding assay is a colorimetric assay used to determine the inhibition affinity of boronate compounds to glucose. The assay is based on a colour shift of alizarin-red upon binding to boronate, which shift can be followed by change in absorbance in the 330-340 nm region. For determination of the inhibitory constant (Ki) between the boronate and the carbohydrate, 400 μM of boronic acids is dissolved in a 20 mM phosphate buffer pH 7.4 under gentle stirring. Upon complete dissolution of the compound, 200 μM of Alizarin red (ARS) is added to the solution. The ARS-boronate solution is then aliquoted into a 96 multiwell plate (black, flat and clear bottom) 1:1 with appropriate carbohydrate. In particular, L-lactate solutions are prepared in a 20 mM phosphate buffer pH 7.4 at these concentrations respectively: 1000, 500, 250, 100, 50, 25, 10, 5, 2.5, 1, 0.25, 0.1 mM and 2500, 1000, 500, 100, 50, 10, 5, 1, 0.5, 0.1, 0.05, 0.01 mM. The plate with ARS-boronate mixed with carbohydrate is incubated 20 minutes at room temperature. After 5 minutes of centrifugation at 4000 rpm the plate is placed in a multiwell spectrometer (Spectra Max, Molecular Devices) for absorption detection.
- hERG-Channel Assay Cells were superfused with a bath solution containing (mM): NaCl (137), KCl (4.0), MgCl2 (1.0), CaCl2 (1.8), Glucose (10), HEPES (10), pH 7.4 with NaOH. Patch pipettes were made from borosilicate glass tubing using a horizontal puller and filled with pipette solution containing (mM): K-aspartate (130), MgCl2 (5.0), EGTA (5.0), K2ATP (4.0), HEPES (10.0), pH 7.2 with KOH. Resistance of the microelectrodes was in the range between 2 and 5 MΩ. Stimulation and Recording:Membrane currents were recorded using an EPC-10 patch clamp amplifier and PatchMaster software. hERG-mediated membrane currents were recorded at 35° C., using the whole-cell configuration of the patch-clamp technique. Transfected HEK293 cells were clamped at a holding potential of -60 mV and hERG-mediated inactivating tail currents were elicited using a pulse pattern with fixed amplitudes (activation/inactivation: 40 mV for 2000 ms; recovery: -120 mV for 2 ms; ramp to 40 mV in 2 ms; inactivating tail current: 40 mV for 50 ms) repeated at 15 s intervals. During each inter-pulse interval 4 pulses scaled down by a factor of 0.2 were recorded for a P/n leak subtraction procedure. R. compensation was employed up to a level that safely allowed recording devoid of ringing.
- CYP Inhibition and Pre-Incubation CYP Inhibition Assays Use of in vitro assays to evaluate the inhibition potential of new drug candidates towards CYP-mediated metabolism has been shown to be effective as part of a strategy to minimise the chances of drug interactions with co-administered drugs. The inhibitory potency of the test compound towards 5 human cytochrome P450 isoforms (CYP1A2, 2C8, 2C9, 2D6, and 3A4) was determined. More preferred examples of the present invention have CYP inhibition IC50≥10 μM.For CYP3A4 time dependent inhibitory potential was also tested by applying a 30 min pre-incubation time of the test compound in metabolically active incubation system. If a time-dependent inhibition of CYP3A4 is observed, this is a hint of an irreversible mechanism-based inhibition of the CYP3A4 activity by the test compound. More preferred examples of the present invention have pre-incubation CYP inhibition IC50≥20 μM.Method Description CYP Inhibition AssayHuman liver microsomes (pooled, >30 male and female donors) were incubated with individual CYP isoform-selective standard probes (phenacetin for CYP1A2, amodiquine for CYP2C8, diclofenac for CYP2C9, dextromethorphan for CYP2D6 and midazolam for CYP3A4) in the absence and presence of increasing concentrations of the test compound in order to compare the extent of formation of the respective metabolite. In addition, a set of incubation in the absence of test compound was used as a negative control. Furthermore, the inhibitory potency of standard inhibitors was included as positive controls (fluvoxamine for CYP1A2, montelukast for CYP2C8, sulfaphenazole for CYP2C9, fluoxetine for CYP2D6, ketoconazole for CYP3A4 and mibefradil for CYP3A4-preincubation). Incubation conditions (protein and probe substrate concentration, incubation time) were optimised with regard to linearity and metabolite turnover. Incubation medium consisted of 50 mM potassium phosphate buffer (pH 7.4) containing 1 mM EDTA, NADPH regenerating system (1 mM NADP, 5 mM glucose 6-phosphate, glucose 6-phosphate dehydrogenase (1.5 U/mL). Sequential dilutions and incubations were performed on a Genesis Workstation (Tecan, Crailsheim, FRG) in 96-well plates at 37° C. A final incubation volume of 200 μL was used. Reactions were stopped by addition of 100 μL acetonitrile containing the respective internal standard. Precipitated proteins were removed by centrifugation of the well plate, supernatants were combined and analyses were performed by LC-MS/MS. The LC-MS/MS quantification of the metabolites paracetamol (CYP1A2), desethylamodiaquine (CYP2C8), 4-hydroxydiclofenac (CYP2C9), dextrorphan (CYP2D6), and 1-hydroxyidazolam (CYP3A4) was performed with a PE SCIEX API 3000 LC/MS/MS system (Applied Biosystems, MDS Sciex, Concord, Ontario, Canada).
- hERG Electrophysiological Assay Electrophysiological recordings (all performed at RT) from stably transfected CHO hKv11.1 cells were obtained using the Nanion Syncropatch 768PE. Test compounds, vehicle or positive controls were added with 6 compound plates each at a different concentration to allow cumulative dosing onto cells (10 mM, 3.167 mM, 1 mM, 0.3167 mM, 0.1 mM, 0.03167 mM). 600 Figure US11325906-20220510-P00001of compound is resuspended into 90 μl of reference buffer (in mM, NaCl 80, KCL 4, CaCl 5, MgCl 1, NMDG Cl 60, D-Glucose monohydrate 5, HEPES 10 (pH7.4 HCL, 298 mOsm) for a final compound concentration of 39.6 μM, 13.2 μM, 4.4 μM, 1.46 μM, 0.48 μM, 0.16 μM. For each Nanion Syncropatch 768PE run, the current amplitude in each cell in the presence of extracellular solution (in mM, NaCl 80, KCL 4, CaCl 5, MgCl 1, NMDG Cl 60, D-Glucose monohydrate 5, HEPES 10 (pH7.4 HCL, 298 mOsm) is measured with all liquid additions performed using the Syncropatch liquid handling system. Add 40 μL external solution (in mM, HBPS, CaCl2 2, MgCl2 1 (pH7.4, NaOH) to 384 well multihole medium resistance recording chip and perfuse internal buffer (in mM, KF 130, KCl 20, MgCl2 1, EGTA 10, HEPES 10, Escin 25 (all Sigma-Aldrich; pH 7.2-7.30 using 10 M KOH, 320 mOsm) to the underside of plate. Dispense 20 μL of cells at a density of 1e6 cells/ml maintained at 9° C. into each well of the chip followed by 20 μL of seal enhancer (in mM, NaCl 80, KCl 3, CaCl 10, HEPES 10, MgCl 1 (pH7.4 NaOH). Perform wash step leaving a residual volume of 40 μL. Dispense 40 μL of reference buffer to establish a stable baseline prior to the addition of test compounds, with a removal step of 40 μL after 3 min, repeat this step. Dispense 40 μL of compound concentration 1 (0.16 μM), real time recordings for 3 min exposure prior to removal of 40 μL. This step is repeated for 5 further subsequent compound plates to generate cumulative curve analysis. All data is leak subtracted, 2 pulses to −80 mV 100 ms with 100 ms delay. Outward K+ currents are then evoked by voltage step to +60 mV from a holding potential of −90 mV, Each pulse is delivered at a frequency of 2 Hz with a 15 s pulse interval.
- Determination of Adenosine Transport Activity To measure adenosine transport activity of ENT-1 mammalian cells, stable cells expressing the mouse ENT-1 transporter were plated on day 1 in 96-well culture plates at the density of 60,000 cells/well, in complete DMEM/F12 medium supplemented with glutamax, 10% FBS and 10 μg/ml puromycin. On day 2, the medium was aspirated and the cells were washed twice with uptake buffer (10 mM Hepes-Tris, pH 7.4 containing 150 mM NaCl, 1 mMCaCl2, 2.5 mM KCl, 2.5 mM MgSO4, 10 mM D-glucose) (UB). For inhibition experiments, cells were then incubated at RT with various concentrations of compounds with 1% DMSO final. Non-specific uptake was defined in the presence of 10 μM S-(4-Nitrobenzyl)-6-thioinosine (NBTI, Sigma Cat #N2255).A solution containing [2,8-3H]-adenosine 6 nM (40 Ci/mmol, American Radiolabeled chemicals Inc, Cat #ART 0287A) was then immediately added to the wells. The plates were then incubated for 20 min with gentle shaking and the reaction was stopped by aspiration of the mixture and washing (three times) with ice-cold UB. The cells were lysed by the addition of scintillation liquid, shaken 3 hours and the radioactivity in the cells was estimated using a microplates scintillation counter (TopCount NXT, Packard).
- Electrophysiological Assay (EP) (In Vitro Assay) Sodium currents are measured in the whole-cell configuration using Syncropatch 384PE (Hanlon Technologies, Germany). 1NPC®-384 chips with custom medium resistance and single hole mode are used. Internal solution consists of (in mM): 110CsCl, 10CsCl, 20EGTA, and 10Hepes (pH adjusted to 7.2); and external solution contains (in mM): 60NMDG, 80NaCl, 4 KCl, 1MgCl2, 2CaCl2, 2D-Glucose monohydrate, 10Hepes (pH adjusted to 7.4 with NaOH).After system flushing, testing compounds are dissolved in external solution containing 0.1% Pluronic F-127. The chip is moved into the measuring head and the instrument primes the chip with external and internal solutions. 10 μl cells are added to the chip from a cell hotel, and a negative pressure of −50 mBar is applied to form a seal. Following treatment with seal enhancer solution and wash-off with external solution, negative pressure of −250 mbar is applied for 1 second to achieve the whole-cell configuration, followed by three washing steps in external solution. 20 μl of compounds is added to 40 μl in each well (1:3 dilution of compounds), and after mixing, 20 μl is removed so the volume is retained at 40 ul. After approximately 13 minutes recordings, 20 μl/well of 2 uM TTX, or 333 uM Tetracaine (for Nav1.5) is added to achieve full block.
- Electrophysiological Assay (In Vitro Assay) Sodium currents were measured using the patch clamp technique in the whole-cell configuration using either a PatchXpress automated voltage clamp or manually using an Axopatch 200B (Axon Instruments) or Model 2400 (A-M systems) amplifier. The manual voltage clamp protocol was as follows: Borosilicate glass micropipettes were fire-polished to a tip diameter yielding a resistance of 2-4 Mohms in the working solutions. The pipette was filled with a solution comprised of: 5 mM NaCl, 10 mM CsCl, 120 mM CsF, 0.1 mM CaCl2, 2 mM MgCl2, 10 mM HEPES, 10 mM EGTA; and adjusted to pH 7.2 with CsOH. The external solution had the following composition: 140 mM NaCl, 5 mM KCl, 2 mM CaCl2, 1 mM MgCl2, 10 mM HEPES; and adjusted to pH 7.4 with NaOH. In some studies, the external sodium was reduced by equimolar replacement with choline. Osmolarity in the CsF internal and NaCl external solutions was adjusted to 300 mOsm/kg and 310 mOsm/kg with glucose, respectively. All recordings were performed at ambient temperature in a bath chamber with a volume of 150 μL. Control sodium currents were measured in 0.5% DMSO. Controls and representative compounds of the invention were applied to the recording chamber through a 4-pinch or 8-pinch valve bath perfusion system manufactured by ALA Scientific Instruments.
- In Vitro Human SGLT1 Inhibition Assay Human sodium/glucose co-transporter type 1 (SGLT1; accession number NP_000334; GI: 4507031) was cloned into pIRESpuro2 vector for mammalian expression (construct: HA-SGLT1-pIRESpuro2). HEK293 cells were transfected with the human HA-SGLT1-pIRESpuro2 vector and the bulk stable cell line was selected in presence of 0.5 μg/mL of puromycin. Human HA-SGLT1 cells were maintained in DMEM media containing 10% FBS, 1% GPS and 0.5 μg/mL of puromycin. The HEK293 cells expressing the human HA-SGLT1 were seeded in 384 well plates (30,000 cells/well) in DMEM media containing 10% FBS, 1% GPS and 0.5 μg/mL of puromycin, then incubated overnight at 37 C, 5% CO2. Cells were then washed with uptake buffer (140 mM NaCl, 2 mM KCl, 1 mM CaCl2, 1 mM MgCl2, 10 mM HEPES, 5 mM Tris, 1 mg/mL bovine serum albumin (BSA), pH 7.3). Twenty microliters of uptake buffer with or without testing compounds were added to the cells. Then, 20 microliters of uptake buffer containing 14C-AMG (100 nCi) were also added to cells. The cell plates were incubated at 37° C., 5% CO2 for 1-2 hours. After washing the cells with uptake buffer, scintillation fluid was added (40 microliters/well) and 14C-AMG uptake was measured by counting radioactivity using a scintillation coulter (TopCoulter NXT; Packard Instruments).
- In Vitro Human SGLT2 Inhibition Assay Human sodium/glucose co-transporter type 2 (SGLT2; accession number P31639; GI:400337) was cloned into pIRESpuro2 vector for mammalian expression (construct: HA-SGLT2-pIRESpuro2). HEK293 cells were transfected with the human HA-SGLT2-pIRESpuro2 vector and the bulk stable cell line was selected in presence of 0.5 μg/mL of puromycin. Human HA-SGLT2 cells were maintained in DMEM media containing 10% FBS, 1% GPS and 0.5 μg/mL of puromycin. The HEK293 cells expressing the human HA-SGLT2 were seeded in 384 well plates (30,000 cells/well) in DMEM media containing 10% FBS, 1% GPS and 0.5 μg/mL of puromycin, then incubated overnight at 37 C, 5% CO2. Cells were then washed with uptake buffer (140 mM NaCl, 2 mM KCl, 1 mM CaCl2, 1 mM MgCl2, 10 mM HEPES, 5 mM Tris, 1 mg/mL bovine serum albumin (BSA), pH 7.3). Twenty microliters of uptake buffer with or without testing compounds were added to the cells. Then, 20 microliters of uptake buffer containing 14C-AMG (100 nCi) were added to the cells. The cell plates were incubated at 37° C., 5% CO2 for 1-2 hours. After washing the cells with uptake buffer, scintillation fluid was added (40 microliters/well) and 14C-AMG uptake was measured by counting radioactivity using a scintillation coulter (TopCoulter NXT; Packard Instruments).
- IonWorks Barracuda (IWB) Automated Patch Clamp Assay Human Nav1.7 currents were recorded in population patch-clamp mode with the IWB automated electrophysiology system (Molecular Devices, LLC, Sunnyvale, CA). Spiking HEK cells (without Kir2.1 transfection) were cultured and prepared for recordings as previously described for IonWorks Quattro testing1. The external solution consisted of the following (in mM): NaCl 140, KCl 5, CaCl2 2, MgCl2 1, HEPES 10, and glucose 11, pH 7.4, with N-methyl-D-glucamine at 320 mOsmol. The internal solution consisted of the following (in mM): KCl 70, KF 70, MgCl2 0.25, HEDTA 5, and HEPES 10, pH 7.25, with Nmethyl-D-glucamine, 300 mOsmol. From a holding potential of −110 mV, currents were elicited by a train of 26 depolarizations of 150 ms duration to −20 mV at a frequency of 5 Hz. Cells were then clamped to −20 mV for a period of 4 minutes in the presence of a single concentration of test compound. Following this compound incubation period, cells were clamped to −110 mV for three seconds to recover unbound channels and put through the same 26 pulse voltage protocol as above. Peak inward current during the 26th pulse to −20 mV in the presence of compound was divided by the peak inward current evoked by the 26th pulse to −20 mV in the absence of compound to determine percent inhibition.
- SGLT1/2 in-vitro assay To analyze a sodium-dependent glucose transport, cells for expressing hSGLT1 and hSGLT2 were seeded at 1×10⁵ cells per well into a 96-well culture plate, after which resulting cells were cultured in an RPMI 1640 medium containing 10% fetal bovine serum (FBS). In 1 day after culture, the resulting cells were cultured in a pre-treatment buffer solution (10 mM HEPES, 5 mM tris, 140 mM choline chloride, 2 mM KCl, 1 mM CaCl2 and 1 mM MgCl2, pH 7.4) under 37° C./5% CO2 conditions for 10 minutes. Then, the resulting cells were cultured in a uptake buffer solution (10 mM HEPES, 5 mM tris, 140 mM NaCl, 2 mM KCl, 1 mM CaCl2, 1 mM MgCl2 and 1 mM AMGS pH 7.4) containing 14C-AMG (8 μM) and a compound of the present disclosure or a dimethyl sulfoxide (DMSO) vehicle under 37° C./5% CO2 conditions for 2 hours. After culture, the cells were washed twice with a washing buffer solution (a pre-treatment buffer solution containing 10 mM AMG at room temperature), after which a radiation thereof was measured by using a liquid scintillation counter. IC50 of each compound was measured according to a non-linear regression analysis by using SigmaPlot (Document Analytical Biochemistry 429: 70-75, Molecular and Cellular Biochemistry 280: 91-98, 2005).
- SGLT2 Glucose Transport Test 1) Experimental buffer: 10 mM 4-hydroxyethylpiperazine ethanesulfonic acid (HEPES), 1.2 mM magnesium chloride (MgCl2), 4.7 mM potassium chloride (KCl), 2.2 mM calcium chloride (CaCl2)) and 120 mM sodium chloride (NaCl).2) Termination buffer: 10 mM 4-hydroxyethylpiperazine ethanesulfonic acid (HEPES), 1.2 mM magnesium chloride (MgCl2), 4.7 mM potassium chloride (KCl), 2.2 mM calcium chloride (CaCl2), 120 mM sodium chloride (NaCl) and 1 μM LX4211.3) The compound was diluted with 100% dimethyl sulfoxide (DMSO) with a starting concentration of 10 μM and 8 points of 5-fold serial dilution.4) 6 μM [14C]-labeled methyl α-D-glucopyranoside was prepared with experimental buffer.5) The cells were treated with 49 μL of experimental buffer, 1 μL of gradient diluted compound, and 50 μL of 6 μM [14C]isotope-labeled sugar solution at 37° C. for 2 hours.6) The liquid in the well was aspirated and the cells were rinsed 3 times with termination buffer.7) The cells were lysed with 50 μL of 10% sodium hydroxide solution, the cell lysate was aspirated into the scintillation tube, and 2 mL of scintillation fluid was added.8) An isotope detector (Tricarb) was used to read.9) The data was calculated by GraphPad Prism 5.0 software: log(inhibitor) vs. response—Variable slope to obtain the IC50 value of the test compound.
- Characterization of Antagonism at Human 5-HT2A Receptors using Fluorometric Ca2+Detection CHO-K1 cells expressing human recombinant 5-HT2A receptors and Gα16 (purchased from Euroscreen Fast, Brussels, BE) in culture were cryopreserved according to established protocols, using 90% FBS/10% DMSO as medium. Prior to the experiment, cells were thawed, resuspended in PowerCHO™ 2 medium (Lonza, Basel, Switzerland) supplemented with 10% fetal bovine serum (FBS), 1% penicillin-streptomycin antimycotic solution, and 1% pyruvate. Cells were seeded in 96-well microplates at a density of 40,000 cells/well and incubated overnight at 37° C. in a humidified atmosphere containing 5.0% CO2. On the day of the experiment, plates were washed with assay buffer (140 mM NaCl, 5 mM KCl, 2 mM MgCl2, 2 mM CaCl2, 10 mM 2-[4-(2-hydroxyethyl) piperazin-1-yl]ethane-1-sulfonic acid (HEPES), 10 mM glucose, 2 mM probenecid, pH 7.4) using a plate washer (Elx405UCWS, Biotek, Winooski, VT, USA), then 50 μL/well of 4 μM Fluo-4 AM (Thermo Fisher Scientific) in assay buffer was added. After dye loading (60 minutes, 37° C., in darkness), plates were washed with assay buffer using the plate washer leaving 50 L/well residual volume, then 50 L/well assay buffer containing vehicle (3% DMSO in assay buffer) or test compounds (3× of the final concentration) were added and the cells were incubated for an additional 10 minutes at 37° C.
- Functional Calcium Assay CHO cells stably expressing human dopamine receptor type 2, long variant (hD2L), coupled to Gα16 protein (CHO-Gα16-hD2L) were seeded into black walled clear-base 384-well plates at a density of 8,000 cells per well and grown overnight at 37° C. After washing with the assay buffer (20 mM HEPES, 145 mM NaCl, 5 mM KCl, 5.5 mM glucose, 1 mM MgCl2 and 2 mM CaCl2, pH 7.4) containing 2.5 mM Probenecid, cells were incubated with the cytoplasmic Ca2+ probe Fluo-4 AM at 1 μM (final concentration), 37° C. for 60 min. Plates were washed three times as above and placed into a Fluorometric Imaging Plate Reader (FLIPR Tetra, Molecular Devices) to monitor cell fluorescence (ex=470-495 nm, em=515-575 nm) before and after the addition of different concentrations of test compounds. Compounds of invention were dissolved in DMSO and 200-fold diluted with assay buffer plus 0.01% Pluronic F-127. Cells were exposed first to test compounds for 10 min, then to a submaximal concentration of the hD2 receptor agonist dopamine (EC80, 50-140 nM). The fluorescence before compound addition (baseline) and before and after addition of agonist challenge was monitored. The peak of Ca2+ stimulation (baseline subtracted) was plotted versus the concentration of test compound and the curve fitted using a four-parameter logistic equation (XLfit) to assess the agonist/antagonist potency and maximal response.
- Functional Calcium Assay Functional Calcium Assay at hD2 recombinant receptor. CHO cells stably expressing human dopamine receptor type 2, long variant (hD2L), coupled to Gα16 protein (CHO-Gα16-hD2L) were seeded into black walled clear-base 384-well plates at a density of 8,000 cells per well and grown overnight at 37° C. After washing with the assay buffer (20 mM HEPES, 145 mM NaCl, 5 mM KCl, 5.5 mM glucose, 1 mM MgCl2 and 2 mM CaCl2, pH 7.4) containing 2.5 mM Probenecid, cells were incubated with the cytoplasmic Ca2+ probe Fluo-4 AM at 1 μM (final concentration), 37° C. for 60 min. Plates were washed three times as above and placed into a Fluorometric Imaging Plate Reader (FLIPR Tetra, Molecular Devices) to monitor cell fluorescence (ex=470-495 nm, em=515-575 nm) before and after the addition of different concentrations of test compounds. Compounds of invention were dissolved in DMSO and 200-fold diluted with assay buffer plus 0.01% Pluronic F-127. Cells were exposed first to test compounds for 10 min, then to a submaximal concentration of the hD2 receptor agonist dopamine (EC80, 50-140 nM). The fluorescence before compound addition (baseline) and before and after addition of agonist challenge was monitored. The peak of Ca2+ stimulation (baseline subtracted) was plotted versus the concentration of test compound and the curve fitted using a four-parameter logistic equation (XLfit) to assess the agonist/antagonist potency and maximal response.
- Functional Calcium Assay at hD2 Recombinant Receptor CHO cells stably expressing human dopamine receptor type 2, long variant (hD2L), coupled to Gα16 protein (CHO-Gα16-hD2L) were seeded into black walled clear-base 384-well plates at a density of 8,000 cells per well and grown overnight at 37° C. After washing with the assay buffer (20 mM HEPES, 145 mM NaCl, 5 mM KCl, 5.5 mM glucose, 1 mM MgCl2 and 2 mM CaCl2, pH 7.4) containing 2.5 mM Probenecid, cells were incubated with the cytoplasmic Ca2+ probe Fluo-4 AM at 1 μM (final concentration), 37° C. for 60 min. Plates were washed three times as above and placed into a Fluorometric Imaging Plate Reader (FLIPR Tetra, Molecular Devices) to monitor cell fluorescence (ex=470-495 nm, em=515-575 nm) before and after the addition of different concentrations of test compounds. Compounds of invention were dissolved in DMSO and 200-fold diluted with assay buffer plus 0.01% Pluronic F-127. Cells were exposed first to test compounds for 10 min, then to a submaximal concentration of the hD2 receptor agonist dopamine (EC80, 50-140 nM). The fluorescence before compound addition (baseline) and before and after addition of agonist challenge was monitored. The peak of Ca2+ stimulation (baseline subtracted) was plotted versus the concentration of test compound and the curve fitted using a four-parameter logistic equation (XLfit) to assess the agonist/antagonist potency and maximal response.
- Functional Calcium Assay at hD2 recombinant receptor CHO cells stably expressing human dopamine receptor type 2, long variant (hD2L), coupled to Gα16 protein (CHO-Gα16-hD2L) were seeded into black walled clear-base 384-well plates at a density of 8,000 cells per well and grown overnight at 37° C. After washing with the assay buffer (20 mM HEPES, 145 mM NaCl, 5 mM KCl, 5.5 mM glucose, 1 mM MgCl2 and 2 mM CaCl2, pH 7.4) containing 2.5 mM Probenecid, cells were incubated with the cytoplasmic Ca2+ probe Fluo-4 AM at 1 μM (final concentration), 37° C. for 60 min. Plates were washed three times as above and placed into a Fluorometric Imaging Plate Reader (FLIPR Tetra, Molecular Devices) to monitor cell fluorescence (ex=470-495 nm, em=515-575 nm) before and after the addition of different concentrations of test compounds. Compounds of invention were dissolved in DMSO and 200-fold diluted with assay buffer plus 0.01% Pluronic F-127. Cells were exposed first to test compounds for 10 min, then to a submaximal concentration of the hD2 receptor agonist dopamine (EC80, 50-140 nM). The fluorescence before compound addition (baseline) and before and after addition of agonist challenge was monitored. The peak of Ca2+ stimulation (baseline subtracted) was plotted versus the concentration of test compound and the curve fitted using a four-parameter logistic equation (XLfit) to assess the agonist/antagonist potency and maximal response.
- Inhibition Assay Evaluation of a human P2X7 receptor inhibitory activity Stably expressing cell line (1321N1 cell transfected with the human P2X7 receptor gene (GenBank accession number NM_002562.5 including T606C and G952A SNP)) was used. The cells were seeded in a 384-well microtiter plate at a concentration of 8000 cells/well and cultured in the medium (10% fetal bovine serum, 25 mM HEPES, 1% penicillin and streptomycin in DMEM) for one day at 37° C. under 5% carbon dioxide atmosphere. After replacing with 20 μL of the HBSS buffer (20 mM HEPES, 55.6 mM D-glucose, 1× HBSS(−), pH7.4-7.5), 15 μL of 17.3 μM Yo-Pro solution in the HBSS buffer was added. The plate was placed in high-throughput cellular screening system FLIPR TETRA (Molecullar Devices, LLC.) and 15 μL of 130 μM BzATP solution in the HBSS buffer was added. Measurement of fluorescence intensity by FLIPR TETRA was started. After eight minutes, 15 μL of DMSO solutions containing different concentrations of the compound of the present invention as prepared by dilution with the HBSS buffer were dispensed to each well through the built-in automatic dispenser, and the measurement of fluorescence intensity was continued for 20 minutes. The maximum fluorescence intensity without the compound of the present invention is calculated as 0% inhibition and the maximum fluorescence intensity when the reference compound was added is calculated as 100% inhibition.
- Inhibition of hERG Potassium Channel Inhibition of hERG Potassium Channel by Prepared Compounds The final concentrations of test compounds were all prepared on the day of experiment and then dissolved in an extracellular fluid. The extracellular fluid (mM) was: NaCl, 137; KCl, 4; CaCl2, 1.8; MgCl2, 1; HEPES, 10; glucose 10; pH 7.4 (NaOH titration). All the test and control compound solutions contained 0.3% DMSO. HEK293 cells stably expressing the hERG ion channel were transferred to a perfusion chamber and perfusion was carried out using the extracellular fluid. A intracellular fluid was stored in small batches in a -80 C. freezer and thawed the day of experiment. The intracellular fluid (mM) was: K Aspartate, 130; MgCl2, 5; EGTA 5; HEPES, 10; Tris-ATP 4; pH 7.2 (KOH titration). Electrodes were produced by pulling with PC-10 (Narishige, Japan). Whole-cell patch-clamp recording was carried out. Noise was filtered at one fifth of the sampling frequency. The cells were clamped at -80 mV, then depolarized to 40 mV with a 4 second lasting square wave, and hyperpolarized to -40 mV with a 2 second lasting square wave to give a hERG tail current. This procedure was repeated every 20 seconds. The hERG tail current was a pure hERG current. The maximum current induced by the second square wave was detected, and after it was stable, perfusion was carried out using the test compounds. After the reaction was stable, the blocking intensity was calculated.
- TRPA1 Inhibitory Activity Assay Ion Works Barracuda (IWB) automated patch clamp detection was used as test method: HEK293 cells stably expressing TRPA1 were placed in DMEM medium containing 15 μg/mL Blasticidin S HCl, 200 μg/mL Hygromycin B and 10% FBS in the T175 culture flask, and cultured in 37° C., 5% CO2 incubator. When the cell density reached about 80%, the culture medium was removed, rinsed with phosphate buffered saline (PBS) without calcium and magnesium. 3 mL of Trypsin was added to digest for 2 min, 7 mL of culture medium was added to terminate the digestion. The cells were collected to 15 mL centrifuge tube and centrifuged at 800 rpm for 3 min. After the supernatant was removed, the cells were added to appropriate volume of extracellular fluid for re-suspending, and the cell density was controlled at 2-3×10⁶/mL for IWB experiment. Extracellular fluid formulation (in mM): 140 NaCl, 5 KCl, 1 MgCl2, 10 HEPES, 0.5 EGTA, 10 Glucose (pH 7.4); intracellular fluid formulation (in mM): 140 CsCl, 10 HEPES, 5 EGTA, 0.1 CaCl2, 1 MgCl2 (pH 7.2). 28 mg/mL of amphotericin B was freshly prepared with DMSO on the day of experiment, and then final concentration of 0.1 mg/mL was prepared with intracellular fluid.Population patch clamp (PPC) plate was used in IWB experiment. The entire detection process was automatically carried out by the instrument.
- UDP-Glo Glucosylceramide Synthase Biochemical Assay Using Promega's UDP-Glo™ Glycosyltransferase assay kit (Promega Corporation, Madison, WI, USA (Promega)), GCS activity was indirectly measured by detecting the amount of UDP produced. An aliquot of GCS enzyme (1.5 μg crude golgi preparation, total protein) and titrated test compound were aliquoted to each well and incubated for 30 minutes at room temperature. Substrate mixture was prepared by mixing C6 ceramide (Avanti Polar Lipids, Alabaster, AL USA (Avanti)) (micelles prepared at 0.6 mM in 0.6 mM DOPC) and UDP-glucose (20 μM; Promega), at concentrations equivalent to 2×Km, in assay buffer (25 mM HEPES (pH 7.5), 50 mM KCl, 5 mM MgCl2). An equivalent volume of substrate mixture was then added to each well. Following a 20 h incubation at room temperature to allow for GCS turnover of substrate, an equal volume of UDP detection reagent (Promega) was added to each well and incubated for an additional 75 minutes at room temperature to simultaneously convert the accumulated UDP product into ATP and generate light in a luciferase reaction. The generated light was detected using a luminometer.Random luminescence values (RLUs) were normalized to mean “min” and “max” effects, as determined on each plate. “Min” was defined as the mean of the values of the wells treated with vehicle (DMSO) and which represent 0% inhibition; “max” was defined as the mean of the values of the wells treated with a reference inhibitor and which represent the 100% effect.
- mmTV-luciferase reporter assay An AR-response element is contained within the mmTV sequence and drives the expression of luciferase. The effect of antiandrogens (competitive antagonists) on this process is measured by quantifying the amount of luciferase activity after 24 hours in the presence of varying concentrations of antiandrogens. From these values, an IC50 for each antagonist is calculated. Experimentally, HeLa cells were maintained in Dulbecco's modified Eagle's medium H-21 4.5 g/L glucose, containing 10% steroid depleted fetal bovine serum, 50 units/mL penicillin. For transfection, (1×10⁵) cells per well were plated and incubated overnight. A mixture of typically 200 ng of mmTV responsive luciferase reporter plasmid, 10 ng of β-actin-β-galactosidase internal control, 10 ng of AR full length CMV expression vector or empty vector control, and 10-100 ng of β-catenin or empty vector control were mixed with 0.5 μL of transfection reagent from BioRad and incubated for 20 min and then plated in 24 well plate triplicates. Cells were induced with 1 nM DHT and 0.1 nM-30 uM compounds after 3 hrs and then incubated overnight. Cells were collected, and pellets were lysed in 100 μL of 100 mM Tris-HCl (pH 7.5) containing 0.1% Triton X-100. Luciferase and β-galactosidase activities were measured using the Luciferase Assay System (Promega) and Galacto-Light Plus-galactosidase reporter gene assay system (Applied Biosystems), according to the manufacturer's instructions.
- 5-HT2B Agonist Activity Assay Evaluation of the agonist activity of compounds (I), (Ia) and (Ib) at the human 5-HT2B receptor was performed by Eurofins/Cerep (France) measuring the compound effects on inositol monophosphate (IP1) production using the HTRF detection method. Briefly, the human 5-HT2B receptor was expressed in transfected CHO cells. The cells were suspended in a buffer containing 10 mM Hepes/NaOH (pH 7.4), 4.2 mM KCl, 146 mM NaCl, 1 mM CaCl2, 0.5 mM MgCl2, 5.5 mM glucose and 50 mM LiCl, then distributed in microplates at a density of 4100 cells/well and incubated for 30 min at 37° C. in the presence of buffer (basal control), test compound or reference agonist. For stimulated control measurement, separate assay wells contained 1 μM 5-HT. Following incubation, the cells were lysed and the fluorescence acceptor (fluorophen D2-labeled IP1) and fluorescence donor (anti-IP1 antibody labeled with europium cryptate) were added. After 60 min at room temperature, the fluorescence transfer was measured at lambda(Ex) 337 nm and lambda(Em) 620 and 665 nm using a microplate reader (Rubystar, BMG). The IP1 concentration was determined by dividing the signal measured at 665 nm by that measured at 620 nm (ratio). The results were expressed as a percent of the control response to 1 μM 5-HT. The standard reference agonist was 5-HT, which was tested in each experiment at several concentrations to generate a concentration-response curve from which its EC50 value is calculated as described above for dopamine functional assays.
- Caco-2 cells assay To determine potency of compounds on inhibition of transporters, bi-directional transport studies are performed in Caco-2 cells (American Type Culture Collection, Manassas, Va.) at 37° C. in air, according toXia et al. (Expression, localization and functional characteristics of breast cancer resistance protein in Caco-2 cells. Drug Met. Disp., 33 (5): 637-643 (2005)). Prior to each experiment, the confluent cell monolayers on Transwell inserts are washed and equilibrated for 30 minutes with transport media (Hank's balanced salt solution (HBSS) containing 10 mM of N-2-hydroxyethyl-piperazine-N'-2-ethanesulfonic acid (HEPES) and 10 mM of glucose, pH 7.4). The experiment is initiated by adding a solution containing the 3H-digoxin (25 nM, substrate for p-gp), or 3H-E3S (17 nM, substrate for BCRP) to either the apical (for A-to-B transport) or basolateral (for B-to-A transport) compartment in the absence or presence of various concentrations of Compound (I-1) or Ko143. At preset time points, 0.05 mL aliquot of receiving solutions are sampled from the basolateral side (for A-to-B transport) or from the apical side (for B-to-A transport), and replaced immediately with an equal amount of fresh transport media except at the last time point (the end of the incubation). The radioactivity in each sample is measured by 1450 MicroBeta TriLux, a microplate scintillation and luminescence counter (PerkinElmer Life Sciences). Radioactivity (3H) of the dosing solution is measured and used to calculate the initial donor concentration of the substrate.
- Evaluation of Inhibitory Activities Against GCS (1) MaterialsA549 cells (ATCC, CCL-185)NBD C6-ceramide (Thermo Fisher, N1154)UDP-glucose (Sigma, U4625)Potassium chloride (Sigma, P9333)UltraPure™ 0.5 M EDTA (Invitrogen, 15575-038)BCA protein assay kit (Thermo Fisher, 23227)Ibiglustat (Shanghai Systeam Biochem Co., ltd, Genz-682452)HEPES (sigma, H3375)Protease/phosphatase inhibitor cocktail (CST, 5872s)DMEM (GIBCO, 11995-065)FBS (GIBCO, 16000-044)Antibiotic-Antimycotic (100×) (GIBCO, 15240-112)200 mM L-glutamine (GIBCO, 25030081)PBS (GIBCO, 10010-023)0.25% Trypsin-EDTA (GIBCO, 25200-056)Dimethyl sulfoxide (Sigma, 34869)2-propanol, HPLC grade (Burdick & Jackson, AH323-4)Hexane, HPLC grade (Burdick & Jackson, AH216-4)Chloroform (Sigma, C2432)Methanol (Merck, 1.06009.1011)(2) Protocol<1> Preparation of Cell LysatesA549 cells (ATCC, CCL-185) were cultured in a DMEM medium supplemented with 10% fetal bovine serum (FBS), 1× antibiotic-antimycotic, and 1×L-glutamine, in an incubator at 37° C. and 5% CO2. After the cells attached to the culture dish were washed with phosphate buffered saline (PBS), the cells were scraped off with a cell scraper and then centrifuged (4000 rpm, 3 min, 4° C.) to collect the cells in a 50 ml tube. The cell pellets were suspended in a lysis buffer (50 mM HEPES, pH 7.3, containing 1× the protease/phosphatase inhibitor cocktail), lysed by sonication, and then the lysate was centrifuged (13000 rpm, 10 min, 4° C.). The obtained supernatant was used for the quantitative analysis of proteins. The amount of proteins was measured using the BCA protein assay kit, using bovine serum albumin as a standard.
- Evaluation of a Human P2X7 Receptor Inhibitory Activity Stably expressing cell line (1321N1 cell transfected with the human P2X7 receptor gene (GenBank accession number NM_002502.5 including T606C and G952A SNP)) was used. The cells were seeded in a 384-well microtiter plate at a concentration of 8000 cells/well and cultured in the medium (10% fetal bovine serum, 25 mM HEPES, 1% penicillin and streptomycin in DMEM) for one day at 37° C. under 5% carbon dioxide atmosphere. After replacing with 20 μL of the HBSS buffer (20 mM HEPES, 55.6 mM D-glucose, 1×HBSS(−), pH7.4-7.5). 16 μL of 17.3 μM Yo-Pro solution in the HBSS buffer was added. The plate was placed in high-throughput cellular screening system FLIPR TETRA (Molecullar Devices, LLC.) and 15 μL of 130 μM BzATP solution in the HBSS buffer was added. Measurement, of fluorescence intensity by FLIPR TETRA was started. After eight minutes, 15 μL of DMSO solutions containing different concentrations of the compound of the present invention as prepared by dilution with the HBSS buffer were dispensed to each well through the built-in automatic dispenser, and the measurement of fluorescence intensity was continued for 20 minutes. The maximum fluorescence intensity without the compound of the present invention is calculated as 0% inhibition and the maximum fluorescence intensity when the reference compound was added is calculated as 100% inhibition. Changing values of fluorescence intensity by the compound of the present invention were calculated by difference between maximum and minimum fluorescence intensity for 20 minutes.
- FLIPR Calcium Assay One day before the assay, CORNING black with clear flat bottom 96-well assay plates were coated with a 0.1 mg/mL Poly-L-Lysine solution. CHO-K1/MOR/Gα15 cells were suspended in the F12 medium and plated at a density of 8×10⁴ cells/well in 200 μL medium. Cells were incubated in a humidified atmosphere of 10% CO2 at 37° C. overnight so as to reach an 80-90% confluent cell monolayer before assay. At the day of assay, 150 μL medium/well was removed from plate. To each well, 50 μL FLIPR calcium assay reagent dissolved in 1× assay buffer (HBSS: KCl 5 mM, KH2PO4 0.3 mM, NaCl 138 mM, NaHCO3 4 mM, Na2HPO4 0.3 mM, d-glucose 5.6 mM, with additional 20 mM HEPES and 13 mM CaCl2, pH 7.4), with 2.5 mM probenecid was added and the plate was incubated at 37° C. for 1 h. Compounds and other reagents were dissolved in the assay buffer. Using a FlexStationIII (Molecular Devices Corp.), the [Ca2+]i fluorescence increases after robotic injections of compounds or other reagents were monitored every 1.52 s interval with excitation wavelength at 485 nm and with emission wavelength at 525 nm. The [Ca2+]i fluorescence was measured up to 90 s after agonist injection. The fluorescence intensity from 6 to 12 wells of cells were averaged and the relative amount of [Ca2+]i release was determined by integrating the AUC of the [Ca2+]i fluorescence averages.
- Heat-based Assay Briefly, hTRPV1/CHO cells were cultured in growth media in a tissue culture dish at 37° C. in a CO2 incubator. On the day of the assay, culture media were removed and the cells were then detached using 0.05% trypsin at 37° C. with 5% CO2, for 90 s. The detached cells were centrifuged (1000 rpm, 4 min) to remove trypsin-containing supernatant and resuspended in assay buffer (115 mM NaCl, 5.4 mM KCl, 0.8 mM MgCl2.6H2O, 1.8 mM CaCl2.2H2O, 13.8 mM D-glucose, and 20 mM HEPES). Then, the cells were loaded with 5 uM Fluo-4, a Ca2+ reporter dye, in the presence of 2.5 mM probenecid at 37° C. with 5% CO2, for 45 min. Thereafter, the cells were washed twice with measuring buffer (assay buffer supplemented with 0.1% BSA and 3.2 mM CaCl2) then transferred to a Fast 96-well Reaction Plate (0.1 mL) (Part no. 4346907, MICROAMP, Applied Biosystems, Foster City, Calif.). The cell density was 100,000 cells/24 uL/well. A solution of the compound under test (6 uL/well) was added into each well of the 96-well plate. Thus, the reaction volume per well was 30 uL. The plates were then placed inside an ABI7500 Fast Real-Time PCR instrument (Applied Biosystems) to read fluorescence at different temperatures using 7500 software, version 2.0.2 (Applied Biosystems). The initial temperature was set at 25° C. for 1 min. followed by a temperature ramp to 45° C. in 100 s to deliver heat to cells.
- In Vitro Assay In vitro assays were performed in a recombinant cell line expressing cDNA encoding the alpha subunit (Nav1.7, SCN9a, PN1, NE) of human Nav1.7 (Accession No. NM_002977). The cell line was provided by investigators at Yale University (Cummins et al, J. Neurosci. 18(23): 9607-9619 (1998)). For dominant selection of the Nav1.7-expressing clones, the expression plasmid co-expressed the neomycin resistance gene. The cell line was constructed in the human embryonic kidney cell line, HEK293, under the influence of the CMV major late promoter, and stable clones were selected using limiting dilution cloning and antibiotic selection using the neomycin analogue, G418. Recombinant beta and gamma subunits were not introduced into this cell line. Additional cell lines expressing recombinant Nav1.7 cloned from other species can also be used, alone or in combination with various beta subunits, gamma subunits or chaperones.The assay buffer was formulated by removing 120 mL from a 1 L bottle of fresh, sterile dH2O (Mediatech, Herndon, Va.) and adding 100 mL of 10×HBSS that does not contain Ca++ or Mg++ (Gibco, Invitrogen, Grand Island, N.Y.) followed by 20 mL of 1.0 M Hepes, pH 7.3 (Fisher Scientific, BP299-100). The final buffer consisted of 20 mM Hepes, pH 7.3, 1.261 mM CaCl2, 0.493 mM MgCl2, 0.407 mM Mg(SO)4, 5.33 mM KCl, 0.441 mM KH2PO4, 137 mM NaCl, 0.336 mM Na2HPO4 and 0.556 mM D-glucose (Hanks et al., Proc. Soc. Exp. Biol. Med. 71:196 (1949)), and the simple formulation was typically the basic buffer throughout the assay (i.e., all wash and addition steps).
- Inhibition Assay Human HEK293 cells over-expressing human IK are grown in culture medium (DMEM supplemented with 10% foetal bovine serum), in polystyrene culture flasks (175 mm2) in a humidified atmosphere of 5% CO2 in air, at 37° C. Cell confluence should be 80-90% on day of plating. Cells are rinsed with 4 mL of PBS (phosphate buffered saline) and incubated 2 min with 1 mL of Trypsin-EDTA. After addition of 25 mL of culture medium cells are re-suspended by trituration with a 25 mL pipette.The cells are seeded at a density of 3×10⁶ cells/mL (25 μL/well) in black-walled, clear bottom, 384-well plates pre-treated with 0.01 g/L poly-D-lysin (20 μL/well for ≧30 min). Plated cells were allowed to proliferate for 24 h before loading with dye.BTC-AM (50 mg, Invitrogen) is added 25.5 μl DMSO. The BTC-AM stock solution (2 mM) is diluted to a final concentration of 2 μM in Cl+ free assay buffer (in mM: 140 Na+-gluconate, 2.5 K+-gluconate, 6 Ca2+-gluconate, 1 Mg2+ gluconate, 5 glucose, 10 HEPES, pH 7.3) containing 2 μM ouabain, 2 mM amaranth and 1 mM tartrazine.The culture medium is aspirated from the wells, and 25 μl of the BTC-AM loading solution are added to each well. The cells are incubated at 37° C. for 60 min.After the loading period, the Tl+-sensitive BTC fluorescence signal is measured over time using a FLIPR.
- Luciferase Assay Estrogen receptor-negative CV-1 kidney cells are maintained in Dulbecco's modified Eagle's medium with 4.5 g/L glucose supplemented with 10% fetal bovine serum and 100 units/ml penicillin-streptomycin at 37° C. in a humidified 5% CO2 atmosphere. The cells are then plated in 6-well dishes at a density of 2×10^5 cells per well in phenol-red free Dulbecco's modified Eagle's medium containing 10% charcoal-dextran-stripped fetal bovine serum. CV-1 cells are transfected using LipofectAMINE reagent according to the manufacturer's protocol. Transfections containing 1.5 μg of reporter plasmid (containing ERE-tk-luciferase containing a single ERE cloned upstream of the thymidine kinase promoter and luciferase gene) and 0.5 μg of either ERα or ERβ expression vector (containing CMV-ERα or CMV-ERβ full length coding sequence respectively). The next day, cells receive no treatment (controls) or are treated with estradiol alone (1 nM) or estradiol plus a compound of the invention (at varying concentrations). After 16-24 hours, cells are harvested and assayed for luciferase activity. At the outset, cell monolayers are washed twice with ice-cold phosphate-buffered saline and incubated for 15 minutes in 250 μl of 1× cell culture lysis reagent (Promega, Madison, Wis.). Cell extracts are transferred to a fresh tube and assayed using the luciferase assay system (Promega). For each assay, 10 μl of extract is diluted with 90 μl of 1× cell culture lysis reagent. Luminescence is read using an AutoLumat LB953 luminometer.
- Pore Permeation Assay Agonist-induced pore formation was determined by measuring cellular uptake of YO PRO fluorescence dye in HEK293 transfected with human P2X7 receptor. A HEK293 cell over expressing human P2X7 was harvested using HQTase reagent to detach the cells from T75 cm flask. The harvested cells are centrifuged @ 1200 rpm for 5 min at room temperature. The viability of cells was determined by Trypan blue dye and the cells are plated @ 10,000 cell/well in 50 ul volume in a 384W BD Poly lysine coated plate and incubated overnight at 37 C. After overnight incubation, the culture medium was replaced with 35 ul/well assay buffer (5 mM KCl, 0.1 mM CaCl2, 5 mM Glucose, 10 mM HEPES buffer pH7.4 containing 125 mM NaCl. The serial dilution of compounds was performed using Bravo liquid handling instrument and the compounds were added using Bravo to the cell assay plate starting at 2.5 uM with three dilutions for 10 points. The positive control inhibitor compound was added to column 23. The plate was shaken slowly on a plate shaker for 10 seconds. The cells were incubated with the compound for 20 minutes at room temperature. After the incubation period, YO PRO dye (1 uM) along with BzATP (10 uM) were added to cells at 10 ul/well. The plate was centrifuged at 1000 rpm for 5 seconds and incubated at room temperature for 30 minutes. The uptake of YO PRO dye into the cells was measured using Envision Fluorescence plate reader instrument (Perkin Elmer).
- Pore Permeation Assay Agonist-induced pore formation was determined by measuring cellular uptake of YO PRO fluorescence dye in HEK293 transfected with human P2X7 receptor. A HEK293 cell over expressing human P2X7 was harvested using HQTase reagent to detach the cells from T75 cm flask. The harvested cells are centrifuged @1200 rpm for 5 min at room temperature. The viability of cells was determined by Trypan blue dye and the cells are plated @10,000 cell/well in 50 ul volume in a 384W BD Poly lysine coated plate and incubated overnight at 37 C. After overnight incubation, the culture medium was replaced with 35 ul/well assay buffer (5 mM KCl, 0.1 mM CaCl2, 5 mM Glucose, 10 mM HEPES buffer pH7.4 containing 125 mM NaCl. The serial dilution of compounds was performed using Bravo liquid handling instrument and the compounds were added using Bravo to the cell assay plate starting at 2.5 uM with three dilutions for 10 points. The positive control inhibitor compound was added to column 23. The plate was shaken slowly on a plate shaker for 10 seconds. The cells were incubated with the compound for 20 minutes at room temperature. After the incubation period, YO PRO dye (1 uM) along with BzATP (10 uM) were added to cells at 10 ul/well. The plate was centrifuged at 1000 rpm for 5 seconds and incubated at room temperature for 30 minutes. The uptake of YO PRO dye into the cells was measured using Envision Fluorescence plate reader instrument (Perkin Elmer).
- Protective Effects of Compounds on Primary Cerebellum Granule Cells of Rats Isolated primary cerebellum granule cells of infant rats were inoculated in 96-well plates with 1.2×10⁵/well by using 10% FBS+25 mM KCl+2 mM Glutamine+1% of double-antibody BME medium. After 24 hours, cytarabine with a final concentration of 10 iM was added to inhibit the proliferation of neurogliocyte cells. After the day 4, glucose with the final concentration of 5 mM was added every four days to complement energy metabolism and water evaporation of cells. The materials were placed in a cell incubator (37° C., 5% CO2) to be cultured for 10 days. A 200 iM of glutamate was used to induce the excitotoxic injury of the primary cerebellum granule cells, with test groups of normal control group, glutamate group, pretreatment groups with different memantine nitrate compounds, and pretreatment control group with memantine. In the testing groups, the compounds of NM-001, NM-002, NM-003, NM-004, NM-005, NM-008, NM-009, NM-011, NM-012 and memantine were respectively added. After pre-protection for 2 h, 200 iM of glutamate was added to induce cell damage for 24 h, and then MTT was added to culture for 4 h. The supernatant fraction was sucked, and 150 iL of DMSO was added to each well for dissolving. After blending with shaking, the light absorption values under 570 nm wavelength was measured with a microplate reader, and the viability of cells was calculated. Cell viability (%)=absorbance of different groups/absorbance of the normal control group×100%.
- Time Resolved Fluorescence Resonance Energy Transfer (TR-FRET)-Based cAMP Immunoassay Mouse R1.G1 cells (ATCC, Manassas, Va.) were grown in suspension in high glucose-DMEM (Dulbecco's Modified Eagle's Medium, Cellgro, Herndon, Va.) containing 10% horse serum and 2% glutaMax (Invitrogen, Carlsbad. Calif.) without added antibiotics. On the day of the experiment, cells were spun at 1,000 rpm for 5 minutes at room temperature and then washed once with HBSS (HEPES Buffered Saline Solution, Invitrogen, Carlsbad, Calif.). Cells were then spun again and resuspended in stimulation buffer (HBSS with 0.05% FAF-BSA (Fatty acid-free bovine serum albumin, Roche Applied Science, Indianapolis, Ind.), 5 mM HEPES) to 2 million cells per ml. Antibody supplied with the LANCE™ cAMP immunoassay kit was then added to the cells according to the manufacturer's instructions, and 12,000 cells per well were then added to the wells containing forskolin to a predetermined fixed final concentration (typically about 2.5 μM) and the previously determined amount of the synthetic peptide amide to be tested. The synthetic peptide amides were tested in a range of concentrations to determine potency. Cells were incubated with the synthetic peptide amide plus forskolin for about 20 minutes at room temperature. After incubation, cells are lysed by adding 12 μl of detection mix as supplied with the LANCE™ kit, followed by incubation for one hour at room temperature. Time resolved fluorescence was read using a 330-380 nm excitation filter, a 665 nm emission filter, dichroic mirror 380, and Z=1 mm.
- hERG Analysis-Method 2 The hERG potassium current was measured in a hERG-stably-expressing Chinese hamster ovary K1 (CHO) cells. The experiments were performed using an automated planar patch-clamp system QPATCH HT (Sophion Bioscience A/S). The application of pressure for forming gigaseals and whole-cell patch clamp configuration were established using the QPATCH assay software. Patch-clamp experiments were performed in voltage-clamp mode and whole-cell currents were recorded from individual cells. The following stimulation protocol was applied to investigate the effects of compounds on hERG potassium channel. The membrane potential was held at −80 mV and repetitively (every 15 s) depolarized to +20 mV for 5 s after the pulse to −50 mV for 20 ms served to define the baseline, followed by repolarizing step to −50 mV for 5 s to evaluate of the tail current amplitude. Experiments were conducted at room temperature (22±2° C.).Effects of compounds were determined from cumulative applications of increasing 4 concentrations and calculated as percent of blocked current. The data points were fitted with Hill equation to calculate half-maximal inhibition concentrations. The test solution includes:Extracellular solution (mM): 2 mM of CaCl2, 1 mM of MgCl2, 10 mM of HEPES, 4 mM of KCl, 145 mM of NaCl, and 10 mM of Glucose; andIntracellular solution (mM): 5.4 mM of CaCl2, 1.8 mM of MgCl2, 10 mM of HEPES, 31 mM of KOH, 10 mM of EGTA, 120 mM of KCl, and 4 mM of ATP.
- Biological Assays For measuring Npt2a activity in a cell based assay, a stable CHO cell line with inducible Npt2a expression was generated. Therefore, CHO T-Rex cells (life technologies cat. R718-07) were stably transfected with doxycycline-inducible human NPT2a (pcDNA5TO-hNpt2a). The obtained CHO T-REx hNpt2a cells were routinely cultured in Dulbecco's MEM/F12 (4.5 g/l Glucose, Gibco cat. 21331-020; 500 mL) supplemented with 10 ml Glutamax 100×, Sodium pyruvate (7 mL of 100 mM solution), HEPES (10 mL of 1 M solution), Sodium bicarbonate (10 mL of 7.5% solution), 10% Fetal Bovine Serum Tetracycline free (Clontech cat. 631106, 500 ml), Penicillin-Streptomycin (5 mL of 100× Solution), Blasticidin 10 μg/mL and 400 μg/mL Hygromycin.Activity of Npt2a was detected by following depolarization of cellular membrane potential by influx of sodium phosphate using fluorescent membrane potential dye kit BLUE (Molecular devices cat. R8034). For Npt2a activity measurements, CHO T-Rex hNpt2a cells were seeded into 1536 well microtiter plates (GREINER Bio-One cat. 782092) with 750 cells/well in 7 μL/w of complete medium (2% Tetracycline-free FBS, 2% Poly-D-Lysine) without selective agents+Doxycycline 0.5 μg/mL to induce Npt2a gene expression, and grown for 24 h at 37° C., 5% carbon dioxide.On the day of experiment a 1×MPdye Loading Solution was freshly prepared by re-suspending 15 mg of Blue MPdye powder in 10 mL of NHE buffer sodium-free (140 mM N-Methyl-D-glucamine, 5.4 mM KCl, 1 mM CaCl2, 11 mM D(±)-Glucose water free, 1.2 mM MgCl2, 10 mM HEPES; pH 7.4 (adjusted with hydrochloric acid); sterile filtered). 5 μl medium was removed from plates by robotic manipulation, then 5 μL/well of sodium-free NHE buffer was added. After incubation for 2 min, this washing step was repeated once. Then, 5 μL/w of buffer was removed from plates and cells were incubated for 5 min at room temperature with 5 μL/w of MPdye Loading Solution (1× in Sodium-free NHE Buffer). Test compounds were added to the cells at final test concentrations between 50 μM and 1 nM (0.6 μL/well, final DMSO 0.6%, prepared in MPDye Loading Solution) and incubated for 5 min at room temperature.Plates were analyzed with an in house CCD camera device using a λexc 510-545 nm/λem 565-625 nm filter. Fluorescence was detected for 15 sec (background measurement M1). Activity of Npt2a was triggered by addition of 2 μL/well of 30 mM Na+ and 1 mM phosphate (prepared in a mixture of NHE Buffer Na+ free and NHE Buffer 140 mM Na+). Fluorescence was followed for 2-3 min (depolarization measurement M2). Data was normalized to cell number and dye loading efficiency by calculating M2/M1. This quotient was plotted against test compound concentration. Graph Pad Prism or equivalent in house software was used to create sigmoidal dose-response curves (variable slope) and determine IC50 values.
- Drug-Drug Interaction (DDI) Assay The assay was set up and executed using a Biomek FXp robotic liquid handling workstation (Beckman Coulter Corp., Fullerton, Calif.), integrated with a Cytomat shaking incubator set at 37° C. (Thermo Electron Corp., Bellefonte, Pa.). A batch of human liver microsomes from 50 donors, pooled and characterized by BD Gentest, (Cat #457111, lot 01220, 20 mg/mL in 250 mM sucrose) was used. Each substrate was incubated at a protein concentration of 0.1, 0.15 or 0.2 mg/mL in a total incubation volume of 0.16 mL. The incubates were prepared in 100 mM potassium phosphate buffer (pH 7.4) supplemented with 5 mM magnesium chloride and 1 mM EDTA. Quinidine was used as a positive control inhibitor for CYP2D6. Quinidine was prepared as a working solution in organic solvent (primarily methanol, with DMSO and acetonitrile as secondary solvents) and was spiked into the microsomal suspension to yield the desired concentration level. The solution was then serially diluted with additional microsomal suspension to yield eight concentration levels. Final organic content was less than 0.07%. A stock solution of the test compound was prepared at a concentration of 50 mM or higher, if possible, in an adequate organic solvent (DMSO, methanol or acetonitrile), depending on solubility limitations. The stock solution was serially diluted with methanol and subsequently spiked into the microsomal suspension to yield final incubation concentrations of 0, 0.1, 0.3, 1, 3, 10, 30 and 100 μM for Comparator Compound and 0, 0.06, 0.18, 0.6, 1.8, 6, 18 and 60 μM for 4-(2,2-difluoro-benzo[1,3]dioxol-5-ylmethyl)-piperazine-1-carboxylic acid (4-chloro-pyridin-3-yl)-amide. The final organic content was 0.2%. Incubations were performed in triplicate for each probe substrate. The control inhibitor (quinidine) and marker substrate (dextromethorphan or bufuralol) were transferred to the incubation vessels (60 μL aliquots each). After a pre-incubation period at 37° C., the reactions were initiated by the addition of a 40 μL aliquot of NADPH regenerating system (BD Gentest). A 40 μL aliquot (diluted 6:19 with incubation buffer) provided final concentrations of 1.3 mM NADP+, 3.3 mM glucose-6-phosphate and 0.4 U/mL glucose-6-phosphate dehydrogenase. Incubation times were 12 minutes for both dextromethorphan and bufuralol. Reactions were terminated by the direct addition of acetonitrile (160 μL) to the incubation mix followed by transfer to a pooling plate containing additional acetonitrile (400 μL). The incubation reactions were pooled by equal test compound or control inhibitor concentration, transferred to a Phenomenex Strata Impact protein precipitation filter plate containing acetonitrile and internal standards (100 μL of a mixture of the following deuterated compounds ranging in concentration from 0.5 to 2.8 μM: hydroxybufuralol-d9, dextrorphan-d3). The resulting filtrate was evaporated to dryness under a nitrogen flow, then reconstituted in 250 μL mobile phase (1:1 methanol:water, containing 0.1% acetic acid). Samples and standards were analyzed on a Sciex API4000 triple quadrupole mass spectrometer. The data were acquired in Analyst 1.4.1 (Applied Biosystems/MDS Sciex).
- 3H-Amino Acid Uptake Assays Live-cell amino acid uptake assays using HEK293 cells were carried out in 96-well plates (CulturPlate-96, Perkin Elmer). 96-well plates were coated with poly-D-lysine prior to the assay. Cells were plated at a density of 35,000 cells per well 24 h prior to carrying out the assay. Each set of conditions was replicated at least three times, technically and biologically. Cells were washed three times with 100 μL of assay buffer (containing 137 mM NaCl, 5.1 mM KCl, 0.77 mM KH2PO4, 0.71 mM MgSO4.7H2O, 1.1 mM CaCl2, 10 mM D-glucose, and 10 mM HEPES) to remove cell media. 3H-amino acid (500 nM) in the same buffer was added concomitantly with V-9302 and allowed to incubate for 15 min at 37° C. For ASCT2-mediated 3H-glutamine uptake assays, 5 mM of the system-L inhibitor 2-amino-2-norbornanecarboxylic acid (BCH) was added and the assay buffer was adjusted to pH 6.0. For selectivity studies, no BCH was added and the assay was conducted at pH 7.4. Following the incubation period, the 3H-glutamine/inhibitor was removed and the cells were washed three times with assay buffer. The cells were then lysed by the addition of 50 μL of 1 M NaOH. For reading, 150 μL of scintillation fluid (Microscint 40, Perkin Elmer) was added and the plates were counted on a scintillation counter (Topcount, Perkin Elmer). Fifty percent inhibitory concentrations (IC50) were calculated using GraphPad Prism version 6 for Mac OS X, GraphPad Software, San Diego Calif. USA, www.graphpad.com.
- 5-HT2B Agonist Activity Assay Evaluation of the agonist activity of compounds (I), (Ia), (Ib), (Ic), (Ia-iab), compound (2), compound (9), compound (15), compound (27), A2, A3, and A7 at the human 5-HT2B receptor was performed by Eurofins/Cerep (France) measuring the compound effects on inositol monophosphate (IP1) production using the HTRF detection method. Briefly, the human 5-HT2B receptor was expressed in transfected CHO cells. The cells were suspended in a buffer containing 10 mM Hepes/NaOH (pH 7.4), 4.2 mM KCl, 146 mM NaCl, 1 mM CaCl2, 0.5 mM MgCl2, 5.5 mM glucose and 50 mM LiCl, then distributed in microplates at a density of 4100 cells/well and incubated for 30 minutes at 37° C. in the presence of buffer (basal control), test compound or reference agonist. For stimulated control measurement, separate assay wells contained 1 μM 5-HT. Following incubation, the cells were lysed and the fluorescence acceptor (fluorophen D2-labeled IP1) and fluorescence donor (anti-IP1 antibody labeled with europium cryptate) were added. After 60 minutes at room temperature, the fluorescence transfer was measured at lambda(Ex) 337 nm and lambda(Em) 620 and 665 nm using a microplate reader (Rubystar, BMG). The IP1 concentration was determined by dividing the signal measured at 665 nm by that measured at 620 nm (ratio). The results were expressed as a percent of the control response to 1 μM 5-HT. The standard reference agonist was 5-HT, which was tested in each experiment at several concentrations to generate a concentration-response curve from which its EC50 value is calculated as described above for dopamine functional assays.
- A.1 Inhibition of cAMP Activity of GPR6 In Vitro Assay This cell based assay measures the ability of compounds to inhibit the constitutive cAMP activity of GPR6 receptor expressed in CHO-K1 cells. CHO cells were stably expressed with GPR6 receptor, whose expression is controlled by a tetracycline inducible element. The cells were cultured in medium containing F12K, 10% FBS, 1% Penn/Strep, 200 ug/mL Hygromycin. GPR6 receptor expression was induced for 20 hrs with 10 g/ml doxycycline (sigma D9891) in growth media. After addition of doxycycline cells were plated at a density of 250-500 cells per well in half-volume black clear bottom plates (Costar) and place in an incubator (37°, 5% C(O)2) for 20 hours prior to cAMP assays.Culture media was removed from cells and they were washed with 50 L of Ringer's Buffer (MgCl2 0.047 mg/mL, NaH2PO4 0.18 mg/mL, Na2HPO4 0.1 mg/mL, KCl 0.34 mg/mL, NaHC(O)3 1.26 mg/mL, D-glucose 1.8 mg/mL, NaCl 7 mg/mL; pH=7.4). Compounds suspended in DMSO were diluted in Ringer's Buffer containing 0.5% fatty acid free BSA and incubated on cells for 45 min at 37° and 5% C(O)2. After incubation cells were incubated for 10 min at room temp with Eu-cAMP tracer solution from a Perkin Elmer Lance HTRF UltracAMP assay kit (TRF0264). Then ULight -anti-cAMP solution from the Lance HTRF kit was added and incubated on a shaker at room temp for 1 hour prior to HTRF detection in a BMG PolarStar Omega.IC50 curves were generated with a four-parameter logistic equation using GraphPad Prism 5.03.
- Biological Assay A monoclonal HEK-293 cell line stably transfected with a cDNA encoding for the human mGlu4 receptor was generated; for the work with mGlu4 Positive Allosteric Modulators (PAMs), a cell line with low receptor expression levels and low constitutive receptor activity was selected to allow the differentiation of agonistic versus PAM activity. Cells were cultured according to standard protocols (Freshney, 2000) in Dulbecco's Modified Eagle Medium with high glucose supplemented with 1 mM glutamine, 10% (vol/vol) heat-inactivated bovine calf serum, Penicillin/Streptomycin, 50 μg/ml hygromycin and 15 μg/ml blasticidin (all cell culture reagents and antibiotics from Invitrogen, Basel, Switzerland).About 24 hrs before an experiment, 5×10⁴ cells/well were seeded in poly-D-lysine coated, black/clear-bottomed 96-well plates. The cells were loaded with 2.5 μM Fluo-4AM in loading buffer (1×HBSS, 20 mM HEPES) for 1 hr at 37° C. and washed five times with loading buffer. The cells were transferred into a Functional Drug Screening System 7000 (Hamamatsu, Paris, France), and 11 half logarithmic serial dilutions of test compound at 37° C. were added and the cells were incubated for 10-30 min. with on-line recording of fluorescence. Following this pre-incubation step, the agonist (2S)-2-amino-4-phosphonobutanoic acid (L-AP4) was added to the cells at a concentration corresponding to EC20 with on-line recording of fluorescence; in order to account for day-to-day variations in the responsiveness of cells, the EC20 of L-AP4 was determined immediately ahead of each experiment by recording of a full dose-response curve of L-AP4.
- Biological Assays Calcium Flux Assay Cell expressing the GRIA1o-CACNG8 fusion construct were grown in a monolayer in 96- or 384-well microtiter plates. They were washed with assay buffer (135 mM NaCl, 4 mM KCl, 3 mM CaCl2, 1 mM MgCl2, 5 mM glucose, 10 mM HEPES, pH 7.4, 300 mOs) using a Biotek EL405 plate washer. The cells were then loaded with a calcium-sensitive dye (Calcium-5 or Calcium-6, Molecular Devices) and the test compounds at a range of concentrations. Calcium flux following the addition of 15 μM glutamate was monitored using a Molecular Devices FLIPR Tetra. The fluorescence in each well was normalized to the fluorescence of negative and positive control wells. The negative control wells had no added compounds, and the positive control wells had been incubated with 10 μM CP465022 (a non-subtype-selective AMPA receptor antagonist) (Lazzaro et al. (2002). Functional characterization of CP-465,022, a selective, noncompetitive AMPA receptor antagonist. Neuropharmacology 42(2): 143-153). The responses to glutamate as functions of the test compound concentrations were fitted to a four-parameter logistic function. The fitted parameter corresponding to the midpoint was taken to be the potency of inhibition of the compound. The data in Table 3 below illustrates the observed potentcy for the compounds described herein. pIC50 refers to the negative log of the IC50 in molar. Using a similar protocol, compounds were also tested for their ability to inhibit TARP γ2 dependent AMPA receptor activity. The compounds that were tested for TARP γ2 AMPA receptor activity had pIC50 values less than 6.
- Ca2+ Mobilization In Vitro Assay A monoclonal HEK-293 cell line stably transfected with a cDNA encoding for the human mGlu4 receptor was generated; for the work with mGlu4 Positive Allosteric Modulators (PAMs), a cell line with low receptor expression levels and low constitutive receptor activity was selected to allow the differentiation of agonistic versus PAM activity. Cells were cultured according to standard protocols (Freshney, 2000) in Dulbecco's Modified Eagle Medium with high glucose supplemented with 1 mM glutamine, 10% (vol/vol) heat-inactivated bovine calf serum, Penicillin/Streptomycin, 50 μg/ml hygromycin and 15 μg/ml blasticidin (all cell culture reagents and antibiotics from Invitrogen, Basel, Switzerland).About 24 hrs before an experiment, 5×10⁴ cells/well were seeded in poly-D-lysine coated, black/clear-bottomed 96-well plates. The cells were loaded with 2.5 μM Fluo-4AM in loading buffer (1×HBSS, 20 mM HEPES) for 1 hr at 37° C. and washed five times with loading buffer. The cells were transferred into a Functional Drug Screening System 7000 (Hamamatsu, Paris, France), and 11 half logarithmic serial dilutions of test compound at 37° C. were added and the cells were incubated for 10-30 min. with on-line recording of fluorescence. Following this pre-incubation step, the agonist (2S)-2-amino-4-phosphonobutanoic acid (L-AP4) was added to the cells at a concentration corresponding to EC20 with on-line recording of fluorescence; in order to account for day-to-day variations in the responsiveness of cells, the EC20 of L-AP4 was determined immediately ahead of each experiment by recording of a full dose-response curve of L-AP4.
- Electrophysiological Assay (EP) (In Vitro Assay) The following voltage clamp electrophysiology studies are performed on representative compounds using cells heterologously expressing Nav1.7 or Nav1.5 channels. cDNAsfor Nav1.7 (NM_002977) and Nav1.5 (AC137587) are stably expressed in Chinese Hamstr Ovary (CHO) cells and CHL (Chinese Hamster Lung) cells respectively. Sodium currents are measured in the whole-cell configuration using Syncropatch 384PE (Nanlon Technologies, Germany). 1NPC -384 chips with custom medium resistance and single hole mode are used. Internal solution consists of (in mM): 110 CsCl, 10 CsCl, 20 EGTA, and 10 Hepes (pH adjusted to 7.2); and external solution contains (in mM): 60 NMDG, 80 NaCl, 4 KCl, 1 MgCl2, 2 CaCl2), 2 D-Glucose monohydrate, 10 Hepes (pH adjusted to 7.4 with NaOH). After system flushing, testing compounds are dissolved in external solution containing 0.1% Pluronic F-127. The chip is moved into the measuring head and the instrument primes the chip with external and internal solutions. 10 ul cells are added to the chip from a cell hotel, and a negative pressure of +-50 mBar is applied to form a seal. Following treatment with seal enhancer solution and wash-off with external solution, negative pressure of +-250 mbar is applied for 1 second to achieve the whole-cell configuration, followed by three washing steps in external solution. 20 ul of compounds is added to 40 ul in each well (1:3 dilution of compounds), and after mixing, 20 ul is removed so the volume is retained at 40 ul. After approximately 13 minutes recordings, 20 ul/well of 2 uM TTX, or 333 uM Tetracaine (for Nav1.5) is added to achieve full block.
- Evaluation of Activating Activity for OX1R and OX2R Human Embryonic Kidney cells 293 (HEK293) cells with forced expression of hOX1R or hOX2R were seeded in a 384-well microplate (Greiner) at 10,000 per well and cultured for 1 day in high-glucose-DMEM (FujiFilm Corp. Wako Pure Chemical Industries, Ltd.) containing added 10% FBS (Thermo Scientific) and 1% Penicillin-Streptomycin (FujiFilm Corp. Wako Pure Chemical Industries, Ltd.). After removing the medium, 30 μL of assay buffer (20 mM HEPES (Sigma-Aldrich Japan, KK.), Hank's balanced salt solution (Gibco), 0.1% BSA (Sigma-Aldrich Japan, KK.), 0.1% Pluronic F-127 (Invitrogen)) containing Calcium 4 dye (Molecular Device Corporation) and 2.5 mM probenecid (Sigma-Aldrich Japan, KK.) were added, and the mixture was incubated for 60 minutes. A 30 μL portion of assay buffer containing the test compound was added and reaction was initiated. Change in intracellular calcium ion concentration by the reaction was measured based on the fluorescence intensity ratio in terms of the fluorescence value with dual wavelength excitation at 480 nm and 540 nm, using FDSS7000 (Hamamatsu Photonics, K.K.). The test compound was dissolved in DMSO to 10 mM, and diluted with assay buffer to a final concentration of from 3×10⁻¹¹ M to 1×10⁻⁵ M (DMSO final concentration of 0.1%). The EC50 value was determined from the fluorescence value with addition of the test compound at different concentrations, with the fluorescence value of the well with compound-free buffer added as 0%, and the fluorescence value of the well with 30 nM OX-A (Peptide Research Lab) as 100%.
- Evaluation of a Human P2X7 Receptor Inhibitory Activity Stably expressing cell line (1321N1 cell transfected with the human P2X7 receptor gene (GenBank accession number NM_002562.5 including T606C and G952A SNP)) was used. The cells were seeded in a 384-well microtiter plate at a concentration of 8000 cells/well and cultured in the medium (10% fetal bovine serum, 25 mM HEPES, 1% penicillin and streptomycin in DMEM) for one day at 37° C. under 5% carbon dioxide atmosphere. After replacing with 20 μL of the HBSS buffer (20 mM HEPES, 55.6 mM D-glucose, 1×HBSS(−), pH7.4-7.5), 15 μL of 17.3 μM Yo-Pro solution in the HBSS buffer was added. The plate was placed in high-throughput cellular screening system FLIPR TETRA (Molecullar Devices, LLC.) and 15 μL of 130 μM BzATP solution in the HBSS buffer was added. Measurement of fluorescence intensity by FLIPR TETRA was started. After eight minutes, 15 μL of DMSO solutions containing different concentrations of the compound of the present invention as prepared by dilution with the HBSS buffer were dispensed to each well through the built-in automatic dispenser, and the measurement of fluorescence intensity was continued for 20 minutes. The maximum fluorescence intensity without the compound of the present invention is calculated as 0% inhibition and the maximum fluorescence intensity when the reference compound was added is calculated as 100% inhibition. Changing values of fluorescence intensity by the compound of the present invention were calculated by difference between maximum and minimum fluorescence intensity for 20 minutes. IC50 was calculated using logistic approximation.
- Functional Assay HEK293 cells were transfected with human TRPV1 cloned in pcDNA3.1zeo(+) using the Effectene non-liposomal lipid based transfection kit (Qiagen) (hTRPV1/HEK293). hTRPV1/HEK293 cells were routinely grown as monolayers under selection in zeocin (200 μg/mL; Invitrogen) in Dulbecco's Modified Eagle Medium (DMEM, Gibco BRL) supplemented with 10% fetal bovine serum, and penicillin/streptomycin (50 units/mL) in 5% CO2 at 37° C. Cells were passaged frequently, every 3-5 days, to avoid overgrowth, depletion of essential medium components, or acidic medium exposure. Cells were passaged using a brief wash in 0.05% trypsin with 1 mM EDTA, followed by dissociation in divalent-free phosphate-buffered saline (Hyclone #SH30028.02). Dissociated cells were seeded onto poly-D-lysine coated black-walled 96-well plates (Biocoat; Becton Dickinson #354640) at about 40,000 cells per well and grown for approximately 1 day in culture medium to near confluency. The assay buffer was composed of 130 mM NaCl, 2 mM KCl, 2 mM MgCl2, 10 mM HEPES, 5 mM glucose, and either 2 mM or 20 μM CaCl2. On the day of the experiment, the culture medium was replaced with 2 mM calcium assay buffer using an automated plate washer (ELx405; Biotek, VT). The cells were incubated in 100 μL/well Fluo-3/AM (2 μM; TEFLabs #0116) with Pluronic F127 (100 μg/mL; Sigma #P2443) for 1 h at rt in the dark. After loading the cells, the dye solution was replaced with 50 μL/well of 20 μM calcium assay buffer using the ELx405 plate washer.
- Gal4-luciferase reporter assay Briefly, the AR LBD is expressed as a fusion with the Gal4 transcription factor, which binds to the Gal4 reporter DNA. Upon activation with agonist hormone (DHT), the Gal-AR LBD binds to the Gal4 reporter gene, which in turn drives the transcription (and subsequently translation) of the reporter luciferase. The effect of antiandrogens (competitive antagonists) on this process is measured by quantifying the amount of luciferase activity after 24 hours in the presence of varying concentrations of antiandrogens. From these values, an IC50 for each antagonist is calculated. Experimentally, Hela cells were maintained in Dulbecco's modified Eagle's medium H-21 4.5 g/L glucose, containing 10% steroid depleted fetal bovine serum, 50 units/mL penicillin. For transfection, (1×10⁵) cells per well were plated and incubated overnight. A mixture of typically 200 ng of Gal4 responsive luciferase reporter plasmid, 10 ng of β-actin-β-galactosidase internal control, 10 ng of GAL-AR LBD or empty vector control, and 10-100 ng of β-catenin or empty vector control were mixed with 0.5 μL of transfection reagent from BioRad and incubated for 20 min and then plated in 24 well plate triplicates. Cells were induced with 1 nM DHT and 0.1 nM-30 uM test compounds after 3 hr and then incubated over night. Cells were collected, and pellets were lysed in 100 μL of 100 mM Tris-HCl (pH 7.5) containing 0.1% Triton X-100. Luciferase and β-galactosidase activities were measured using the Luciferase Assay System (Promega) and Galacto-Light Plus-galactosidase reporter gene assay system (Applied Biosystems), according to the manufacturer's instructions.
- HEK293-hTLR-7 assay HEK293-Blue-hTLR7 cells were incubated at a density of 250,000-450,000 cells/mL in a volume of 180 μL in a 96-well plate in Dulbecco's Modified Eagle's medium (DMEM) containing 4.5 g/l glucose, 50 U/ml penicillin, 50 mg/ml streptomycin, 100 mg/ml Normocin, 2 mM L-glutamine, 10% (v/v) heat-inactivated fetal bovine serum for 24 h. Then the HEK293-Blue-hTLR-7 cells were incubated with addition of 20 μL test compound in a serial dilution in the presence of final DMSO at 1% and perform incubation under 37° C. in a CO2 incubator for 20 hours. Then 20 μL of the supernatant from each well was incubated with 180 μL Quanti-blue substrate solution at 37° C. for 1-3 hours and the absorbance was read at 620-655 nm using a spectrophotometer. The signalling pathway that TLR7 activation leads to downstream NF-κB activation has been widely accepted, and therefore similar reporter assay was also widely used for evaluating TLR7 agonist (Tsuneyasu Kaisho and Takashi Tanaka, Trends in Immunology, Volume 29, Issue 7, July 2008, Pages 329.sci; Hiroaki Hemmi et al, Nature Immunology 3, 196-200 (2002).The compounds of the present invention were tested in the above assay for their TLR7 agonism activity as described herein and results are listed in Table 1. The Examples were found to have EC50 of about 3 μM to about 500 μM. Particular compounds of formula (I) or (Ia) were found to have EC50 of about 3 μM to about 200 μM.
- Inhibition of cAMP Activity of GPR6 In Vitro Assay This cell based assay measures the ability of compounds to inhibit the constitutive cAMP activity of GPR6 receptor expressed in CHO-K1 cells. CHO cells were stably expressed with GPR6 receptor, whose expression is controlled by a tetracycline inducable element. The cells were cultured in medium containing F12K, 10% FBS, 1% Penn/Strep, 200 ug/mL Hygromycin. GPR6 receptor expression was induced for 20 hrs with 2 □g/ml doxycycline (sigma D9891) in growth media. After addition of doxycycline cells were plated at a density of 450-750 cells per well in 96-well half-volume black tissue culture plates (Costar) and placed in an incubator (37°, 5% CO2) for 20 hours prior to cAMP assays.Culture media was removed from cells and they were washed with 50 □L/well of Ringer's Buffer (MgCl2 0.047 mg/mL, NaH2PO4 0.18 mg/mL, Na2HPO4 0.1 mg/mL, KCl 0.34 mg/mL, NaHCO3 1.26 mg/mL, D-glucose 1.8 mg/mL, NaCl 7 mg/mL; pH=7.4). Compounds suspended in DMSO were diluted in Ringer's Buffer containing 0.5% fatty acid free BSA plus 300 μM IBMX and incubated on cells for 45 min at 37° and 5% CO2. After incubation cells were incubated for 10 min at room temp with Eu-cAMP tracer solution from a Perkin Elmer Lance HTRF Ultra cAMP assay kit (TRF0263). Then ULight -anti-cAMP solution from the Lance HTRF kit was added and incubated on a shaker at room temp for 1 hour prior to HTRF detection in a Perkin Elmer Envision plate reader.
- Intracellular Ca2+ Mobilization Assay A monoclonal HEK-293 cell line stably transfected with a cDNA encoding for the human mGlu5a receptor was generated; for the work with mGlu5 Positive Allosteric Modulators (PAMs), a cell line with low receptor expression levels and low constitutive receptor activity was selected to allow the differentiation of agonistic versus PAM activity. Cells were cultured according to standard protocols (Freshney, 2000) in Dulbecco's Modified Eagle Medium with high glucose supplemented with 1 mM glutamine, 10% (vol/vol) heat-inactivated bovine calf serum, Penicillin/Streptomycin, 50 μg/ml hygromycin and 15 μg/ml blasticidin (all cell culture reagents and antibiotics from Invitrogen, Basel, Switzerland). About 24 hrs before an experiment, 5×10⁴ cells/well were seeded in poly-D-lysine coated, black/clear-bottomed 96-well plates. The cells were loaded with 2.5 μM Fluo-4AM in loading buffer (1×HBSS, 20 mM HEPES) for 1 hr at 37 °C. and washed five times with loading buffer. The cells were transferred into a Functional Drug Screening System 7000 (Hamamatsu, Paris, France), and 11 half logarithmic serial dilutions of test compound at 37 °C. were added and the cells were incubated for 10-30 min. with on-line recording of fluorescence. Following this pre-incubation step, the agonist L-glutamate was added to the cells at a concentration corresponding to EC20 (typically around 80 μM) with on-line recording of fluorescence; in order to account for day-to-day variations in the responsiveness of cells, the EC20 of glutamate was determined immediately ahead of each experiment by recording of a full dose-response curve of glutamate.
- Intracellular Ca2+ Mobilization Assay A monoclonal HEK-293 cell line stably transfected with a cDNA encoding for the human mGlu5a receptor was generated; for the work with mGlu5 Positive Allosteric Modulators (PAMs), a cell line with low receptor expression levels and low constitutive receptor activity was selected to allow the differentiation of agonistic versus PAM activity. Cells were cultured according to standard protocols (Freshney, 2000) in Dulbecco's Modified Eagle Medium with high glucose supplemented with 1 mM glutamine, 10% (vol/vol) heat-inactivated bovine calf serum, Penicillin/Streptomycin, 50 μg/ml hygromycin and 15 μg/ml blasticidin (all cell culture reagents and antibiotics from Invitrogen, Basel, Switzerland). bout 24 hrs before an experiment, 5×10^4 cells/well were seeded in poly-D-lysine coated, black/clear-bottomed 96-well plates. The cells were loaded with 2.5 μM Fluo-4AM in loading buffer (1×HBSS, 20 mM HEPES) for 1 hr at 37° C. and washed five times with loading buffer. The cells were transferred into a Functional Drug Screening System 7000 (Hamamatsu, Paris, France), and 11 half logarithmic serial dilutions of test compound at 37° C. were added and the cells were incubated for 10-30 min. with on-line recording of fluorescence. Following this pre-incubation step, the agonist L-glutamate was added to the cells at a concentration corresponding to EC20 (typically around 80 M) with on-line recording of fluorescence; in order to account for day-to-day variations in the responsiveness of cells, the EC20 of glutamate was determined immediately ahead of each experiment by recording of a full dose-response curve of glutamate.
- Radioligand Binding Assay HEK-293 cells stably expressing mouse TAAR1 were maintained at 37° C. and 5% CO2 in DMEM high glucose medium, containing fetal calf serum (10%, heat inactivated for 30 min at 56° C.), penicillin/streptomycin (1%), and 375 μg/ml geneticin (Gibco). Cells were released from culture flasks using trypsin/EDTA, harvested, washed twice with ice-cold PBS (without Ca2+ and Mg2+), pelleted at 1,000 rpm for 5 min at 4° C., frozen and stored at −80° C. Frozen pellets were suspended in 20 ml HEPES-NaOH (20 mM, pH 7.4) containing 10 mM EDTA and homogenized with a Polytron (PT 6000, Kinematica) at 14′000 rpm for 20 s. The homogenate was centrifuged at 48,000×g for 30 min at 4° C. Subsequently, the supernatant was removed and discarded, and the pellet resuspended in 20 ml HEPES-NaOH (20 mM, pH 7.4) containing 0.1 mM EDTA using the Polytron (20 s at 14′000 rpm). This procedure was repeated and the final pellet resuspended in HEPES-NaOH containing 0.1 mM EDTA and homogenized using the Polytron. Typically, aliquots of 2 ml membrane portions were stored at −80° C. With each new membrane batch the dissociation constant (Kd) was determined via a saturation curve. The TAAR1 radioligand 3[H] (S)-4-[(ethyl-phenyl-amino)-methyl]-4,5-dihydro-oxazol-2-ylamine (described in WO 2008/098857) was used at a concentration equal to the calculated Kd value, that was usually around 0.7 nM, resulting in the binding of approximately 0.5% of the radioligand and a specific binding representing approximately 70% of the total binding.
- Radioligand Binding Assay HEK-293 cells stably expressing rat TAAR1 were maintained at 37° C. and 5% CO2 in DMEM high glucose medium, containing fetal calf serum (10%, heat inactivated for 30 min at 56° C.), penicillin/streptomycin (1%), and 375 μg/ml geneticin (Gibco). Cells were released from culture flasks using trypsin/EDTA, harvested, washed twice with ice-cold PBS (without Ca2+ and Mg2+), pelleted at 1′000 rpm for 5 min at 4° C., frozen and stored at −80° C. Frozen pellets were suspended in 20 ml HEPES-NaOH (20 mM, pH 7.4) containing 10 mM EDTA and homogenized with a Polytron (PT 6000, Kinematica) at 14′000 rpm for 20 s. The homogenate was centrifuged at 48′000×g for 30 min at 4° C. Subsequently, the supernatant was removed and discarded, and the pellet resuspended in 20 ml HEPES-NaOH (20 mM, pH 7.4) containing 0.1 mM EDTA using the Polytron (20 s at 14′000 rpm). This procedure was repeated and the final pellet resuspended in HEPES-NaOH containing 0.1 mM EDTA and homogenized using the Polytron. Typically, aliquots of 2 ml membrane portions were stored at −80° C. With each new membrane batch the dissociation constant (Kd) was determined via a saturation curve. The TAAR1 radioligand 3[H] (S)-4-[(ethyl-phenyl-amino)-methyl]-4,5-dihydro-oxazol-2-ylamine (described in WO 2008/098857) was used at a concentration equal to the calculated Kd value, that was usually around 2.3 nM, resulting in the binding of approximately 0.2% of the radioligand and a specific binding representing approximately 85% of the total binding.
- Rat Synaptosome Binding Assay The synaptosomes (150 μg) prepared from a rat brain were incubated at 37° C. for 15 minutes with 0.1 μCi [3H]5-HT in the absence or presence of the test compound or the reference compound in a buffer solution containing 106.2 mM NaCl, 4.5 mM KCl, 2.25 mM MgSO4, 1.08 mM NaH2PO4, 22.5 mM NaHCO3, 9.9 mM glucose, 9 μM EGTA and 45 μM ascorbic acid (pH 7.4).The basal control activity was determined by incubating the same mixture at 4° C. for 15 minutes in the presence of 10 μM imipramine to block the uptake of 5-HT, which was taken as the standard reference compound and tested in each experiment at several concentrations to obtain an inhibition curve.Following the incubation, the samples were filtered rapidly under vacuum through glass fiber filters (GF/B, Packard) and rinsed twice with an ice-cold incubation buffer using a 96-sample cell harvester (Unifilter, Packard) to eliminate free [3H]5-HT. The filters were dried and the retained radioactivity was measured in a scintillation counter (Topcount, Packard) using a scintillation cocktail (Microscint 0, Packard). The experimental results were expressed as a percent inhibition of the control uptake of [3H]5-HT.Data AnalysisInhibition of serotonin transporter in rat synaptosome was measured by the concentrations of [3H]5-HT. The test compounds were required to be tested at least twice in the case of the concentration thereof being greater than 6 log, and the obtained data were subjected to a nonlinear regression analysis via a curve of Hill equation, to obtain IC50 value.
- Sodium-Dependent Glucose Transporter (SGLT) Assay The SGLT activity is measured as sodium-dependent 14C-AMG uptake in the above cell lines described as follows. One hundred uL of culture medium containing 30,000 cells are seeded to each well of a 96-well BioCoat poly-D-lysine plate (Becton Dickson) and cultured at 37° C. overnight. The culture medium is aspirated and cells are washed twice with 200 uL of Reaction Buffer (140 mM NaCl, 2 mM KCl, 1 mM CaCl2, MgCl2, and 14 mM N-2-hydroethylpiperrazine-N'-2-ethanesulfonic acid (Hepes), pH 7.5). The excess buffer is tapped out onto paper towels. Thirty-five uL of Reaction Buffer are added to each well. Five uL of a 10% dimethylsulfoxide (DMSO) in Reaction Buffer containing varying concentrations of test compound or no compound as a control, is dispensed into the each well. The reaction is initiated by adding 10 uL of 14C-AMG in Reaction Buffer to make a final concentration of 4 uM. The plate is incubated at 37° C. for 125 minutes. The reaction is terminated by aspirating off Reaction Buffer and then washed three times with 200 uL of ice cold Reaction Buffer. Manual aspiration is applied to ensure the complete removal of Reaction Buffer. Ten uL of 0.1 N NaOH is added to each well and then 100 uL of Supermix scintillation cocktail (PerkinElmer) is added. After mixing, the scintillation signal in the plate is counted in a MicroBeta (PerkinElmer). A ten-dose response curve is fitted to an empirical four-parameter model using ActivityBase (ID Business Solution) to determine the inhibitor concentration at half-maximal inhibition (IC50).
- TNF induced HEK-Blue assay Test compounds serially diluted in DMSO were plated in an assay plate (Labcyte, Cat. #LP-0200) at final concentrations ranging from 0.004 μM to 25 μM. TNFα (final concentration 0.5 ng/ml) or CD40L (final concentration 30 ng/ml) in assay buffer [DMEM, 4.5 g/l glucose (Gibco, Cat. 21063-029), 10% FBS (Sigma, F4135), 1% Penicillin-Streptomycin (Gibco, Cat. 15140-122), 1% Anti-Anti (Gibco, Cat. 15240-112) and 2 mM L-glutamine (Gibco, Cat. 25030-081)] was then added to the assay plate. After a 30 minute pre-incubation at 37° C. and 5% CO2, HEK-Blue-CD40L cells (InvivoGen, Cat. Code hkb-cd40) containing a NF-κB-driven secreted alkaline phosphatase reporter gene were seeded into the assay plate at a density of 20,000 cells per well. This plate was then incubated for 18 h at 37° C. and 5% CO2. Secreted alkaline phosphatase expression was measured using QUANTI-Blue (InvivoGen, Cat. Code rep-qb1) according to manufacturer's specifications and the assay plate was read on a PerkinElmer Envision at 620 nm.Inhibition data for the test compound over a range of concentrations was plotted as percentage inhibition of the test compound (100%=maximum inhibition). IC50 values were determined after correcting for background [(sample read−mean of low control)/(mean of high control−mean of low control)] where by the low control is DMSO without stimulation and high control is DMSO with stimulation. The IC50 is defined as the concentration of test compound which produces 50% inhibition and was quantified using the 4 parameter logistic equation to fit the data.
- TNF or CD40L-Induced HEK-Blue Assay Test compounds serially diluted in DMSO were plated in an assay plate (LABCYTE, Cat. # LP-0200) at final concentrations ranging from 0.004 μM to 25 μM. TNFα (final concentration 0.5 ng/ml) or CD40L (final concentration 30 ng/ml) in assay buffer [DMEM, 4.5 g/l glucose (Gibco, Cat. 21063-029), 10% FBS (Sigma, F4135), 1% Penicillin-Streptomycin (Gibco, Cat. 15140-122), 1% Anti-Anti (Gibco, Cat. 15240-112) and 2 mM L-glutamine (Gibco, Cat. 25030-081)] was then added to the assay plate. After a 30 minute pre-incubation at 37° C. and 5% CO2, HEK-Blue -CD40L cells (INVIVOGEN, Cat. Code hkb-cd40) containing a NF-kB-driven secreted alkaline phosphatase reporter gene were seeded into the assay plate at a density of 20,000 cells per well. This plate was then incubated for 18 h at 37° C. and 5% CO2. Secreted alkaline phosphatase expression was measured using QUANTI-Blue (INVIVOGEN, Cat. Code rep-qb1) according to manufacturer's specifications and the assay plate was read on a PerkinElmer Envision at 620 nm.Inhibition data for the test compound over a range of concentrations was plotted as percentage inhibition of the test compound (100%=maximum inhibition). IC50 values were determined after correcting for background [(sample read−mean of low control)/(mean of high control−mean of low control)] where by the low control is DMSO without stimulation and high control is DMSO with stimulation. The IC50 is defined as the concentration of test compound which produces 50% inhibition and was quantified using the 4 parameter logistic equation to fit the data.
- TNF or CD40L-Induced HEK-Blue Assay Test compounds serially diluted in DMSO were plated in an assay plate (Labcyte, Cat. #LP-0200) at final concentrations ranging from 0.004 μM to 25 μM. TNFα (final concentration 0.5 ng/ml) or CD40L (final concentration 30 ng/ml) in assay buffer [DMEM, 4.5 g/l glucose (Gibco, Cat. 21063-029), 10% FBS (Sigma, F4135), 1% Penicillin-Streptomycin (Gibco, Cat. 15140-122), 1% Anti-Anti (Gibco, Cat. 15240-112) and 2 mM L-glutamine (Gibco, Cat. 25030-081)] was then added to the assay plate. After a 30 minute pre-incubation at 37° C. and 5% CO2, HEK-Blue-CD40L cells (InvivoGen, Cat. Code hkb-cd40) containing a NF-κB-driven secreted alkaline phosphatase reporter gene were seeded into the assay plate at a density of 20,000 cells per well. This plate was then incubated for 18 h at 37° C. and 5% CO2. Secreted alkaline phosphatase expression was measured using QUANTI-Blue (InvivoGen, Cat. Code rep-qbl) according to manufacturer's specifications and the assay plate was read on a PerkinElmer Envision at 620 nm. Inhibition data for the test compound over a range of concentrations was plotted as percentage inhibition of the test compound (100%=maximum inhibition). IC50 values were determined after correcting for background [(sample read−mean of low control)/(mean of high control−mean of low control)] where by the low control is DMSO without stimulation and high control is DMSO with stimulation. The IC50 is defined as the concentration of test compound which produces 50% inhibition and was quantified using the 4 parameter logistic equation to fit the data.
- cAMP assay A.1 This cell based assay measures the ability of compounds to inhibit the constitutive cAMP activity of GPR6 receptor expressed in CHO-K1 cells. CHO cells were stably expressed with GPR6 receptor, whose expression is controlled by a tetracycline inducable element. The cells were cultured in medium containing F12K, 10% FBS, 1% Penn/Strep, 200 ug/mL Hygromycin. GPR6 receptor expression was induced for 20 hrs with 1 μg/ml doxycycline (sigma D9891) in growth media. After addition of doxycycline cells were plated at a density of 250-500 cells per well in half-volume black clear bottom plates (Costar) and place in an incubator (37°, 5% C(O)2) for 20 hours prior to cAMP assays. Culture media was removed from cells and they were washed with 50 μL of Ringer's Buffer (MgCl2 0.047 mg/mL, NaH2PO4 0.18 mg/mL, Na2HPO4 0.1 mg/mL, KCl 0.34 mg/mL, NaHC(O)3 1.26 mg/mL, D-glucose 1.8 mg/mL, NaCl 7 mg/mL; pH=7.4). Compounds suspended in DMSO were diluted in Ringer's Buffer containing 0.5% fatty acid free BSA and incubated on cells for 45 min at 37° and 5% C(O)2. After incubation cells were incubated for 10 min at room temp with Eu-cAMP tracer solution from a Perkin Elmer Lance HTRF UltracAMP assay kit (TRF0264). Then ULight-anti-cAMP solution from the Lance HTRF kit was added and incubated on a shaker at room temp for 1 hour prior to HTRF detection in a BMG PolarStar Omega. IC50 curves were generated with a four-parameter logistic equation using GraphPad Prism 5.03.
- hERG Inhibition Assay The effect of compounds of the formula I on the cloned human cardiac hERG channel was evaluated in an in vitro model using a whole-cell patch-clamping technique. CHO (Chinese hamster ovary) cells stably expressing hERG, the potassium channel underlying IKr currents in human hearts, were grown in HAM's F-12 media supplemented with 10% fetal bovine serum, 1x penicillin/streptomycin and 500 ug/ml G418 (Invitrogen, Carlsbad, Calif., USA) in an atmosphere of 95% air and 5% carbon dioxide. Cells used for patch-clamping were seeded on glass or plastic coverslips 12 to 36 hours before use. hERG channel currents were recorded at room temperature using the whole-cell configuration of the patch clamp technique with an Axopatch 200B amplifier (Axon Instruments, Foster City, Calif., USA). Briefly, electrodes (3 to 6 MΩ resistance) were fashioned from TW150F glass capillary tubes (World Precision Instruments, Sarasota, Fla., USA) and filled with pipette solution (containing 120 mM potassium aspartate, 20 mM potassium chloride, 4 mM adenosine triphosphate disodium salt, 5 mM HEPES, 1 mM magnesium chloride; pH adjusted to 7.2 with potassium hydroxide). hERG currents were initiated by a positive voltage pulse (20 mV) followed by a negative pulse (-40 mV) and were recorded for off-line analyses. Once hERG current from a cell perfused with external solution (containing 130 mM sodium chloride, 5 mM potassium chloride, 2.8 mM sodium acetate, 1 mM magnesium chloride, 10 mM HEPES, 10 mM glucose, 1 mM calcium chloride; pH adjusted to 7.4 with sodium hydroxide) without the test compound, i.e. control solution, was stabilized, the cell was perfused with external solution containing the test compound at specific concentrations.
- A.2 Inhibition of cAMP Activity of GPR6 In Vitro Assay This cell based assay measures the ability of compounds to inhibit the constitutive cAMP activity of GPR6 receptor expressed in CHO-K1 cells. CHO cells were stably expressed with GPR6 receptor, whose expression is controlled by a tetracycline inducible element. The cells were cultured in medium containing F12K, 10% FBS, 1% Penn/Strep, 200 ug/mL Hygromycin. GPR6 receptor expression was induced for 20 hrs with 2 □g/ml doxycycline (sigma D9891) in growth media. After addition of doxycycline cells were plated at a density of 450-750 cells per well in 96-well half-volume black tissue culture plates (Costar) and placed in an incubator (37°, 5% CO2) for 20 hours prior to cAMP assays.Culture media was removed from cells and they were washed with 50 L/well of Ringer's Buffer (MgCl2 0.047 mg/mL, NaH2PO4 0.18 mg/mL, Na2HPO4 0.1 mg/mL, KCl 0.34 mg/mL, NaHCO3 1.26 mg/mL, D-glucose 1.8 mg/mL, NaCl 7 mg/mL; pH=7.4). Compounds suspended in DMSO were diluted in Ringer's Buffer containing 0.5% fatty acid free BSA plus 300 μM IBMX and incubated on cells for 45 min at 37° and 5% CO2. After incubation cells were incubated for 10 min at room temp with Eu-cAMP tracer solution from a Perkin Elmer Lance HTRF Ultra cAMP assay kit (TRF0263). Then ULight -anti-cAMP solution from the Lance HTRF kit was added and incubated on a shaker at room temp for 1 hour prior to HTRF detection in a Perkin Elmer Envision plate reader.EC50 curves were generated with a four-parameter logistic equation using GraphPad Prism 5.03.
- Assay for Dopamine Reuptake Inhibition Uptake inhibition assay for the dopamine transporter was conducted in rat brain synaptosomes as described elsewhere with minor modifications (Rothman et al., Synapse 39, 32-41 (2001)). Freshly removed caudate was homogenized in 10% ice-cold sucrose with 12 strokes of a hand-held Potter-Elvehjem homogenizer followed by centrifugation at 1000×g for 10 min. The supernatants were saved on ice and used immediately. Transporter activity was assessed using 5 nM [3H]dopamine. The assay buffer was Krebs-phosphate buffer containing 154.4 mM NaCl, 2.9 mM KCl, 1.1 mM CaCl2, 0.83 mM MgCl2, 5 mM glucose, 1 mg/mL ascorbic acid, and 50 μM pargyline. The selectivity of the uptake assay for DAT was optimized by including 100 nM citalopram and 100 nM desipramine as blockers of SERT and NET in the sucrose solution and assay buffer. Uptake inhibition assays were conducted at 25° C. and were initiated by adding 100 μl of tissue to 900 μL assay buffer containing test drug and [3H]dopamine. Test drugs were diluted in assay buffer containing 1 mg/mL bovine serum albumin. Nonspecific uptake was measured by incubating in the presence of 10 μM indatraline. The reactions were stopped after 15 minutes by rapid vacuum filtration with a cell harvester (BRANDEL) over GF/B filters (Whatman) presoaked in wash buffer maintained at 25° C. (10 mM Tris-HCl, pH 7.4/150 mM NaCl). Filters were rinsed with 6 mL wash buffer and retained tritium was quantified by a MicroBeta liquid scintillation counter (PerkinElmer) after overnight extraction in 0.6 mL of liquid scintillation cocktail (Cytoscint, ICN). The data from three experiments were pooled and fit to a dose-response curve equation (using Kaleidagraph), to yield an Emax and EC50 value.
- Beta-2 AR binding assay HEK 293 cells stability transfected with cDNA encoding human β2-AR (provided by Dr. Brian Kobilka, Stanford Medical Center, Palo Alto, Calif.) were grown in Dulbecco's Modified Eagle Medium (DMEM) containing 10% fetal bovine serum (FBS), 0.05% penicillin-streptomycin, and 400 μg/ml G418 as previously described (Pauwels et al., Biochem. Pharmacol. 42: 1683-1689, 1991). The cells were scraped from the 150×25 mm plates and centrifuged at 500×g for 5 minutes. The pellet was homogenized in 50 mM Tris-HCl, pH 7.7, with a Polytron, centrifuged at 27,000×g, and resuspended in the same buffer. The latter process was repeated, and the pellet was resuspended in 25 mM Tris-HCl containing 120 mM NaCl, 5.4 mM KCl, 1.8 mM CaCl2, 0.8 mM MgCl2, and 5 mM glucose, pH 7.4. The binding assays contained 0.3 nM [3H]CGP-12177 in a volume of 1.0 ml. Nonspecific binding was determined by 1 μM propranolol.According to the above-described methods, binding affinities, expressed as Ki values, were determined using membranes obtained from a HEK 293 cell line stably transfected with cDNA encoding human β2-AR (Pauwels et al., Biochem. Pharmacol. 42: 1683-1689, 1991) with [3H]CGP-12177 as the marker ligand. The resulting IC50 values and Hill coefficients were calculated for each test compound using GraphPad Prism software and Ki values were calculated using the Cheng-Prusoff transformation (Biochem Pharmacol 22: 3099-3108, 1973):K i=IC50/(1+L/K d)+ Eqn. 1.Where: L is the concentration of [3H]CGP-12177 and Kd is the binding affinity of the [3H]CGP-12177. Each test compounds was assayed three times.
- Binding Assay Cell culture: 293 HEK cells, stably transfected with plasmids capable of expressing human P2X7 receptor, were cultured by standard methods. Cells were plated to cell density of approximately 15,000 cells/well in 384-well assay plates (50 μl/well) with 1.5% low serum media (DMEM, 1.5% BCS, 1% L-glut (2 mM), 1% P/S).293 HEK cells, stably transfected with plasmids capable of expressing rat or mouse P2X7 receptor, were cultured by standard methods. Cells were plated to cell density of approximately 15,000 cells/well in 384-well assay plates (50 μl/well) with 1.5% low serum media (DMEM, 1.5% FBS, 1% L-glut (2 mM), 10 mM HEPES, 1% P/S). Cells were plated 24 hours prior to assay. Cells expressing human, rat or mouse P2X7 receptor were assayed in the following manner.Fluorescent Imaging Plate Reader (FLIPR) assay: Briefly, 293-human or mouse P2X7 stable cells were incubated in sucrose buffer, pH 7.4 [KCl (5 mM), NaH2PO4.2H2O (9.6 mM), HEPES (25 mM), sucrose (280 mM), glucose (5 mM), CaCl2 (0.5 mM), and probenecid (0.1425 g in 3 mL 1N NaOH was added for 500 mL solution)] in 384-well plates.293-rat P2X7 stable cells were incubated in HHPB (pH 7.4) [consisting of Hank's BSS (1×); HEPES (pH 7.4) (20 mM) (Sigma); probenecid (0.710 g/5 mL 1N NaOH) (Sigma); and BSA (0.05%) (Roche) which was added after the pH had been adjusted] in 384-well plates. Fluo-4 NW dye mix (Molecular Probes, Inc., Eugene, Oreg., USA) was prepared in buffer (see manufacturer's instructions). Cell plates were removed from the 37° C. incubator, the media discarded and then 30 μL of dye was added to each well. Plates were placed in the 37° C., non-CO2 incubator for 30 minutes and then room temperature for 30 minutes.
- Biological Assay Pharmacological assessment of the compounds of the invention was performed using HEK293-Nav1.8 in combination with an assay developed on the QPatch 48 HTX electrophysiological system. HEK293-Nav1.8 were prepared on the day of use by removing culture media, washing in DPBS, adding Accutase (2 ml to cover the surface, aspirate 1 ml then 1.5 min at 37° C.) followed by addition of CHO-SFM II to stop the enzyme digestion and in order to obtain a suspension of 3×10⁶ cell/mL. Compound was prepared in an extracellular solution of the following composition: NaCl (145 mM), KCl (4 mM), CaCl2 (2 mM), MgCl2 (2 mM), HEPES (1 mM), Glucose (10 mM), pH 7.4 with NaOH Osmolality 300 mOsM/L. The intracellular solution was used of the following composition: CsF (115 mM), CsCl (20 mM), NaCl (5 mM), EGTA (10 mM), HEPES (10 mM), Sucrose (20 mM), pH 7.2 with CsOH Osmolality 310 mOsm/L. Utilizing the voltage-clamp mode in the QPatch 48 HTX system a half inactivation state voltage protocol (V1/2) was used to determine pharmacological activity of compounds of the invention at Nav1.8 ion channels. A V1/2 protocol was utilized with the following voltage steps: a holding voltage of −100 mV was established followed by a 20 ms voltage step to 0 mV (P1), followed by an inactivating voltage step at −46 mV for 8 seconds, followed by a step to −100 mV for 20 ms, before a 20 ms step to 0 mV (P2) before returning to the holding voltage of −100 mV. This voltage protocol was repeated at a frequency of 0.07 Hz., current magnitude was quantified at the P2 step throughout the recording.
- Biological Assay The QPatch HT system (Sophion Bioscience A/S, Denmark) was used with the conventional whole-cell configuration. This system is an automated, chip-based planar patch clamp device allowing for up to 48 parallel independent experiments in one experimental assay run. Cells are added to each well and drawn by suction onto a small aperture to obtain a Gigaohm seal between the cell membrane and treated silicon surface, and whole-cell recordings initiated after access is achieved by suction and/or voltage pulses. The QPatch HT uses static perfusion, whereby a small volume of recording solution or drug is added to a reservoir on the chip and the solution perfuses across the cell through quartz-lined microfluidic channels; this solution is removed by capillary action when the next sample application is made.CHO-Kv1.3 cells were prepared for experiments by dissociation from T175 cell culture flasks using trypsin-EDTA (0.05%), cells were kept in serum free media in the cell hotel on board the QPatch HT. These cells were sampled, washed and re-suspended in extracellular recording solution by the QPatch HT immediately before application to the recording well site on the chip. Experiments were performed using the following solutions; extracellular solution contained (in mM); 150 NaCl, 10 KCl, 1 MgCl2, 3 CaCl2), 10 Glucose and 10 HEPES (pH 7.4, NaOH) and intracellular solution contained (in mM); 20 KCl, 120 KF, 10 HEPES, 10 EGTA, 5 ATP (pH 7.2, KOH).The potency (Inhibitory Concentration 50%, IC50) of synthesized compounds against Kv1.3 was determined from concentration-response relationships established by cumulatively applying four escalating concentrations of test compound to an individual cell and a minimum of N≥3 individual cells of data per compound were used to generate the IC50 value.
- Characterization of Agonism at Human D3 Receptors Using Cyclic Adenosine Monophosphate Detection Agonist activity at human D3 receptors was assayed by cAMP levels in HEK293 cells expressing recombinant human D3 receptors (BioXtal, Saint-Félix, France) stably co-expressing adenylyl cyclase V (ACV) (cell line developed by Gedeon Richter) by homogenous time-resolved fluorescence (HTRF) using the cAMP Gi kit (Cisbio/PerkinElmer). HEK293 cells expressing recombinant human D3 receptors and ACV were cultured in DMEM supplemented with 10% FBS, 1% penicillin-streptomycin antimycotic solution, 1% pyruvate, 100 μg/mL G418 (Thermo Fisher Scientific) and 60 μg/mL hygromycin B and maintained at 37° C. in a humidified atmosphere containing 5% CO2. Prior to measuring cAMP, cells were detached with Versene (Thermo-Fisher Scientific) and resuspended in assay buffer (140 mM NaCl, 5 mM KCl, 2 mM MgCl2, 2 mM CaCl2, 10 mM 2-[4-(2-hydroxyethyl) piperazin-1-yl]ethane-1-sulfonic acid (HEPES), 10 mM glucose, pH 7.4) in white-walled, half area 96-well microplates at a density of 15,000 cells/well and 20 μL volume. The assay buffer was supplemented with 100 μM IBMX (Sigma Aldrich, St Louis, MO, USA). After adding the test compounds (4×concentrated) or vehicle (DMSO) at 10 μL/well, cells were incubated with assay buffer or various concentrations of the test compounds for 20 minutes. After an additional 30 minutes incubation at ambient temperature with 1.5 μM forskolin (DMSO final concentration was 0.3%) cell stimulation was stopped by adding detection reagents (20 μL cAMP-d2 and 20 μL anti-cAMP cryptate) diluted in lysis buffer (PerkinElmer). The time-resolved fluorescence (TRF) signal was quantified with a PHERAstar FS multimode reader (BMG Labtech, Ortenberg, Germany) using standard HTRF settings with laser excitation at 337 nm after 60 minutes of incubation at ambient temperature.
- Evaluation of Activity for OX1R and OX2R HEK293 (human embryonic kidney 293) cells with forced expression of human OX1R (hOX1R) or human OX2R (hOX2R) were seeded in a 384-well microplate (Greiner) at 10,000 per well and cultured for 1 day in high-glucose-DMEM (FujiFilm Corp. Wako Pure Chemical Industries, Ltd.) containing added 10% FBS (Tenno Scientific) and 1% Penicillin-Streptomycin (FujiFilm Corp. Wako Pure Chemical Industries, Ltd.). After removing the medium, 40 μL of assay buffer (20 mM HEPES (Sigma-Aldrich Japan, KK.), Hanks' balanced salt solution (Gibco), 0.1% BSA (Sigma-Aldrich Japan, KK.), 0.1% Pluronic F-127 (Invitrogen)) containing Calcium 4 dye (Molecular Device Corporation) and 2.5 mM probenecid (Sigma-Aldrich Japan, KK.) were added, and the plate was incubated for 60 minutes. After further adding 20 μL of assay buffer, 20 μL of assay buffer containing the test compound was added and reaction was initiated. Change in intracellular calcium ion concentration during the reaction was measured based on the fluorescence intensity ratio in terms of the fluorescence value with wavelength excitation at 480 nm and detection at 540 nm, using FDSS7000 (Hamamatsu Photonics, K.K.). The test compound was dissolved in DMSO to 10 mM, and diluted with assay buffer to a final concentration of from 3×10⁻¹¹ M to 1×10⁻⁷ M (DMSO final concentration of 0.1%). The half maximal effective concentration (EC50 value) was determined from the fluorescence value with addition of the test compound at different concentrations, with the fluorescence value of the well with compound-free buffer added as 0%, and the fluorescence value of the well with 10 nM OX-A (Peptide Research Lab) as 100%.
- Evaluation of Kv1.3 Potassium Channel Blocker Activity Assay This assay is used to evaluate the disclosed compounds' activities as Kv1.3 potassium channel blockers. The cells were bathed in an extracellular solution containing 140 mM NaCl, 4 mM KCl, 2 mM CaCl2), 1 mM MgCl2, 5 mM glucose, 10 mM HEPES; pH adjusted to 7.4 with NaOH; 295-305 mOsm. The internal solution contained 50 mM KCl, 10 mM NaCl, 60 mM KF, 20 mM EGTA, 10 mM HEPES; pH adjusted to 7.2 with KOH; 285 mOsm. All compounds were dissolved in DMSO at 30 mM. Compound stock solutions were freshly diluted with external solution to concentrations of 30 nM, 100 nM, 300 nM, 1 μM, 3 μM, 10 μM, 30 μM and 100 μM. The highest content of DMSO (0.3%) was present in 100 μM. Voltage Protocol: The currents were evoked by applying 100 ms depolarizing pulses from −90 mV (holding potential) to +40 mV were applied with 0.1 Hz frequency. Control (compound-free) and compound pulse trains for each compound concentration applied contained 20 pulses. 10-second breaks were used between pulse trains. Patch Clamp Recordings and Compound Application. Whole-cell current recordings and compound application were enabled by means of an automated patch clamp platform Patchliner (Nanion Technologies GmbH). EPC 10 patch clamp amplifier (HEKA Elektronik Dr. Schulze GmbH) along with Patchmaster software (HEKA Elektronik Dr. Schulze GmbH) was used for data acquisition. Data were sampled at 10 kHz without filtering. Passive leak currents were subtracted online using a P/4 procedure (HEKA Elektronik Dr. Schulze GmbH). Increasing compound concentrations were applied consecutively to the same cell without washouts in between. Total compound incubation time before the next pulse train was not longer than 10 seconds. Peak current inhibition was observed during compound equilibration.
- FRET Activity Assay Expression and purification of the FXR-LBD: An overnight preculture of a transformed E. coli strain was diluted 1:20 in LB-Ampicillin medium and grown at 30° C. to an optical density of OD600=0.4-0.6. Gene expression was then induced by addition of 0.5 mM IPTG. Cells were incubated an additional 6 h at 30° C., 180 rpm. Cells were collected by centrifugation (7000×g, 7 min, rt). Per liter of original cell culture, cells were resuspended in 10 mL lysis buffer (50 mM Glucose, 50 mM Tris pH 7.9, 1 mM EDTA and 4 mg/mL lysozyme) and left on ice for 30 min. Cells were then subjected to sonication and cell debris removed via centrifugation (22000×g, 30 min, 4° C.). Per 10 mL of supernatant 0.5 mL prewashed Glutathione 4B sepharose slurry (Qiagen) was added and the suspension kept slowly rotating for 1 h at 4° C. Glutathione 4B sepharose beads were pelleted by centrifugation (2000×g, 15 sec, 4° C.) and washed twice in wash buffer (25 mM Tris, 50 mM KCl, 4 mM MgCl2 and 1M NaCl). The pellet was resuspended in 3 mL elution buffer per liter of original culture (elution buffer: 20 mM Tris, 60 mM KCl, 5 mM MgCl2 and 80 mM glutathione added immediately prior to use as powder). The suspension was left rotating for 15 min at 4° C., the beads pelleted and eluted again with half the volume of elution buffer than the first time. The eluates were pooled and dialysed overnight in 20 mM Hepes buffer (pH 7.5) containing 60 mM KCl, 5 mM MgCl2 as well as 1 mM dithiothreitol and 10% (v/v) glycerol. The protein was analysed by SDS-Page.
- Fluorescent Imaging Plate Reader (FLIPR) Assay Briefly, 293-human or mouse P2X7 stable cells were incubated in sucrose buffer, pH 7.4 [KCl (5 mM), NaH2PO42H2O (9.6 mM), HEPES (25 mM), sucrose (280 mM), glucose (5 mM), CaCl2 (0.5 mM), and probenecid (0.1425 g in 3 mL 1N NaOH was added for 500 mL solution)] in 384-well plates. 93-rat P2X7 stable cells were incubated in HHPB (pH 7.4) [consisting of Hank's BSS (1X); HEPES (pH 7.4) (20 mM) (Sigma); probenecid (0.710 g/5 mL 1N NaOH) (Sigma); and BSA (0.05%) (Roche) which was added after the pH had been adjusted] in 384-well plates. Fluo-4 NW dye mix (Molecular Probes, Inc., Eugene, Oreg., USA) was prepared in buffer (see manufacturer's instructions). Cell plates were removed from the 37° C. incubator, the media discarded and then 30 μL of dye was added to each well. Plates were placed in the 37° C., non-CO2 incubator for 30 minutes and then room temperature for 30 minutes. Two sets of drug plates were prepared: A) Mixtures of compound plus agonist were prepared as follows, in order to determine close response: BzATP: 11 point ½ log, diluted in buffer, starting from 1 mM. Testing compounds: 11 point ½ log, diluted in 2% DMSO buffer starting from 10 μM. B) Agonist only mixture was prepared with BzATP at a single concentration in buffer (concentration determined by dose response). Compound mixtures (A) were added to assay plates containing cells and placed at room temperature for 30 minutes, then BzATP (B) was added. Fluorescence was read using the Tetra FLIPR® (Molecular Devices, Inc., Sunnyvale, Calif., USA) and IC50 values were calculated by standard methods to determine antagonist activity.
- HEK-URAT1 assay URAT1 stably expressed HEK293 cells (HEK-URAT1) or HEK293 cells transfected with empty vector (HEK-mock) were cultured in DMEM culture medium supplemented with 10% fetal bovine serum in an incubator under conditions of 5% carbon dioxide at 37° C. Subsequently, 1×10⁵ cells were respectively seeded in 24-well culture plate coated with poly D-lysine and the uptake test was started after the culturing for 3 days.The uptake experiment of uric acid was performed at 37° C. The cells were washed 3 times with a solution pH 7.4 (Hanks buffer solution that does not contain chloride ions, 125 mM sodium gluconate, 4.8 mM potassium gluconate, 1.2 mM KH2PO4, 1.2 mM MgSO4, 1.3 mM calcium gluconate, 25 mM HEPES, 5.6 mM glucose, and 12.4 mM tris) which was warmed to 37° C. for uptake experiment and equilibrated at 37° C. for 10 minutes. After a buffer solution was removed from the cells, 0.5 mL of an uptake solution containing 5 μM [14C] uric acid with or without a test compound was respectively added and the cells were incubated for 2 minutes. The cell uptake was stopped by adding an ice-cold Hanks buffer solution without chloride ions and the cells were washed 3 times. The cells were lysed with 0.1 N sodium hydroxide and the radioactivity was measured using LSC6100 (Aloka Co., Ltd. Tokyo). Each uptake into HEK-URAT1 was acquired by subtracting uptake into HEK-mock cells from the value of HEK-URAT1, converting the result to per mg protein of cells, and setting the value from uptake without the test compound as 100%. The uptake in each condition was performed in triplicate and each value was represented by average±standard deviation.(2) Test Results
- In Vitro Urat1 Assay A plasmid (EX-T4563-M03, GeneCopoeia) containing the full-length human URAT1 gene (SLC22A12) was transfected into Flp-InT-REx-293 cells to construct URAT1 high-expression cell 293/hURAT1. The transfected cells were assayed for ability to uptake uric acid labelled with radioisotope. The test compounds were then evaluated for their activity by determining of their ability to block uric acid uptake by the transfected cells.293/h URAT1 cells were plated at a density of 40000 cells/well in poly D-lysine-coated 96-well plates (BD, 356461) and incubated overnight. The medium was removed and a pre-warmed reaction buffer was added (125 mM sodium gluconate, 4.8 mM potassium gluconate, 1.3 mM calcium gluconate, 1.2 mM potassium dihydrogen phosphate, 1.2 mM magnesium sulfate, 5.6 mM glucose, 25 mM HEPES, pH 7.4) before incubating at 37° C. for 10 minutes. The buffer was removed and another reaction buffer containing 50 μM 14C-uric acid (American Radiolabeled Chemicals, ARC0513) and the test compounds or solvent control was added before incubating at 37° C. for 5 minutes. The buffer was removed, and the plates were washed 3 times with the buffer. Cells were lysed by adding 100 mM NaOH for 20 minutes. Cell lysates were transferred to Isoplate-96 well plates (PerkinElmer, 6005040), mixed with liquid scintillators and were counted in a MicroBeta2 (PerkinElmer) counter.The test compounds were all dissolved in DMSO, and DMSO of the same concentration without the test compounds was used as a solvent control. The amount of uric acid uptake by the cells in the DMSO solvent control was taken as 100%, and the inhibition of uric acid uptake by cells in the test wells for each compound was calculated as a percentage. The IC50 of each compound was calculated using the percentage of inhibition at different concentrations.
- Inhibition Assay The assay was performed on hERG channel stably expressed in HEK293 cells. The cells were cultured at 37° C. in a humidified CO2 incubator in the growth medium consisting of DMEM, 10% fetal bovine serum and antibiotics. Prior to the assay, the cells were seeded onto a 12 mm PDL-coated glass coverslip and cultured in a 35 mm Petri dish. After 16 to 40 hr culture, the cover slip was transferred into the chamber of OctaFlow perfusion system (ALA Instrument) and under a constant flow of extracellular solution (140 mM NaCl, 4 mM KCl, 1 mM MgCl2, 2 mM CaCl2, 10 mM HEPES, 10 mM D-glucose, pH 7.35, osmolarity 290). Whole cell patch clamping was performed with a glass micropipette filled with intracellular solution (120 mM KCl, 1.75 mM MgCl2, 5.4 mM CaCl2, 10 mM HEPES, 10 mM EGTA, and 4 mM ATP-K2, PH 7.2, osmolarity 310). Giga-seal was maintained during the test. The voltage control and current measurement were carried out using Axon amplifier 700B, Digidata 1440A and CLAMPEX10 software (Molecular Devices). Whole-cell hERG currents were recorded following the Petroski protocol: the cell was held at −80 mV, and the voltage step jumped from −80 to 30 mV and stay for 2 sec with a 20 ms prepulse at −40 mV. After depolarization, the voltage was decreased to −40 mV and stay for 2 sec, and returned back to −80 mV. Test compound was applied by quartz capillary tubes tip (200 μm inner diameter), and the flow rate was controlled at 2-3 mL/min with OctaFlow perfusion system. Different concentrations of the compound were applied to the cells for 5 min and the hERG current was measured three times before, during and after compound treatment.
- Inhibition Assay hERG: The assay was performed on hERG channel stably expressed in HEK293 cells. The cells were cultured at 37° C. in a humidified CO2 incubator in the growth medium consisting of DMEM, 10% fetal bovine serum and antibiotics. Prior to the assay, the cells were seeded onto a 12 mm PDL-coated glass coverslip and cultured in a 35 mm Petri dish. After 16 to 40 hr culture, the cover slip was transferred into the chamber of OctaFlow perfusion system (ALA Instrument) and under a constant flow of extracellular solution (140 mM NaCl, 4 mM KCl, 1 mM MgCl2, 2 mM CaCl2, 10 mM HEPES, 10 mM D-glucose, pH 7.35, osmolarity 290). Whole cell patch clamping was performed with a glass micropipette filled with intracellular solution (120 mM KCl, 1.75 mM MgCl2, 5.4 mM CaCl2, 10 mM HEPES, 10 mM EGTA, and 4 mM ATP-K2, PH 7.2, osmolarity 310). Giga-seal was maintained during the test. The voltage control and current measurement were carried out using Axon amplifier 700B, Digidata 1440A and CLAMPEX10 software (Molecular Devices). Whole-cell hERG currents were recorded following the Petroski protocol: the cell was held at −80 mV, and the voltage step jumped from −80 to 30 mV and stay for 2 sec with a 20 ms prepulse at −40 mV. After depolarization, the voltage was decreased to −40 mV and stay for 2 sec, and returned back to −80 mV. Test compound was applied by quartz capillary tubes tip (200 μm inner diameter), and the flow rate was controlled at 2-3 mL/min with OctaFlow perfusion system. Different concentrations of the compound were applied to the cells for 5 min and the hERG current was measured three times before, during and after compound treatment.
- Inhibition of cAMP Activity of GPR6 In Vitro A.1 Assay This cell based assay measures the ability of compounds to inhibit the constitutive cAMP activity of GPR6 receptor expressed in CHO-K1 cells. CHO cells were stably expressed with GPR6 receptor, whose expression is controlled by a tetracycline inducable element. The cells were cultured in medium containing F12K, 10% FBS, 1% Penn/Strep, 200 ug/mL Hygromycin. GPR6 receptor expression was induced for 20 hrs with 1 μg/ml doxycycline (sigma D9891) in growth media. After addition of doxycycline cells were plated at a density of 250-500 cells per well in half-volume black clear bottom plates (Costar) and place in an incubator (37°, 5% C(O)2) for 20 hours prior to cAMP assays. Culture media was removed from cells and they were washed with 50 μL of Ringer's Buffer (MgCl2 0.047 mg/mL, NaH2PO4 0.18 mg/mL, Na2HPO4 0.1 mg/mL, KCl 0.34 mg/mL, NaHC(O)3 1.26 mg/mL, D-glucose 1.8 mg/mL, NaCl 7 mg/mL; pH=7.4). Compounds suspended in DMSO were diluted in Ringer's Buffer containing 0.5% fatty acid free BSA and incubated on cells for 45 min at 37° and 5% C(O)2. After incubation cells were incubated for 10 min at room temp with Eu-cAMP tracer solution from a Perkin Elmer Lance HTRF UltracAMP assay kit (TRF0264). Then ULight-anti-cAMP solution from the Lance HTRF kit was added and incubated on a shaker at room temp for 1 hour prior to HTRF detection in a BMG PolarStar Omega. IC50 curves were generated with a four-parameter logistic equation using GraphPad Prism 5.03.
- Inhibition of cAMP Activity of GPR6 In Vitro A.2 Assay This cell based assay measures the ability of compounds to inhibit the constitutive cAMP activity of GPR6 receptor expressed in CHO-K1 cells. CHO cells were stably expressed with GPR6 receptor, whose expression is controlled by a tetracycline inducable element. The cells were cultured in medium containing F12K, 10% FBS, 1% Penn/Strep, 200 ug/mL Hygromycin. GPR6 receptor expression was induced for 20 hrs with 2 μg/ml doxycycline (sigma D9891) in growth media. After addition of doxycycline cells were plated at a density of 450-750 cells per well in 96-well half-volume black tissue culture plates (Costar) and placed in an incubator (37°, 5% CO2) for 20 hours prior to cAMP assays. Culture media was removed from cells and they were washed with 50 μL/well of Ringer's Buffer (MgCl2 0.047 mg/mL, NaH2PO4 0.18 mg/mL, Na2HPO4 0.1 mg/mL, KCl 0.34 mg/mL, NaHCO3 1.26 mg/mL, D-glucose 1.8 mg/mL, NaCl 7 mg/mL; pH=7.4). Compounds suspended in DMSO were diluted in Ringer's Buffer containing 0.5% fatty acid free BSA plus 300 μM IBMX and incubated on cells for 45 min at 37° and 5% CO2. After incubation cells were incubated for 10 min at room temp with Eu-cAMP tracer solution from a Perkin Elmer Lance HTRF Ultra cAMP assay kit (TRF0263). Then ULight-anti-cAMP solution from the Lance HTRF kit was added and incubated on a shaker at room temp for 1 hour prior to HTRF detection in a Perkin Elmer Envision plate reader. IC50 curves were generated with a four-parameter logistic equation using GraphPad Prism 5.03.
- Intracellular Ca2+ Mobilization Assay A monoclonal HEK-293 cell line stably transfected with a cDNA encoding for the human mGlu5a receptor was generated; for the work with mGlu5 Positive Allosteric Modulators (PAMs), a cell line with low receptor expression levels and low constitutive receptor activity was selected to allow the differentiation of agonistic versus PAM activity. Cells were cultured according to standard protocols (Freshney, 2000) in Dulbecco's Modified Eagle Medium with high glucose supplemented with 1 mM glutamine, 10% (vol/vol) heat-inactivated bovine calf serum, Penicillin/Streptomycin, 50 μg/ml hygromycin and 15 μg/ml blasticidin (all cell culture reagents and antibiotics from Invitrogen, Basel, Switzerland). bout 24 hrs before an experiment, 5×10⁴ cells/well were seeded in poly-D-lysine coated, black/clear-bottomed 96-well plates. The cells were loaded with 2.5 μM Fluo-4AM in loading buffer (1×HBSS, 20 mM HEPES) for 1 hr at 37 °C. and washed five times with loading buffer. The cells were transferred into a Functional Drug Screening System 7000 (Hamamatsu, Paris, France), and 11 half logarithmic serial dilutions of test compound at 37 °C. were added and the cells were incubated for 10-30 min. with on-line recording of fluorescence. Following this pre-incubation step, the agonist L-glutamate was added to the cells at a concentration corresponding to EC20 (typically around 80 μM) with on-line recording of fluorescence; in order to account for day-to-day variations in the responsiveness of cells, the EC20 of glutamate was determined immediately ahead of each experiment by recording of a full dose-response curve of glutamate. Responses were measured as peak increase in fluorescence minus basal (i.e. fluorescence without addition of L-glutamate), normalized to the maximal stimulatory effect obtained with saturating concentrations of L-glutamate.
- Ligand-Displacement Binding Twenty-four hours after adenoviral infection with human β2-AR, HEK293 cells were harvested in lysis buffer, Tris-HCl [5 mM, pH 7.4] containing EGTA [5 mM], and homogenized with 15 strokes on ice. Samples were centrifuged at 30,000×g for 15 minutes to pellet membranes. Membranes were resuspended in binding buffer, Tris-HCl [20 mM, pH 7.4] containing NaCl (120 mM), KCl (5.4 mM), CaCl2 (1.8 mM), MgCl2 (0.8 mM), and glucose (5 mM) and stored in aliquots at −80° C. Binding assays were performed on 5-10 μg of membrane protein using saturating amounts (1-300 pM) of the β-AR-specific ligand [125I]cyanopindolol (ICYP). For competition binding, the 5-10 μg of membrane protein were pretreated with 50 μM of GTPγs (non-hydrolyzable guanosine triphosphate) and then incubated with 125ICYP (50 pM) and different concentrations of fenoterol or its isomers in a total volume of 250 μL. Nonspecific binding was determined in the presence of 20 μM propranolol. Reactions were conducted in 250 μL of binding buffer at 37° C. for 1 hour. The binding reaction was terminated by addition of ice-cold Tris-HCl [10 mM, pH 7.4] to the membrane suspension, followed by rapid vacuum filtration through glass-fiber filters (Whatman GF/C). Each filter was washed three times with an additional 7 mL of ice-cold Tris-HCl [10 mM, pH 7.4]. The radioactivity of the wet filters was determined in a gamma counter. All assays were performed in duplicate, and receptor density was normalized to milligrams of membrane protein. Kd and the maximal number of binding sites (Bmax) for ICYP were determined by Scatchard analysis of saturation binding isotherms.
- SARS-CoV-2 antiviral assay Antiviral activity of compounds against SARS-CoV-2 is evaluated as described in Xue, Xi et al.2020. Briefly, the human alveolar epithelial cell line (A549) is maintained in a high-glucose DMEM supplemented with 10% fetal bovine serum, 1% P/S and 1% HEPES (ThermoFisher Scientific). The A549-hACE2 cells that stably express human angiotensin-converting enzyme 2 (hACE2) are grown in the culture medium supplemented with 10 μg/mL Blasticidin S (Mossel E. C., et al 2005). Cells are grown at 37 °C with 5% CO2. All culture medium and antibiotics are purchased from ThermoFisher Scientific (Waltham, MA). All cell lines are tested negative for mycoplasma. A549-hACE2 cells (12,000 cells per well in phenol-red free medium containing 2% FBS) are plated into a white opaque 96-well plate (Corning). On the next day, 2-fold serial dilutions of compounds are prepared in DMSO. The compounds are further diluted 100-fold in the phenol-red free culture medium containing 2% FBS. Cell culture fluids are removed and incubated with 200 nL of diluted compound solutions and 50 μL of SARS-CoV2-Nluc viruses (MOI 0.025). At 48 h post-infection, 50 μL Nano luciferase substrates (Promega) are added to each well. Luciferase signals are measured using a Synergy Neo2 microplate reader. The relative luciferase signals are calculated by normalizing the luciferase signals of the compound-treated groups to that of the DMSO-treated groups (set as 100%). The relative luciferase signal (Y axis) versus the log10 values of compound concentration (X axis) is plotted in software Prism 8. The EC50 (compound concentration for reducing 50% of luciferase signal) are calculated using a nonlinear regression model (four parameters). Two experiments are performed with technical duplicates.
- [3H]-Radioligand Binding Assay After thawing, membrane homogenates were resuspended in the binding buffer (8.5 mM HEPES, pH 7.4, 1.3 mM CaCl2, 1.2 mM MgSO4, 118 mM NaCl, 4.7 mM KCl, 4 mM NaHCO3, 1.2 mM KH2PO4, 11 mM glucose) to a final assay concentration of 6.4 μg (OX1) or 1.4 μg (OX2) protein per well. Saturation isotherms were determined by the addition of various concentrations (0-30 nM) of [3H]-4-(2,6-difluoro-4-methoxybenzyl)-2-(5,6-dimethoxypyridin-3-yl)-2H-1,2,4-benzothiadiazin-3(4H)-one 1,1-dioxide (Christopher et al, MedChemComm., 2015, 6, 947-955) in a total reaction volume of 250 μL for 90 min at rt. At the end of the incubation, membranes were filtered onto a 96-well GF/B filter pre-incubated with 0.5% polyethylenimine, with a Tomtec cell harvester and washed 5 times with 0.5 mL distilled water. Non-specific binding (NSB) was measured in the presence of 3.33 μM [4-(5-chloro-1,3-benzoxazol-2-yl)-7-methyl-1,4-diazepan-1-yl][5-methyl-2-(2H-1,2,3-triazol-2-yl)phenyl]methanone (Wertz et al, Angew. Chem. Int. Ed., 2011, 50, 11511-11515). Radioactivity on the filter was counted (1 min) on a Microbeta radiometric plate counter (Perkin Elmer) after addition of 50 μL of scintillation fluid (LabLogic: Part #SG-BXX-14). For competition binding experiments, membranes were incubated with [3H]-4-(2,6-difluoro-4-methoxybenzyl)-2-(5,6-dimethoxypyridin-3-yl)-2H-1,2,4-benzothiadiazin-3(4H)-one 1,1-dioxide at a concentration equal to the KD value of the radioligand (1.5 nM for OX1 and 0.75 nM for OX2 receptors respectively) and 10 concentrations of the inhibitory compound (between the ranges of 10 μM-0.94 pmol). IC50 values were derived from the inhibition curve and the equilibrium dissociation constant (Ki) values were calculated using the Cheng-Prusoff equation.
- cAMP assay A.2 Inhibition of cAMP Activity of GPR6 In Vitro AssayThis cell based assay measures the ability of compounds to inhibit the constitutive cAMP activity of GPR6 receptor expressed in CHO-K1 cells. CHO cells were stably expressed with GPR6 receptor, whose expression is controlled by a tetracycline inducable element. The cells were cultured in medium containing F12K, 10% FBS, 1% Penn/Strep, 200 ug/mL Hygromycin. GPR6 receptor expression was induced for 20 hrs with 2 μg/ml doxycycline (sigma D9891) in growth media. After addition of doxycycline cells were plated at a density of 450-750 cells per well in 96-well half-volume black tissue culture plates (Costar) and placed in an incubator (37°, 5% CO2) for 20 hours prior to cAMP assays. Culture media was removed from cells and they were washed with 50 μL/well of Ringer's Buffer (MgCl2 0.047 mg/mL, NaH2PO4 0.18 mg/mL, Na2HPO4 0.1 mg/mL, KCl 0.34 mg/mL, NaHCO3 1.26 mg/mL, D-glucose 1.8 mg/mL, NaCl 7 mg/mL; pH=7.4). Compounds suspended in DMSO were diluted in Ringer's Buffer containing 0.5% fatty acid free BSA plus 300 μM IBMX and incubated on cells for 45 min at 37° and 5% CO2. After incubation cells were incubated for 10 min at room temp with Eu-cAMP tracer solution from a Perkin Elmer Lance HTRF Ultra cAMP assay kit (TRF0263). Then ULight -anti-cAMP solution from the Lance HTRF kit was added and incubated on a shaker at room temp for 1 hour prior to HTRF detection in a Perkin Elmer Envision plate reader. IC50 curves were generated with a four-parameter logistic equation using GraphPad Prism 5.03.
- hERG Channel Inhibition The assay was performed on hERG channel stably expressed in HEK293 cells. The cells were cultured at 37° C. in a humidified CO2 incubator in the growth medium consisting of DMEM, 10% fetal bovine serum and antibiotics. Prior to the assay, the cells were seeded onto a 12 mm PDL-coated glass coverslip and cultured in a 35 mm Petri dish. After 16 to 40 hr culture, the cover slip was transferred into the chamber of OctaFlow perfusion system (ALA Instrument) and under a constant flow of extracellular solution (140 mM NaCl, 4 M KCl, 1 mM MgCl2, 1 mM CaCl2, 10 mM HEPES, 10 mM D-glucose, pH 7.35, osmolarity 290). Whole cell patch clamping was performed with a glass micropipette filled with intracellular solution (120 mM KCl, 1.75 mM MgCl2, 10 mM HEPES, 10 mM EGTA, and 4 mM ATP-K2, PH 7.2, osmolarity 300). Giga-seal was maintained during the test. The voltage control and current measurement were carried out using Axon amplifier 700B, Digidata 1440A and CLAMPEX10 software (Molecular Devices). Whole-cell hERG currents were recorded following the Petroski protocol: the cell was held at −80 mV, and the voltage step jumped from −80 to 30 mV and stay for 2 sec with a 20 ms prepulse at −40 mV. After depolarization, the voltage was decreased to −40 mV and stay for 2 sec, and returned back to −80 mV. Test compound was applied by quartz capillary tubes tip (200 μm inner diameter), and the flow rate was controlled at 2-3 ml/min with OctaFlow perfusion system. Different concentrations of the compound were applied to the cells for 5 min and the hERG current was measured three times before, during and after compound treatment. The data were analyzed using Clampfit 10 software (Molecular Devices). Results are shown in the table below.
- hERG Channel Inhibition The assay was performed on hERG channel stably expressed in HEK293 cells. The cells were cultured at 37° C. in a humidified CO2 incubator in the growth medium consisting of DMEM, 10% fetal bovine serum and antibiotics. Prior to the assay, the cells were seeded onto a 12 mm PDL-coated glass coverslip and cultured in a 35 mm Petri dish. After 16 to 40 hr culture, the cover slip was transferred into the chamber of OctaFlow perfusion system (ALA Instrument) and under a constant flow of extracellular solution (140 mM NaCl, 4 mM KCl, 1 mM MgCl2, 2 mM CaCl2, 10 mM HEPES, 10 mM D-glucose, pH 7.35, osmolarity 290). Whole cell patch clamping was performed with a glass micropipette filled with intracellular solution (120 mM KCl, 1.75 mM MgCl2, 5.4 mM CaCl2, 10 mM HEPES, 10 mM EGTA, and 4 mM ATP-K2, PH 7.2, osmolarity 310). Giga-seal was maintained during the test. The voltage control and current measurement were carried out using Axon amplifier 700B, Digidata 1440A and CLAMPEX10 software (Molecular Devices). Whole-cell hERG currents were recorded following the Petroski protocol: the cell was held at −80 mV, and the voltage step jumped from −80 to 30 mV and stay for 2 sec with a 20 ms prepulse at −40 mV. After depolarization, the voltage was decreased to −40 mV and stay for 2 sec, and returned back to −80 mV. Test compound was applied by quartz capillary tubes tip (200 μm inner diameter), and the flow rate was controlled at 2-3 mL/min with OctaFlow perfusion system. Different concentrations of the compound were applied to the cells for 5 min and the hERG current was measured three times before, during and after compound treatment.
- hERG Channel Inhibition The assay was performed on hERG channel stably expressed in HEK293 cells. The cells were cultured at 37° C. in a humidified CO2 incubator in the growth medium consisting of DMEM, 10% fetal bovine serum and antibiotics. Prior to the assay, the cells were seeded onto a 12 mm PDL-coated glass coverslip and cultured in a 35 mm Petri dish. After 16 to 40 hr culture, the cover slip was transferred into the chamber of OctaFlow perfusion system (ALA Instrument) and under a constant flow of extracellular solution (140 mM NaCl, 4 mM KCl, 1 mM MgCl2, 2 mM CaCl2, 10 mM HEPES, 10 mM D-glucose, pH 7.35, osmolarity 290). Whole cell patch clamping was performed with a glass micropipette filled with intracellular solution (120 mM KCl, 1.75 mM MgCl2, 5.4 mM CaCl2, 10 mM HEPES, 10 mM EGTA, and 4 mM ATP-K2, PH 7.2, osmolarity 310). Giga-seal was maintained during the test. The voltage control and current measurement were carried out using Axon amplifier 700B, Digidata 1440A and CLAMPEX10 software (Molecular Devices). Whole-cell hERG currents were recorded following the Petroski protocol: the cell was held at −80 mV, and the voltage step jumped from −80 to 30 mV and stay for 2 sec with a 20 ms prepulse at −40 mV. After depolarization, the voltage was decreased to −40 mV and stay for 2 sec, and returned back to −80 mV. Test compound was applied by quartz capillary tubes tip (200 μm inner diameter), and the flow rate was controlled at 2-3 ml/min with OctaFlow perfusion system. Different concentrations of the compound were applied to the cells for 5 min and the hERG current was measured three times before, during and after compound treatment. The data were analyzed using Clampfit 10 software (Molecular Devices) to generate IC50 values.
- hERG Channel Inhibition The assay was performed on hERG channel stably expressed in HEK293 cells. The cells were cultured at 37° C. in a humidified CO2 incubator in the growth medium consisting of DMEM, 10% fetal bovine serum and antibiotics. Prior to the assay, the cells were seeded onto a 12 mm PDL-coated glass coverslip and cultured in a 35 mm Petri dish. After 16 to 40 hr culture, the cover slip was transferred into the chamber of OctaFlow perfusion system (ALA Instrument) and under a constant flow of extracellular solution (140 mM NaCl, 4 mM KCl, 1 mM MgCl2, 2 mM CaCl2, 10 mM HEPES, 10 mM D-glucose, pH 7.35, osmolarity 290). Whole cell patch clamping was performed with a glass micropipette filled with intracellular solution (120 mM KCl, 1.75 mM MgCl2, 5.4 mM CaCl2, 10 mM HEPES, 10 mM EGTA, and 4 mM ATP-K2, PH 7.2, osmolarity 310). Giga-seal was maintained during the test. The voltage control and current measurement were carried out using Axon amplifier 700B, Digidata 1440A and CLAMPEX10 software (Molecular Devices). Whole-cell hERG currents were recorded following the Petroski protocol: the cell was held at −80 mV, and the voltage step jumped from −80 to 30 mV and stay for 2 sec with a 20 ms prepulse at −40 mV. After depolarization, the voltage was decreased to −40 mV and stay for 2 sec, and returned back to −80 mV. Test compound was applied by quartz capillary tubes tip (200 μm inner diameter), and the flow rate was controlled at 2-3 ml/min with OctaFlow perfusion system. Different concentrations of the compound were applied to the cells for 5 min and the hERG current was measured three times before, during and after compound treatment. The data were analyzed using Clampfit 10 software (Molecular Devices) to generate IC50 values.
- hERG Channel Inhibition The assay was performed on hERG channel stably expressed in HEK293 cells. The cells were cultured at 37° C. in a humidified CO2 incubator in the growth medium consisting of DMEM, 10% fetal bovine serum and antibiotics. Prior to the assay, the cells were seeded onto a 12-mm PDL-coated glass coverslip and cultured in a 35-mm Petri dish. After 16 to 40 hours culture, the coverslip was transferred into the chamber of OctaFlow perfusion system (ALA Instrument) and under a constant flow of extracellular solution (140 mM NaCl, 4 mM KCl, 1 mM MgCl2, 2 mM CaCl2, 10 mM HEPES, 10 mM D-glucose, pH 7.35, osmolarity 290). Whole cell patch clamping was performed with a glass micropipette filled with intracellular solution (120 mM KCl, 1.75 mM MgCl2, 5.4 mM CaCl2, 10 mM HEPES, 10 mM EGTA, and 4 mM ATP-K2, pH 7.2, osmolarity 310). Giga-seal was maintained during the test. The voltage control and current measurement were carried out using Axon amplifier 700B, Digidata 1440A and CLAMPEX10 software (Molecular Devices). Whole-cell hERG currents were recorded following the Petroski protocol: the cell was held at −80 mV, and the voltage step jumped from −80 to 30 mV and stay for 2 seconds with a 20-millisecond prepulse at −40 mV. After depolarization, the voltage was decreased to −40 mV and stay for 2 seconds, and returned back to −80 mV. Test compound was applied by quartz capillary tubes tip (200 m inner diameter), and the flow rate was controlled at 2-3 mL/min with OctaFlow perfusion system. Different concentrations of the compound were applied to the cells for 5 minutes and the hERG current was measured three times before, during and after compound treatment. The data were analyzed using Clampfit 10 software (Molecular Devices) to generate IC50 values.
- hURAT1 Inhibition Assay Human embryonic kidney cells (HEK293) was incubated in DMEM tissue culture medium, at 37° C., under 5% CO2 and 95% air atmosphere. TransIT-293 transfection agent (MIRUS BIO, Cat. No. MIR2706) and model URAT1 were used to construct transfected HEK293 cells. Transfected HEK293/hURAT1 cells were used to the test for 14C-uric acid transport activity. HEK293/hURAT1 cells were seeded in a 96-well plate (BD, Cat. No. 356461) fully coating with poly-D-lysine at a density of 6×10⁴ cells per well. Cells were incubated at 37° C. for at least 12 hrs in the calorstat, and then washed with pre-heated washing buffer (125 mM sodium gluconate, 10 mM HEPES pH=7.4) at an amount of 200 μL per well to wash out the culture medium. The uric acid [8-14C] (ARC, Cat. No. ARC0513-250UCI) containing or not containing the compound was added to 50 μL HBSS buffer which was free of chloric ion each well (HBSS buffer: 125 mM sodium gluconate, 4.8 mM potassium gluconate, 1.3 mM calcium gluconate, 1.2 mM potassium dihydrogen phosphate, 1.2 mM magnesium sulfate, 5.6 mM glucose, 25 mM HEPES pH=7.4) to make the specific concentration of the uric acid 1 μCi per well. The incubating solution was removed after 10 mins incubation, followed by adding 100 μL cold washing buffer, after washing with this buffer for 3 times, the buffer was completely removed from the well. 50 μL Lysis buffer (0.1 mM NaOH) was added to each well, and transferred to a 96-well plate (PERKIN ELMER, Cat. No. 6005040) containing scintillation fluid after 5 mins, and counted by MicroBeta Trilux (PerkinElmer) to give IC50 value eventually.
- pH Assay Culture medium was removed using an 8-channel-pipette (Rainin, USA) from the 96-well plate and the wells were refilled with 100 μL of loading buffer (20 mM HEPES, 115 mM NaCl, 5.4 mM KCl, 0.8 mM MgCl2, 1.8 mM CaCl2, 13.8 mM D-glucose, 2.5 mM probenecid, pH 7.4) containing 5 M Fura-2 AM (Dojin, Japan). The 96-well plate was incubated at 37° C. for 45 min. The cells were washed twice with 150 μL of measuring buffer (mentioned in step 2.2.(3) of Protocol 2, no probenecid). The wells were subsequently refilled with 70 μL of measuring buffer. Either 10 μL of measuring buffer or 10 μL of 10× stock serial dilution of test compound (described in step 3.2. above) were applied to each well. Usually, only one test compound was tested per 96-well plate. The number of replicates per 96-well plate for a particular antagonist at a particular concentration was 2×7 since, as described for the "agonist plate," two different sulfuric acid concentrations were used per 96-well plate and seven lanes (A-C, E-H) per 96-well plate were used (N=2×7). After an incubation at 4° C. for 15 min, the 96-well plate was transferred to a model FDSS-3000 plate reader apparatus (Hamamatsu Photonics K.K., Japan). Fura-2 fluorescent intensity was monitored as described in step 2.2.(5) above. After 16 time points of baseline detection, 20 μL of agonist solution (measuring buffer titrated with H2SO4 to yield a pH in the range of from about 5.0 to about 5.1 when mixed 1:4 with the measuring buffer containing test compound) was added to each well (final volume 100 μL/well).
- Cellular Assays for PI3Kalpha, Beta and Delta AlphaScreen (Amplified Luminescent Proximity Homogeneous Assay, ALPHA, Perkin Elmer) is a non-radioactive bead-based proximity assay technology to study biomolecular interactions in a homogenous microtiter plate format. The brand name SureFire denotes AlphaScreen assays that are adapted to quantify the phosphorylation of endogenous cellular proteins in cell lysates, by using matched antibody pairs, which consist of an anti-phospho-kinase and an anti-kinase antibody. The assay allows characterization of kinase signaling in cells as well as measurement of kinase inhibitor effects. The AlphaScreen technology provides several advantages over standard assay techniques such as ELISA, as it avoids time-consuming washing procedures and reduces plate handling. Furthermore, it is miniaturizable at least to a 384-well format and provides sensitivity down to the femtomolar range, dependent on the affinity of the antibodies included in the individual AlphaScreen SureFire assay kit. High sensitivity is reached by an intrinsic amplification mechanism, which involves production of singlet oxygen molecules. SureFire assay kits are commercially available for specific targets and include pairs of validated antibodies (PerkinElmer). This report describes common procedures applied for AlphaScreen SureFire assays and respective semi-automated steps for routine kinase inhibitor profiling in cell-based assays.The Rat-1 cell lines stably overexpressing activated PI3K class I isoforms Rat-1 pBABEpuro Myr-HA-hp110 delta (Rat-1_PI3Kdelta) and Rat-1 pBABEpuro Myr-HA-hp110alpha (Rat-1_PI3Kalpha) and Rat-1 pBABEpuro Myr-HA-hp110 beta (Rat-1_PI3beta) were prepared as described (Maira S M, Stauffer F, Brueggen J, Furet P, Schnell C, Fritsch C, Brachmann S, Ch ne P, de Pover A, Schoemaker K, Fabbro D, Gabriel D, Simonen M, Murphy L, Finan P, Sellers W, Garcia-Echeverria C (2008), Mol Cancer Ther. 7:1851-63 and Maira S M, Pecchi S, Brueggen J, Huh K, Schnell C, Fritsch C, Nagel T, Wiesmann M, Brachmann S, Dorsch M, Ch ne P, Schoemaker K, De Pover A, Menezes D, Fabbro D, Sellers W, Garcia-Echeverria C, Voliva CF (2011), Mol. Cancer Ther., accepted). All cell lines were cultivated in complete growth medium (DMEM high glucose, 10% (v/v) fetal bovine serum, 1% (v/v) MEM NEAA, 10 mM HEPES, 2 mM L-glutamine, puromycin (10 μg/mL for Rat-1_PI3Kdelta and Rat-1_PI3Kalpha, 4 ug/mL for Rat-1_PI3beta), 1% (v/v) Pen/Strep) to 90% confluency at 37° C./5% CO2/90% humidity in a humidified CO2 incubator and were split twice a week.The following materials were used for p-AKT(5473) detection in Rat-1 cell lysates: Dulbecco's modified Eagle's medium (DMEM) high glucose (Gibco Invitrogen, Basel, Switzerland, Cat. No. 41965), Heat Inactivated Fetal Bovine Serum, Qualified (HI FBS; Gibco Invitrogen, Basel, Switzerland, Lot. No. 16140), MEM non essential amino acids (NEAA; Gibco Invitrogen, Basel, Switzerland, Cat. No. 11140), HEPES (Gibco Invitrogen, Basel, Switzerland, Cat. No. 15630), Penicillin/Streptomycin (Pen/Strep, 100x; Gibco Invitrogen, Basel, Switzerland, Cat. No. 15140-122), L-Glutamine (Gibco Invitrogen, Basel, Switzerland, Cat. No. 25030), Puromycin (Sigma Aldrich, Buchs, Switzerland, Cat. No. P9620), DMSO (MERCK, Dietikon, Switzerland, Cat. No. 8.02912.2500), H2O, MilliQ-H2O unless otherwise stated (MILLIPORE QGARDOOR1, Millipore, Zug, Switzerland), Bovine serum albumine (BSA; Sigma Aldrich, Buchs, Switzerland Cat. No. A8412), SureFire p-Akt (Ser473) Assay Kit (PerkinElmer, Schwerzenbach, Switzerland, Cat. No. TGRAS50K).The p-Akt(5473) SureFire assay measures the phosphorylation of endogenous cellular Akt at Ser473 in cell lysates. Using Rat-1 cells stably expressing myr-HA-tagged versions of the human PI3Kdelta, PI3Kalpha, or PI3Kbeta p110 catalytic subunit isoforms, the assay was developed as a two-plate protocol in a 384-well format. For compound testing, the cells were seeded at a density of 4000 (Rat-1_PI3Kdelta), 7500 (Rat-1_PI3Kalpha).
- Inhibition of Specific Binding to the Rat NR1/NR2B Receptor The assay depends on the binding of a tracer to the GluN2B subunit-containing NMDA receptors and the ability of the test compounds to displace such binding. 3-[3H] 1-(azetidin-1-yl)-2-[6-(4-fluoro-3-methyl-phenyl)pyrrolo[3,2-b]pyridin-1-yl]ethanone is a high-affinity GluN2B-selective antagonist, which binds to the Ifenprodil binding site located at the interphase between GluN1 and GluN2B subunits. Alternatively, The assay measures binding affinity for ligands that compete for the Ifenprodil binding site in the native NMDA receptors from adult rat cortical membranes.In brief, rat adult cortex is homogenized in the assay buffer (50 mM Tris; pH 7.4). The resulting cortical membranes containing native NMDA receptors are purified by centrifugation and extensively washed, then re-suspended in the assay buffer. The test compounds, tracer and membranes are mixed together and incubated with shaking for 2 hours at room temperature to reach binding equilibrium. Non-specific binding of the tracer is determined by pre-incubation of brain membranes with 10 μM of CP 101,606. Following the incubation, the bound and unbound tracer is separated by filtration with cell harvester and GF/B filter plates (PerkinElmer) soaked with polyethylenimine.The extent of binding is measured by counting [3H] radioactivity retained on the filters plates with liquid scintillator counter. Binding affinity (equilibrium dissociation constant Ki) for the test compounds is determined by fitting experimental data with the following model log EC50=log(10^ log Ki*(1+[Radioligand]/HotKd)) and Y=Bottom+(Top-Bottom)/(1+10^(X-Log EC50)) where [Radioligand] is the concentration of the tracer, HotKdNM is the equilibrium dissociation constant of the tracer, Top and Bottom are the curve plateaus in the units of Y axis.HNR2BC: Effects of Test Articles on Cloned Human NR1/NR2B Ion Channels Expressed in Mammalian CellsNMDA receptors are ion channels that are highly permeable to Ca2+ ions, rendering it possible to monitor NMDA receptor function using cell-based calcium flux assay. In this assay, co-agonists glutamate and glycine are added to cells heterologously expressing human GluN1/GluN2B NMDA receptors to initiate cellular Ca2+ influx. The time course of the changes in intracellular calcium is measured using a fluorescent dye and a FLIPR (Fluorometric Imaging Plate Reader) device.Twenty four hours before measurements, the expression of the NMDA receptors in the stable cell line is induced with Tet-On inducible system in the presence of a non-selective NMDA receptor blocker. On the day of the experiment, cell culture media is carefully washed and the cells are loaded with Calcium 5 Dye Kit (Molecular Devices) in dye loading buffer containing 137 mM NaCl, 4 mM KCl, 2 mM CaCl2, 0.5 mM MgCl2, 10 mM HEPES and 5 mM D-glucose; pH 7.4. After 1 h incubation at the room temperature, the dye is washed away with the assay buffer (137 mM NaCl, 4 mM KCl, 2 mM CaCl2, 0.01 mM EDTA, 10 mM HEPES and 5 mM D-glucose; pH 7.4) In the FLIPR TETRA reader, various concentrations of the test compounds are added to the cells for 5 min while fluorescence is monitored to detect potential agonist activity. Next, co-agonists, glutamate and glycine are added for another 5 minutes. The concentration of glutamate corresponding to EC80 is used to maximize the assay's signal window and ability to detect NMDA receptor antagonists and negative allosteric modulators. A saturating concentration (10 μM) of glycine is also present in the assay. A non-selective NMDA receptor antagonist, (+)MK-801 is used as a positive control for antagonist activity. The fluorescent signal in the presence of test compounds is quantified and normalized to the signal defined by the appropriate control wells.
- Bioactivity Assay Human kidney embryonic cells HEK-293T were grown in a petri dish (diameter=10 cm) containing DMEM and 10% of bovine fetal serum culture solution, and incubated in an 5% of carbon dioxide-containing incubator at 37° C. Plasmids carrying human URAT1 were transfected to HEK-293T cells using TransIT-293 (Mirus Bio LLC). After 72 hours, the petri dish containing HEK-293T cells transfected with URAT1 was removed from the incubator and the cells were inoculated on Poly-D-Lysine Coated 96-well Plates at a density of 60,000 cells per well. After the cells on the 96-well plates were grown overnight (at least 12 hours) in an incubator at 37 degrees, these cells were gently rinsed 3 times with warm and no chloride ions-containing HBSS buffer (125 mM sodium gluconate, 4.8 mM potassium gluconate, 1.3 mM calcium gluconate, 1.2 mM monopotassium phosphate, 1.2 mM magnesium sulfate, 5.6 mM glucose, 25 mM HEPES, pH 7.4). 50 microliter of HBSS buffer (not containing chloride ions) containing 0.2 microcurie of 14C-uric acid and compounds of the present application or benzbromarone, and vector was added in each well, then the cell plates were put back to the incubator at 37 degrees. After 5 min, the buffer was removed from cell wells, added with 100 microliter of ice-cold and no chloride ions-containing HBSS buffer to gently rinse cells within wells so as to stop them from absorbing 14C-uric acid, the rinsing was repeated 3 times in the same manner. 150 microliter of cell lysate (100 mM of NaOH) was added in each well. Cell plate was placed on a vibrating plate and vibrated for 10 min at a speed of 600 rpm such that the cells were completely lysed. The cell plate was put in a centrifuge and spun for 5 min at a speed of 1000 rpm, then 45 microliter of supernatant was sucked out from each well and transferred to 96-well plate (Isoplate-96 Microplate from PerkinElmer).
- Cell-Based Assay of NHE-3 Activity (Pre-Incubation Inhibition) Rat and human NHE-3-mediated Na+-dependent H+ antiport was measured using a modification of the pH sensitive dye method originally reported by Paradiso (Proc. Natl. Acad. Sci. USA. (1984) 81(23): 7436-7440). PS120 fibroblasts stably expressing human NHE3 and NHERF2 were obtained from Mark Donowitz (Baltimore, Md.). Opossum kidney (OK) cells were obtained from the ATCC and propagated per their instructions. The rat NHE-3 gene (GenBank M85300) was introduced into OK cells via electroporation, and cells were seeded into 96 well plates and grown overnight. Medium was aspirated from the wells then incubated for 30 min at 37° C. with NH4Cl-HEPES buffer (20 mM NH4Cl, 80 mM NaCl, 50 mM HEPES, 5 mM KCl, 2 mM CaCl2, 1 mM MgCl2, pH 7.4) containing 5 μM BCECF-AM. Cells were washed once with Ammonium free, Na+-free HEPES (100 mM choline, 50 mM HEPES, 10 mM glucose, 5 mM KCl, 2 mM CaCl2, 1 mM MgCl2, pH 7.4) and incubated in the same buffer for 10 minutes at room temperature to lower intracellular pH with 0-30 μM test compound. After incubation, NHE-3-mediated recovery of neutral intracellular pH was initiated by addition of Na-HEPES buffer containing 0.4 μM ethyl isopropyl amiloride (EIPA, a selective antagonist of NHE-1 activity that does not inhibit NHE-3). Changes in intracellular pH were monitored using a FLIPR Tetra (Molecular Devices, Sunnyvale, Calif.) by excitation at λex 439 to 505 nm, and measuring BCECF fluorescence at λem 538 nm. The initial rate of the fluorescence ratio change was used as a measure of NHE-mediated Na+/H+ activity, and reported as the change in fluorescence ratio per minute. Initial rates were plotted as the average of 2 or more replicates, and pIC50 values were estimated using GraphPad Prism.
- Electrophysiological Assay The following patch voltage clamp electrophysiology studies were performed on representative compounds of the invention using human embryonic kidney cells (HEK), permanently transfected with an expression vector containing the full-length cDNA coding for the desired human sodium channel α-subunit, grown in culture media containing 10% FBS, 1% PSG, and 0.5 mg/mL G418 at 37° C. with 5% CO2. HEK cells used for the electrophysiology (EP) recordings had a passage number of less than 40 for all studies and were used within three days from the time of plating. Nav1.1, Nav1.5 and Nav1.6 cDNAs (NM_001165964 (SCN1A), NM_000335 (SCN5A) and NM_014191 (SCN8A), respectively) were stably expressed in HEK-293 cells.Sodium currents were measured using the patch clamp technique in the whole-cell configuration using either a PatchXpress automated voltage clamp or manually using an Axopatch 200B (Axon Instruments) or Model 2400 (A-M systems) amplifier. The manual voltage clamp protocol was as follows: Borosilicate glass micropipettes were fire-polished to a tip diameter yielding a resistance of 2-4 Mohms in the working solutions. The pipette was filled with a solution comprised of: 5 mM NaCl, 10 mM CsCl, 120 mM CsF, 0.1 mM CaCl2, 2 mM MgCl2, 10 mM HEPES, 10 mM EGTA; and adjusted to pH 7.2 with CsOH. The external solution had the following composition: 140 mM NaCl, 5 mM KCl, 2 mM CaCl2, 1 mM MgCl2, 10 mM HEPES; and adjusted to pH 7.4 with NaOH. In some studies, the external sodium was reduced by equimolar replacement with choline. Osmolarity in the CsF internal and NaCl external solutions was adjusted to 300 mOsm/kg and 310 mOsm/kg with glucose, respectively. All recordings were performed at ambient temperature in a bath chamber with a volume of 150 μL. Control sodium currents were measured in 0.5% DMSO. Controls and representative compounds of the invention were applied to the recording chamber through a 4-pinch or 8-pinch valve bath perfusion system manufactured by ALA Scientific Instruments.
- Evaluation of In Vitro Biological Activity The antagonist property of the compounds disclosed herein was determined using the FLIPR (fluorescence imaging plate reader) method, showing that the compounds are inhibitors for the intracellular calcium increase induced by the activation of hP2X3 (human purinergic P2X receptor subtype 3, Accession No. NM_002559.4) expressed in HEK293 cells (human renal epithelial cell line, ATCC). HEK293 cells that stably express hP2X3 were cultured in DMEM high glucose medium containing 10% FBS (fetal bovine serum, Gibco, 10099-141), 1% penicillin-streptomycin (Gibco, 15140-122) and 1 mg/mL G418 (Invitrogen, 10131027) in a cell incubator at 37 C., 5% humidity. Cells at 400,000 cells/mL were seeded into a 384-well plate (10,000 cells/well) 18-24 h prior to the FLIPR experiment and then incubated overnight in a cell incubator. On the day of the experiment, the medium was discarded and the cells were washed in an FLIPR buffer (each 30 mL buffer contains 0.3 mL of probenecid (Thermo, P36400), 0.6 mL of 1 M HEPES (Invitrogen, 15630080) and 29.1 mL of HBSS (Invitrogen, 14065056)). Each well was added with 20 μL of 0.5 Calcium 6 fluorescent dye (Molecular Devices, R8190) and then was subjected to dye-loading incubation at 37 C. for 1.5 h. Each well was added with 10 μL of test compound (which was dissolved in DMSO at a concentration of 10 mM and serially diluted with buffer) or vehicle, and then was left to equilibrate for 30 min at room temperature. The cell plate was then placed in the FLIPR for baseline fluorescence measurements (excitation at 485 nm and emission at 525-535 nm). An agonist (BZ-ATP (Sigma, B6396) at a final concentration of 2.5 μM) or a vehicle (ultrapure water) was then added at 10 μL/well, fluorescence values were measured for 2 min at 1-second intervals, and finally the output fluorescence counts were analyzed.
- Heat-Based Assay CHO cells stably expressing human TRPV1 (hTRPV1) were used. Functional assessment of heat-induced activation of hTRPV1 was carried out in a cell-based Ca2+ flux assay using ABI7500 Fast Real-Time PCR System as described in Reubish et al., "Functional assessment of temperature-gated ion-channel activity using a real-time PCR machine," www.BioTechniques.com 47(3):iii-ix (2009), which is hereby incorporated by reference. Briefly, hTRPV1/CHO cells were cultured in growth media in a tissue culture dish at 37° C. in a CO2 incubator. On the day of the assay, culture media were removed and the cells were then detached using 0.05% trypsin at 37° C. with 5% CO2, for 90 s. The detached cells were centrifuged (1000 rpm, 4 min) to remove trypsin-containing supernatant and resuspended in assay buffer (115 mM NaCl, 5.4 mM KCl, 0.8 mM MgCl2.6H2O, 1.8 mM CaCl2.2H2O, 13.8 mM D-glucose, and 20 mM HEPES). Then, the cells were loaded with 5 μM Fluo-4, a Ca2+ reporter dye, in the presence of 2.5 mM probenecid at 37° C. with 5% CO2, for 45 min. Thereafter, the cells were washed twice with measuring buffer (assay buffer supplemented with 0.1% BSA and 3.2 mM CaCl2) then transferred to a Fast 96-well Reaction Plate (0.1 mL) (Part no. 4346907, MICROAMP, Applied Biosystems, Foster City, Calif.). The cell density was 100,000 cells/24 μL/well. A solution of the compound under test (6 μL/well) was added into each well of the 96-well plate. Thus, the reaction volume per well was 30 μL. The plates were then placed inside an ABI7500 Fast Real-Time PCR instrument (Applied Biosystems) to read fluorescence at different temperatures using 7500 software, version 2.0.2 (Applied Biosystems). The initial temperature was set at 25° C. for 1 min. followed by a temperature ramp to 45° C. in 100 s to deliver heat to cells.
- In Vitro Assay (FLIPR) The assay buffer was formulated by removing 120 mL from a 1 L bottle of fresh, sterile dH2O (Mediatech, Herndon, Va.) and adding 100 mL of 10×HBSS that does not contain Ca++ or Mg++ (Gibco, Invitrogen, Grand Island, N.Y.) followed by 20 mL of 1.0 M Hepes, pH 7.3 (Fisher Scientific, BP299-100). The final buffer consisted of 20 mM Hepes, pH 7.3, 1.261 mM CaCl2, 0.493 mM MgCl2, 0.407 mM Mg(SO)4, 5.33 mM KCl, 0.441 mM KH2PO4, 137 mM NaCl, 0.336 mM Na2HPO4 and 0.556 mM D-glucose (Hanks et al., Proc. Soc. Exp. Biol. Med. 71:196 (1949)), and the simple formulation was typically the basic buffer throughout the assay (i.e., all wash and addition steps). The fluorescence indicator used in the primary fluorescence assay was the cell permeant version of CoroNa Green (Invitrogen, Molecular Probes, Eugene, Oreg.), a dye that emits light in the fluorescence range (Harootunian et al., J. Biol. Chem. 264(32):19458-19467 (1989)). The intensity of this emission, but not the wavelength range, is increased when the dye is exposed to Na+ ions, which it can bind with partial selectivity. Cells expressing Nav1.7 or other sodium channels were loaded with the CoroNa Green dye immediately in advance of the fluorescence assay, and then, after agonist stimulation, the mobilization of Na+ ions was detected as the Na+ ions flowed from the extracellular fluid into the cytoplasm through the activated sodium channel pores. The dye was stored in the dark as a lyophilized powder, and then an aliquot was dissolved immediately before the cell loading procedure, according to the instructions of the manufacturer, to a stock concentration of 10 mM in DMSO. It was then diluted in the assay buffer to a 4× concentrated working solution, so that the final concentration of dye in the cell loading buffer was 5 μM.
- In Vitro Assay (MP) The assay buffer was formulated by removing 120 mL from a 1 L bottle of fresh, sterile dH2O (Mediatech, Herndon, Va.) and adding 100 mL of 10×HBSS that does not contain Ca++ or Mg++ (Gibco, Invitrogen, Grand Island, N.Y.) followed by 20 mL of 1.0 M Hepes, pH 7.3 (Fisher Scientific, BP299-100). The final buffer consisted of 20 mM Hepes, pH 7.3, 1.261 mM CaCl2, 0.493 mM MgCl2, 0.407 mM Mg(SO)4, 5.33 mM KCl, 0.441 mM KH2PO4, 137 mM NaCl, 0.336 mM Na2HPO4 and 0.556 mM D-glucose (Hanks et al., Proc. Soc. Exp. Biol. Med. 71:196 (1949)), and the simple formulation was typically the basic buffer throughout the assay (i.e., all wash and addition steps). The fluorescence indicator used in the primary fluorescence assay was the cell permeant version of CoroNa Green (Invitrogen, Molecular Probes, Eugene, Oreg.), a dye that emits light in the fluorescence range (Harootunian et al., J. Biol. Chem. 264(32):19458-19467 (1989)). A fluorescence indicator that can be used in alternative fluorescence assays is the blue version membrane potential dye (MDS, Molecular Devices, Sunnyvale, Calif.), a dye that detects changes in molecules following a change in membrane potential. An increase in fluorescence is expected if agonist stimulation provokes a change in membrane potential. Cells expressing Nav1.7 or other sodium channels are incubated with the membrane potential dye 30-60 minutes before the fluorescence assay. In the case of the KCl pre-stimulation version of the assay, the dye and all other components are washed out immediately before the assay, and the dye is then replaced. In the version lacking KCl pre-stimulation, the dye remains on the cells and is not washed out or replaced. The dye is stored in the dark as a lyophilized powder, and then an aliquot dissolved in assay buffer to form a 20×-concentrated stock solution that can be used for several weeks.
- In Vitro Assay (Protocol 1) Compounds of Formula (I), were diluted in eight concentrations in the extracellular solution composed of physiological saline, buffered with HEPES (mM): NaCl, 137; KCl, 4; CaCl2, 3.8; MgCl2, 1; HEPES, 10; Glucose, 10; pH 7.4. The extracellular solution is composed of (mM) CsCl, 50; CsF, 90; MgCl2, 5; EGTA, 5; HEPES, 10; pH 7.2. The duration of exposure of each compound with the cells expressing Nav 1.7 or Nav 1.8 was at least five minutes and the assays were performed at room temperature.The measurements of the sodium currents of Nav 1.8 and Nav 1.7 were obtained using the voltage protocols described below:Protocol 1: A holding voltage of −90 mV was established followed by a voltage phase of 200 ms to −120 mV, followed by a voltage step of 10 mV for 1 second for Nav 1.8 or 0 mV for Nav 1.7, followed by a step of −100 mV for 20 ms, followed by a step of 20 ms for 10 mV for Nav 1.8 or 0 mV for Nav 1.7 (TP1A) before returning to the holding voltage of −90 mV.Protocol 2: A holding voltage of −100 mV was established followed by an inactivation voltage step at −40 mV for 8 seconds, followed by a −100 mV step for ms, followed by a 20 ms step for 10 mV for Nav 1.8 or 0 mV for Nav 1.7 (TP1A) before returning to the holding voltage of −100 mV.Protocols were repeated at a frequency of 0.1 Hz and current amplitude was quantified over the TP1A phase log. The variation in the peak amplitude of the current was evaluated according to the Formula described below, after exposure of the cells expressing the channels, at each concentration of the different compounds:%Block=(1-(ITP1A,molecule/ITP1A,basal)×100%,where |TP1A, basal, and |TP1A, molecule represent the entry peaks of sodium currents into TP1A prior to exposure to the compound and in the presence of the compound, respectively.
- In Vitro Assay (Protocol 2) Compounds of Formula (I), were diluted in eight concentrations in the extracellular solution composed of physiological saline, buffered with HEPES (mM): NaCl, 137; KCl, 4; CaCl2, 3.8; MgCl2, 1; HEPES, 10; Glucose, 10; pH 7.4. The extracellular solution is composed of (mM) CsCl, 50; CsF, 90; MgCl2, 5; EGTA, 5; HEPES, 10; pH 7.2. The duration of exposure of each compound with the cells expressing Nav 1.7 or Nav 1.8 was at least five minutes and the assays were performed at room temperature.The measurements of the sodium currents of Nav 1.8 and Nav 1.7 were obtained using the voltage protocols described below:Protocol 1: A holding voltage of −90 mV was established followed by a voltage phase of 200 ms to −120 mV, followed by a voltage step of 10 mV for 1 second for Nav 1.8 or 0 mV for Nav 1.7, followed by a step of −100 mV for 20 ms, followed by a step of 20 ms for 10 mV for Nav 1.8 or 0 mV for Nav 1.7 (TP1A) before returning to the holding voltage of −90 mV.Protocol 2: A holding voltage of −100 mV was established followed by an inactivation voltage step at −40 mV for 8 seconds, followed by a −100 mV step for ms, followed by a 20 ms step for 10 mV for Nav 1.8 or 0 mV for Nav 1.7 (TP1A) before returning to the holding voltage of −100 mV.Protocols were repeated at a frequency of 0.05 Hz and current amplitude was quantified over the TP1A phase log. The variation in the peak amplitude of the current was evaluated according to the Formula described below, after exposure of the cells expressing the channels, at each concentration of the different compounds:%Block=(1-(ITP1A,molecule/ITP1A,basal)×100%,where |TP1A, basal, and |TP1A, molecule represent the entry peaks of sodium currents into TP1A prior to exposure to the compound and in the presence of the compound, respectively.
- In Vitro Assay In vitro URAT1 assay can be used to identify compounds having potential activity for decreasing serum uric acid. In a suitable test, the vectors that encode human URAT1 (URAT1 cDNA: Guangzhou Copoeia EX-T4563-M02) were used to transfect cells (human embryonic kidney cells, HEK293: Cell Bank of the Chinese Academy of Sciences, GNHu18). The transfected cells HEK293/hURAT1 cells were obtained, then their uptake ability of radiolabeled uric acid was determined. The activity of the compounds as URAT1 inhibitors can be evaluated by the ability of the compounds to block the uptake of uric acid in the transfected cells.The HEK293/hURAT1 cells in Eagle's minimal essential medium (EMEM) were inoculated in a 48-well plate that was coated with poly-D-lysine (Becton Dickinson, Catalog No. 356509), with an inoculation density of 105 cells/well, and incubated overnight. A reaction solution containing 14C uric acid (American Radioactive Compound, Catalog No. ARC 0513A) with a final concentration of 11.57 μM was prepared by the use or non-use of the test compounds in Hanks balanced salt solution (HBSS). The Hanks balanced salt solution (HBSS) contained 125 mM sodium gluconate, 4.8 mM potassium gluconate, 1.2 mM potassium dihydrogen phosphate, 1.2 mM magnesium sulfate, 1.3 mM calcium gluconate, 5.6 mM glucose and 25 mM HEPES (pH 7.3). After the medium was washed with the wash buffer (125 mM sodium gluconate, 10 mM HEPES, pH 7.3) for one time, the reaction solution prepared from the above step was added to each well and incubated at room temperature for 12 minutes. Then the reaction solution was removed, the cells were washed twice with the wash buffer and lysed with 0.2 M NaOH for 5 minutes. The cell lysate was transferred to a 96-well culture plate with a scintillation fluid (PerkinElmer, Catalog No. 1450-401), and counting of radioactivity was carried out on a Microbeta counter (PerkinElmer).
- Lactate Transport in MCT4-Expressing MDA-MB-453 Breast Cancer Cells (Assay 1) MCT4 may be stably expressed in MDA-MB-453 breast cancer cells that do not express native MCT1 or MCT4. MCT4 activity may be assessed by monitoring the intracellular pH change that accompanies lactate/proton symport, using the pH-sensitive fluorescent dye 2′,7′-bis-(carboxyethyl)-5(6)-carboxyfluorescein (BCECF), in a manner similar to that previously reported for MCT1 and MCT4. The following is an exemplary procedure for assaying MCT4 activity of the compounds of Formula (I).Preparing BCECF-Loaded Cells:Cells (˜7×10⁶) are trypsinized (0.05% Trypsin-EDTA), pelleted (300 g, 5 min), and resuspended in 1 mL Tyrode's Solution, pH 7.4 (119 mM NaCl, 5 mM KCl, 25 mM HEPES, pH 7.4, 2 mM CaCl2), 2 mM MgCl2, 6 g/L glucose). 10 μL of a 30 mM DMSO stock of BCECF-AM ester (Life Technologies) is added and the cells are incubated at 37° C. for 5 min. The cells are pelleted (300 g, 5 min), washed once with 1 mL Tyrode's Solution, pH 7.4, re-pelleted (300 g, 5 min), and resuspended in 1 mL Tyrode's Solution, pH 7.4.Lactate Transport Assay:2.5 μL BCECF-loaded cells, along with either 10 μL DMSO or 100×compound in DMSO, are added to 937.5 μL of Tyrode's Solution in a quartz 1.0 mL cuvette (PerkinElmer, B0631116). Fluorescence measurements are performed on a PerkinElmer LS55 fluorescence spectrometer with dual excitation wavelengths achieved using a filter wheel (FL Winlab program: Fast Filter; Excitation 490/440; Emission 535). After establishing baseline BCECF fluorescence (around 10-20 s), 50 μL of 1 M sodium L-lactate (Sigma-Aldrich) is added to the cuvette (final concentration: 50 mM) and rapidly mixed. The time-dependent decrease in BCECF fluorescence (490/440 ratio) may be fit to an exponential decay curve (Prism GraphPad) to determine the rate of lactate transport.
- Ligand Binding Assay (LBA) hNaV1.7 binding affinities were determined with a filtration binding assay using purified membranes from HEK293 cells stably expressing hNaV1.7. HEK293 cells from a 10-stack cell culture flask (approximately 1010 cells) were dissociated, frozen, and stored at −80° C. To prepare membranes, the frozen cell pellet was thawed and suspended in 6 ml hypotonic lysis buffer (50 mM HEPES, 0.1% mammalian protease inhibitor cocktail). 1 ml of resuspended cells was added to an additional 6 ml of lysis buffer and homogenized with 30 strokes of a tight pestle in a glass homogenizer. Homogenate was centrifuged at 1000×g for 10 minutes at 4° C. and the resulting supernatant was further centrifuged at 38,500×g for 60 minutes at 4° C. The resulting pellet was resuspended in binding buffer (50 mM HEPES, 130 mM NaCl, 5.4 mM KCl, 0.8 mM MgCl2, 5 mM glucose, pH 7.4) and needle homogenized with a 25 gauge needle. Protein concentration was determined with a BCA protein assay. Purified membranes were aliquoted, flash frozen in an ethyl alcohol dry ice bath, and stored at −80° C. To measure displacement of a radiolabeled ligand, 50 μg of purified hNaV1.7 HEK cell membranes were incubated with test compounds (eight concentrations, in duplicate) and 0.5 nM [3H] labeled radioligand in a 96 well plate for 24 hours at room temperature on a shaker. The total binding reaction volume was 250 μl, consisting of 200 μl purified hNaV1.7 HEK cell membranes, 25 μl test compound, and 25 μl radioligand. Non-specific binding was defined by 20 μM of a reference hNaV1.7 inhibitor. Binding reactions were terminated by filtration through GF/B filters presoaked in 0.5% polyethyleneamine. Filters were washed 5 times with 2 ml each of 4′C wash buffer (50 mM Tris-HCl, pH 7.4 at 4° C.). Bound radioactivity captured on the filters was counted on a liquid scintillation counter. Specific binding, expressed as % inhibition, was fit with Graphpad Prism software to determine binding IC50 values.
- Ligand Binding Assay (LBA) hNaV1.7 binding affinities were determined with a filtration binding assay using purified membranes from HEK293 cells stably expressing hNaV1.7. HEK293 cells from a 10-stack cell culture flask (approximately 1010 cells) were dissociated, frozen, and stored at −80° C. To prepare membranes, the frozen cell pellet was thawed and suspended in 6 ml hypotonic lysis buffer (50 mM HEPES, 0.1% mammalian protease inhibitor cocktail). 1 ml of resuspended cells was added to an additional 6 ml of lysis buffer and homogenized with 30 strokes of a tight pestle in a glass homogenizer. Homogenate was centrifuged at 1000×g for 10 minutes at 4° C. and the resulting supernatant was further centrifuged at 38,500×g for 60 minutes at 4° C. The resulting pellet was resuspended in binding buffer (50 mM HEPES, 130 mM NaCl, 5.4 mM KCl, 0.8 mM MgCl2, 5 mM glucose, pH 7.4) and needle homogenized with a 25 gauge needle. Protein concentration was determined with a BCA protein assay. Purified membranes were aliquoted, flash frozen in an ethyl alcohol dry ice bath, and stored at −80° C. To measure displacement of a radiolabeled ligand, 50 μg of purified hNaV1.7 HEK cell membranes were incubated with test compounds (eight concentrations, in duplicate) and 0.5 nM [3H] labeled radioligand in a 96 well plate for 24 hours at room temperature on a shaker. The total binding reaction volume was 250 μl, consisting of 200 μl purified hNaV1.7 HEK cell membranes, 25 μl test compound, and 25 μl radioligand. Non-specific binding was defined by 20 μM of a reference hNaV1.7 inhibitor. Binding reactions were terminated by filtration through GF/B filters presoaked in 0.5% polyethyleneamine. Filters were washed 5 times with 2 ml each of 4° C. wash buffer (50 mM Tris-HCl, pH 7.4 at 4° C.). Bound radioactivity captured on the filters was counted on a liquid scintillation counter. Specific binding, expressed as % inhibition, was fit with Graphpad Prism software to determine binding IC50 values.
- Measuring Inhibition of the TRPA1 Ion Channel Compounds of Formula (I) inhibit the TRPA1 channel, as shown by measuring the in vitro inhibition of human TRPA1, provided in data tables shown in Table 2, using the procedure outlined in del Camino et al., The Journal of Neuroscience, 30(45):15165-15174 (Nov. 10, 2010), incorporated herein by reference and summarized below. Data for TRPA1 inhibition was obtained by this method for the indicated compounds of Formula (I), with the relevant data included in Table 2 below. All currents were recorded in whole-cell configuration using EPC-9 and EPC-10 amplifiers and Patchmaster software (HEKA) or similar. Patch pipettes had a resistance of 1.5-3 M and up to 75% of the series resistance was compensated. The standard pipette solution consisted of 140 mM CsAsp, 10 mM EGTA, 10 mM HEPES, 2.27 mM, 20 MgCl2, 1.91 mM CaCl2, and up to 0.3 mM Na2GTP, with pH adjusted to 7.2 with CsOH. In addition, a solution containing 145 mM CsCl, 10 mM HEPES, 10 mM EGTA, and up to 0.3 mM Na2GTP and 1 mM MgCl2 (pH 7.2 adjusted with CsOH) can be used. The standard bath solution contained 150 mM NaCl, 10 mM HEPES, 10 mM glucose, 4.5 mM KCl, 1 mM EGTA, 3 mM MgCl2, with pH adjusted to 7.4 with NaOH. In some instances, 2 mM CaCl2 was added in place of EGTA and the concentration of MgCl2 was reduced to 1 mM.Data were collected either by continuous recordings at −60 mV or by applying voltage ramps from a holding potential of −40 mV every 4 s. Continuous recordings were collected at 400 Hz and digitally filtered off-line at 10 Hz for presentation. Voltage ramps were applied from −100 mV or −80 mV to +100 mV or +80 mV over the course of 400 ms, and data were collected at 10 kHz and filtered at 2.9 kHz. Inward and outward currents were analyzed from the ramps at −80 and 80 mV, respectively. Liquid junction potential correction was not used.
- Mu-Opioid Receptor Activity Assay Human or mouse MOR cDNA was transfected alongside GαoB with RLuc8 inserted at position 91 (GαoB-RLuc8), Gβ1 (β1), and Gγ2 fused to the full-length mVenus at its N terminus (mVenus γ2) into HEK-293T cells (5×10⁶ cells/plate) in 10-cm dishes using PEI (Polysciences Inc.; Warrington, PA) in a 1:1 ratio diluted in Opti-MEM (Life Technologies Corp.; Grand Island, NY) to assay for G protein activation as described previously (Rives, M.-L. et al. J. Biol. Chem. 2012, 287, 27050-4; Negri, A.; Rives, M.-L.; Caspers, M. J. et al. J. Chem. Inf. Model. 2013, 53, 521-526). Cells were maintained in the Dulbecco's Modified Eagle Medium (high glucose #11965; Life Technologies) supplemented with 10% FBS (Premium Select, Atlanta Biologicals; Atlanta, GA) and 100 U/mL penicillin and 100 μg/mL streptomycin (#15140, Life Technologies). After 24 hours the media was changed, and the experiment was performed 24 hours later (48 hours after transfection). BRET. Transfected cells were dissociated and resuspended in phosphate-buffered saline (PBS). Approximately 200,000 cells/well were added to a black-framed, white well 96-well plate (#60050; Perkin Elmer; Waltham, MA). The microplate was centrifuged and the cells were resuspended in PBS. Then 5 μM of the luciferase substrate coelenterazine H was added to each well for 5 minutes. Following coelenterazine H addition, ligands were added and the BRET signal was measured at 5 minutes on a PHERAstar FS plate reader. Quantification of the BRET signal required calculating the ratio of the light emitted by the energy acceptor, mVenus (510-540 nm), over the light emitted by the energy donor, RLuc8 (485 nm). This drug-induced BRET signal was normalized using the Emax of DAMGO as the 100% maximal response for G protein activation. Dose response curves were fit using three-parameter logistics equation in GraphPad Prism 6.
- URAT1-Model Assay HEK293 human embryonic kidney cells (ATCC #CRL-1573) were propagated in EMEM tissue culture medium as described by ATCC in an atmosphere of 5% C02 and 95% air. Transfections of HEK293 cells with a model URAT1 construct was performed using L2000 transfection reagent (Invitrogen) as described by the manufacturer. After 24 h the transfected cells were split into 10 cm tissue culture plates and grown for 1 day after which the medium was replaced with fresh growth medium containing G418 (Gibco) at 0.5 mg/ml final concentration. Drug-resistant colonies were selected after approximately 8 days and then tested for 14C-uric acid transport activity. The HEK293/URAT1-model cells are plated on Poly-D-Lysine Coated 96-well Plates at a density of 125,000 cells per well.Cells were grown overnight (20-26 hours) at 37° C. in an incubator. Plates were allowed to come to room temperature and media was washed out with one wash of 250 μl of Wash Buffer (125 mM Na Gluconate, 10 mM Hepes ph 7.3). Compound or vehicle is added in assay buffer with 14C-uric acid for a final concentration of 125 μM Uric Acid with a specific activity of 54 mCi/mmol. Assay Buffer is 125 mM Sodium Gluconate, 4.8 mM Potassium Gluconate, 1.2 mM Potassium phosphate, monobasic, 1.2 mM magnesium sulfate, 1.3 mM Ca Gluconate, 5.6 mM Glucose, 25 mM HEPES, pH 7.3. Plates were incubated at room temperature for 10 minutes then washed 3 times with 50 μl Wash Buffer and 3 times with 250 μl Wash Buffer. Microscint 20 Scintillation Fluid was added and plates were incubated overnight at room temperature to equilibrate. Plates are then read on the TopCount Plate Reader and an EC50 value generated. (See Enomoto et al, Nature, 2002, 417, 447-451 and Anzai et al, J. Biol. Chem., 2004, 279, 45942-45950.).
- URAT1-Model Assay HEK293 human embryonic kidney cells (ATCC# CRL-1573) were propagated in EMEM tissue culture medium as described by ATCC in an atmosphere of 5% CO2 and 95% air. Transfections of HEK293 cells with a model URAT1 construct was performed using L2000 transfection reagent (Invitrogen) as described by the manufacturer. After 24 h the transfected cells were split into 10 cm tissue culture plates and grown for 1 day after which the medium was replaced with fresh growth medium containing G418 (Gibco) at 0.5 mg/ml final concentration. Drug-resistant colonies were selected after approximately 8 days and then tested for 14C-uric acid transport activity. The HEK293/URAT1-model cells are plated on Poly-D-Lysine Coated 96-well Plates at a density of 125,000 cells per well.Cells were grown overnight (20-26 hours) at 37° C. in an incubator. Plates were allowed to come to room temperature and media was washed out with one wash of 250 μl of Wash Buffer (125 mM Na Gluconate, 10 mM Hepes ph 7.3). Compound or vehicle is added in assay buffer with 14C-uric acid for a final concentration of 12504 Uric Acid with a specific activity of 54 mCi/mmol. Assay Buffer is 125 mM Sodium Gluconate, 4.8 mM Potassium Gluconate, 1.2 mM Potassium phosphate, monobasic, 1.2 mM magnesium sulfate, 1.3 mM Ca Gluconate, 5.6 mM Glucose, 25 mM HEPES, pH 7.3. Plates were incubated at room temperature for 10 minutes then washed 3 times with 50 μl Wash Buffer and 3 times with 250 μl Wash Buffer. Microscint 20 Scintillation Fluid was added and plates were incubated overnight at room temperature to equilibrate. Plates are then read on the TopCount Plate Reader and an EC50 value generated. (See Enomoto et al, Nature, 2002, 417, 447-451 and Anzai et al, J. Biol. Chem., 2004, 279, 45942-45950.)
- YFP-Halide Influx Assay YFP-Halide Influx Assay for the CFTR-ΔF508 Mutation and Suppressor mutants (I539T or G550E)The YFP halide influx assay measures the functionality of the Cystic Fibrosis Transmembrane Conductance regulator (CFTR) channels in the cystic fibrosis bronchial epithelium cell line CFBE4lo−. The fluorescence of the yellow fluorescent protein (YFP) variant YFP H148Q, I152L or variant YFP H148Q, I152L & F47L is substantially quenched by iodine, a halide that is efficiently transported by CFTR. The assay is thus used to evaluate the effect of corrector compounds on CFTR channel function by measuring the extent of YFP signal quenching. (Galietta et al. American Journal of Physiology Cell Physiology Vol. 281 no. 5, C1734-C1742, 2001; Nagai et al., Nat Biotechnol. 2002 January; 20(1):87-90.)For this purpose, HEK293 cells are transfected with plasmid DNA containing F508del CFTR, F508del/I539T CFTR or F508del/G550E CFTR and seeded in 96 well plates (70,000 HEK cells/well). The next day, cells are treated with test compounds.Cells are treated with test compounds for 24 h at 37° C. to allow trafficking of corrected CFTR to the membrane.The next day the CFTR channels are activated by treatment with the cAMP inducer forskolin (10.67 μM) and potentiator GLPG1837 (0.5 μM) in 1×D-PBS (from Gibco, Cat n#14090-091) for 20 minutes prior to addition of an I− solution (137 mM NaI, 2.7 mM KI, 1.76 mM KH2PO4, 10.1 mM Na2HPO4, 5 mM glucose). The I− induced quenching of fluorescence is recorded immediately after injection of for 7 seconds. The capacity of a compound to increase number of channels, and therefore overall halide influx is directly correlated with the decrease in fluorescence, and is expressed as (1−(fluorescence after 7 seconds (F)/fluorescence before injection (F0))) and an EC50 can be derived from a (1-F/F0) vs compound concentration plot.
- hSERT and rVMAT2 Fluorometric Screening Assay For both hSERT and rVMAT2 screening experiments, respective singly transfected cells were seeded at a density of 0.09×10⁶ cells/well in poly-D-Lysine (Alamanda Polymers, Inc.) coated white solid-bottom 96-well plates (Costar). Growth was permitted for approximately 44 hours in said aqueous media and at an incubation environment of 37° C. and 5% Carbon Dioxide. At the beginning of the experiment, the cellular growth solution was aspirated, and individual cells were rinsed with 150 μL of 1×Dulbecco's Phosphate Buffered Saline (PBS; HyClone). 63 μL of Experimental Media (consisting of the following contents: DMEM without phenol red but with 4.5 g/L of D-Glucose (Gibco), 1% (v/v) FBS (Atlanta Biologicals), 100 U/mL Penicillin (Gibco), and 10 μg/mL Streptomycin (Gibco)) with 2×tiered concentrations of inhibitor (or DMSO, the vehicle of these experiments) were added to the respective wells. Control inhibitors used in these studies include Imipramine for hSERT experiments, and Reserpine for rVMAT2 experiments (Eiden, L. E. and Weihe, E. 2011; Sette, M. et al. 1983). At the conclusion of the pre-incubation period (60 minutes for hSERT experiments and 30 minutes for rVMAT2 experiments), 63 μL of Experimental Media containing 2×various concentrations of tested inhibitor (or vehicle) along with a specified amount of fluorescent substrate, APP+ (Karpowicz, R. J. et al 2013) (final concentration: 1.1 μM for hSERT experiments) or FFN206 (Hu, G. et al. 2013) (final concentration: 0.75 μM for rVMAT2 experiments) were added to the present solution contained within the wells. After a required incubation period (30 minutes for hSERT experiments and 60 minutes for rVMAT2 experiments) for proper fluorescent probe uptake, the contents of each well were aspirated and consequently, rinsed twice with 120 μL of PBS. A final solution of 120 μL of PBS is finally added to all corresponding wells for cell maintenance before undergoing fluorescence uptake reading by a BioTek H1MF plate reader.
- thallium-flux assay The thallium flux assay is an in vitro method of measuring conductance through a potassium ion channel. Potassium channels are also permeable to thallium ions. The modulation of a K+ channel will thus increase or decrease thallium ion flow through the channel and thus, alter the observed fluorescence of a thallium-specific indicator dye.Stably transfected T-Rex-HEK-293-AnKir1 cells were cultured overnight in 384-well plates in media containing DMEM, 10% dialyzed FBS, and 1 μg/mL tetracycline to induce channel expression. The next day the cell culture medium was replaced with a dye-loading solution containing assay buffer (Hanks Balanced Salt Solution with 20 mM HEPES, pH 7.3), 0.01% (w/v) Pluronic F-127 (Life Technologies, Carlsbad, Calif.), and 1.2 μM of the thallium-sensitive dye Thallos-AM (TEFlabs, Austin, Tex.). After 1 hr incubation at room temperature, the dye-loading solution was washed from the plates and replaced with 20 μL/well of assay buffer. The plates were transferred to a Hamamatsu Functional Drug Screening System 6000 (FDSS6000; Hamamatsu, Tokyo, Japan), where 20 μL/well of each of the test compounds in assay buffer was added and allowed to incubate with the cells for 20 min. After incubation, a baseline recording was collected at 1 Hz for 10 s (excitation 470±20 nm, emission 540±30 nm); a thallium stimulus buffer was then added (10 μL/well), and data were then collected for an additional 4 min. The Tl+ stimulus buffer contained (in mM): 125 NaHCO3, 1.8 CaSO4, 1 MgSO4, 5 glucose, 12 Tl2SO4, 10 HEPES, pH 7.4. For Tl+ flux assays on Kir2.x, Kir4.1 and Kir6.2/SUR1 expressing cells, the Tl+ stimulus buffer contained 1.8 mM Tl2SO4. To ensure the small-molecule vehicle DMSO had no direct effect on AnKir1-dependent Tl+ flux, the assay's tolerance to different doses of DMSO was evaluated. The robustness and reproducibility of the assay was determined by comparing Tl+ flux through tetracycline-induced and tetracycline-free cells.
- Activity Assay The HEK293 cells having human Cav3.2 stably expressed therein were cultured at 37° C. in Alpha-MEM, to which 10% (v/v) fetal bovine serum (FBS), penicillin (100 U/mL), streptomycin (100 μg/mL), and G418 (250 g/mL) had been added. The cells were suspended in the culture liquid and were inoculated onto a 96-well plate. Subsequently, the cells were cultured for 48 hours. The culture liquid was removed, and the liquid was changed to S-MEM, to which 5% (v/v) FBS, calcium chloride (0.5 mmol/L), L-glutamine (2 mmol/L), L-alanine (8.9 ng/mL), L-asparagine (13.2 ng/mL), L-aspartic acid (1.33 ng/mL), L-glutamic acid (14.7 ng/mL), glycine (7.5 ng/mL), L-proline (11.5 ng/mL, L-serine (10.5 ng/mL), penicillin (100 U/mL), and streptomycin (100 μg/mL) had been added. The cells were cultured for another 24 hours. The culture liquid was removed again, and the cells were washed with an assay buffer (140 mmol/L sodium chloride, 5 mmol/L potassium chloride, 0.5 mmol/L magnesium chloride, 0.5 mmol/L calcium chloride, 10 mmol/L glucose, 0.4 mmol/L magnesium sulfate, 10 mmol/L HEPES, and 250 mol/L sulfinpyrazone, pH 7.4) that had been kept warm at 37° C. Subsequently, an assay buffer prepared by dissolving Fura2-AM, which is a fluorescent Ca2+ indicator, to a concentration of 5 μM, was added to the cells, and the system was incubated for 30 minutes at 37° C. The assay buffer having Fura2 dissolved therein was removed, and the cells were washed with the assay buffer. Subsequently, an assay buffer prepared by adding a test compound was added to the cells, and the system was incubated for 15 minutes. The plate was mounted on a fluorescence analyzer (FLEX STATION II, Molecular Devices, LLC), and the baseline was measured for 20 seconds. Subsequently, any change in the intracellular calcium concentration that was induced when an assay buffer prepared by adding 100 mmol/L calcium chloride was added to the cells, was measured (excited at 340 nm or 380 nm, and detected at 510 nm).
- Calcium Flux Assay An in vitro assay was used to determine the potency of test compounds as inhibitors of the glutamate response of the channel formed by GluA1o-γ8. To ensure a 1:1 stoichiometry of GluA1o and γ8 subunits in the expressed channel, a fusion of the cDNAs for GRIA1o and CACNG8 was used. Following Shi et al (2009) The stoichiometry of AMPA receptors and TARPs varies by neuronal cell type. Neuron 62(5): 633-640), the C-terminus of the cDNA for GRIA1o was fused to the N-terminus of the cDNA for γ8. The linker sequence was QQQQQQQQQQEFAT. Channels expressed with this construct appear to have similar properties to channels formed by co-expression of GRIA1o with an excess of CACNG8 (Shi et al. 2009). A clonal cell line in HEK293 cells stably expressing this construct, with a geneticin selection marker, was generated for use in this assay.Cell expressing the GRIA1o-CACNG8 fusion construct were grown in a monolayer in 96- or 384-well microtiter plates. They were washed with assay buffer (135 mM NaCl, 4 mM KCl, 3 mM CaCl2, 1 mM MgCl2, 5 mM glucose, 10 mM HEPES, pH 7.4, 300 mOs) using a Biotek EL405 plate washer. The cells were then loaded with a calcium-sensitive dye (Calcium-5 or Calcium-6, Molecular Devices) and the test compounds at a range of concentrations. Calcium flux following the addition of 15 μM glutamate was monitored using a Molecular Devices FLIPR Tetra. The fluorescence in each well was normalized to the fluorescence of negative and positive control wells. The negative control wells had no added compounds, and the positive control wells had been incubated with 10 μM CP465022 (a non-subtype-selective AMPA receptor antagonist) (Lazzaro et al. (2002). Functional characterization of CP-465,022, a selective, noncompetitive AMPA receptor antagonist. Neuropharmacology 42(2): 143-153). The responses to glutamate as functions of the test compound concentrations were fitted to a four-parameter logistic function. The fitted parameter corresponding to the midpoint was taken to be the potency of inhibition of the compound. The data in Table 4 below illustrates the observed potentcy for the compounds described herein. pIC50 refers to the negative log of the IC50 in molar.
- Electrophysiological Assay (EP) (In Vitro Assay) The following patch voltage clamp electrophysiology studies were performed on representative compounds of the invention using human embryonic kidney cells (HEK), permanently transfected with an expression vector containing the full-length cDNA coding for the desired human sodium channel α-subunit, grown in culture media containing 10% FBS, 1% PSG, and 0.5 mg/mL G418 at 37° C. with 5% CO2. HEK cells used for the electrophysiology (EP) recordings had a passage number of less than 40 for all studies and were used within three days from the time of plating. NaV1.7 and NaV1.5 cDNAs (NM_002977 and AC137587; SCN5A, respectively) were stably expressed in HEK-293 cells. The β1 subunit was coexpressed in both the NaV1.7 and NaV1.5 cell lines.Sodium currents were measured using the patch clamp technique in the whole-cell configuration using either a PatchXpress automated voltage clamp or manually using an Axopatch 200B (Axon Instruments) or Model 2400 (A-M systems) amplifier. The manual voltage clamp protocol was as follows: Borosilicate glass micropipettes were fire-polished to a tip diameter yielding a resistance of 2-4 Mohms in the working solutions. The pipette was filled with a solution comprised of: 5 mM NaCl, 10 mM CsCl, 120 mM CsF, 0.1 mM CaC12, 2 mM MgCl2, 10 mM HEPES, 10 mM EGTA; and adjusted to pH 7.2 with CsOH. The external solution had the following composition: 140 mM NaCl, 5 mM KCl, 2 mM CaC12, 1 mM MgCl2, 10 mM HEPES; and adjusted to pH 7.4 with NaOH. In some studies, the external sodium was reduced by equimolar replacement with choline. Osmolarity in the CsF internal and NaCl external solutions was adjusted to 300 mOsm/kg and 310 mOsm/kg with glucose, respectively. All recordings were performed at ambient temperature in a bath chamber with a volume of 150 μL. Control sodium currents were measured in 0.5% DMSO. Controls and representative compounds of the invention were applied to the recording chamber through a 4-pinch or 8-pinch valve bath perfusion system manufactured by ALA Scientific Instruments.
- FRET Activity Assay The human FXRalpha LBD was expressed in E. coli strain BL21(DE3) as an N-terminally GST tagged fusion protein. The DNA encoding the FXR ligand binding domain was cloned into vector pDEST15 (Invitrogen). Expression was under control of an IPTG inducible T7 promoter. The amino acid boundaries of the ligand binding domain were amino acids 187-472 of Database entry NM_005123 (RefSeq). Expression and purification of the FXR-LBD: An overnight preculture of a transformed E. coli strain was diluted 1:20 in LB-Ampicillin medium and grown at 30° C. to an optical density of OD600=0.4-0.6. Gene expression was then induced by addition of 0.5 mM IPTG. Cells were incubated an additional 6 h at 30° C., 180 rpm. Cells were collected by centrifugation (7000×g, 7 min, rt). Per liter of original cell culture, cells were resuspended in 10 mL lysis buffer (50 mM Glucose, 50 mM Tris pH 7.9, 1 mM EDTA and 4 mg/mL lysozyme) and left on ice for 30 min. Cells were then subjected to sonication and cell debris removed via centrifugation (22000×g, 30 min, 4° C.). Per 10 mL of supernatant 0.5 mL prewashed Glutathione 4B sepharose slurry (Qiagen) was added and the suspension kept slowly rotating for 1 h at 4° C. Glutathione 4B sepharose beads were pelleted by centrifugation (2000× g, 15 sec, 4° C.) and washed twice in wash buffer (25 mM Tris, 50 mM KCl, 4 mM MgCl2 and IM NaCl). The pellet was resuspended in 3 mL elution buffer per liter of original culture (elution buffer: 20 mM Tris, 60 mM KCl, 5 mM MgCl2 and 80 mM glutathione added immediately prior to use as powder). The suspension was left rotating for 15 min at 4° C., the beads pelleted and eluted again with half the volume of elution buffer than the first time. The eluates were pooled and dialysed overnight in 20 mM Hepes buffer (pH 7.5) containing 60 mM KCl, 5 mM MgCl2 as well as 1 mM dithiothreitol and 10% (v/v) glycerol. The protein was analysed by SDS-Page.
- HEK-Blue-hTLR 7 Cells Assay A stable HEK-Blue-hTLR7 cell line was purchased from InvivoGen (Cat. #: hkb-htlr7, San Diego, Calif., USA). These cells were designed for studying the stimulation of human TLR7 by monitoring the activation of NF-κB. A SEAP (secreted embryonic alkaline phosphatase) reporter gene was placed under the control of the IFN-3 minimal promoter fused to five NF-κB and AP-1-binding sites. The SEAP was induced by activating NF-κB and AP-1 via stimulating HEK-Blue-hTLR7 cells with TLR7 ligands. Therefore the reporter expression was regulated by the NF-κB promoter upon stimulation of human TLR7 for 20 hrs. The cell culture supernatant SEAP reporter activity was determined using QUANTI-Blue kit (Cat. #: rep-qbl, Invivogen, San Diego, Ca, USA) at a wavelength of 640 nm, a detection medium that turns purple or blue in the presence of alkaline phosphatase.HEK-Blue-hTLR7 cells were incubated at a density of 250,000-450,000 cells/mL in a volume of 180 μL in a 96-well plate in Dulbecco's Modified Eagle's medium (DMEM) containing 4.5 g/L glucose, 50 U/mL penicillin, 50 mg/mL streptomycin, 100 mg/mL Normocin, 2 mM L-glutamine, 10% (V/V) heat-inactivated fetal bovine serum for 24 hrs. Then the HEK-Blue-hTLR-7 cells were incubated with addition of 20 μL test compound in a serial dilution in the presence of final DMSO at 1% and perform incubation under 37° C. in a CO2 incubator for 20 hrs. Then 20 μL of the supernatant from each well was incubated with 180 L Quanti-blue substrate solution at 37° C. for 2 hrs and the absorbance was read at 620-655 nm using a spectrophotometer. The signalling pathway that TLR7 activation leads to downstream NF-κB activation has been widely accepted, and therefore similar reporter assay was also widely used for evaluating TLR7 agonist (Tsuneyasu Kaisho and Takashi Tanaka, Trends in Immunology, Volume 29, Issue 7, July 2008, Pages 329.sci; Hiroaki Hemmi et al, Nature Immunology 3, 196-200 (2002)).
- HEK-Blue-hTLR8 Cells Assay A stable HEK-Blue-hTLR8 cell line was purchased from InvivoGen (Cat. #: HEK-Blue-htlr8, San Diego, Calif., USA). These cells were designed for studying the stimulation of human TLR8 by monitoring the activation of NF-κB. A SEAP (secreted embryonic alkaline phosphatase) reporter gene was placed under the control of the IFN-3 minimal promoter fused to five NF-κB and AP-1-binding sites. The SEAP was induced by activating NF-κB and AP-1 via stimulating HEK-Blue-hTLR8 cells with TLR8 ligands. Therefore the reporter expression was regulated by the NF-κB promoter upon stimulation of human TLR8 for 20 hrs. The cell culture supernatant SEAP reporter activity was determined using QUANTI-Blue kit (Cat. #: rep-qb 1, Invivogen, San Diego, Ca, USA) at a wavelength of 640 nm, a detection medium that turns purple or blue in the presence of alkaline phosphatase.HEK-Blue-hTLR8 cells were incubated at a density of 250,000-450,000 cells/mL in a volume of 180 μL in a 96-well plate in Dulbecco's Modified Eagle's medium (DMEM) containing 4.5 g/L glucose, 50 U/mL penicillin, 50 mg/mL streptomycin, 100 mg/mL Normocin, 2 mM L-glutamine, 10% (V/V) heat-inactivated fetal bovine serum for 24 hrs. Then the HEK-Blue-hTLR8 cells were incubated with addition of 20 μL test compound in a serial dilution in the presence of final DMSO at 1% and perform incubation under 37° C. in a CO2 incubator for 20 hrs. Then 20 μL of the supernatant from each well was incubated with 180 μL Quanti-blue substrate solution at 37° C. for 2 hours and the absorbance was read at 620-655 nm using a spectrophotometer. The signalling pathway that TLR8 activation leads to downstream NF-κB activation has been widely accepted, and therefore similar reporter assay was also widely used for evaluating TLR8 agonist (Tsuneyasu Kaisho and Takashi Tanaka, Trends in Immunology, Volume 29, Issue 7, July 2008, Pages 329.sci; Hiroaki Hemmi et al, Nature Immunology 3, 196-200 (2002)).
- HEK293-Blue-hTLR-7 Cells Ass A stable HEK293-Blue-hTLR-7 cell line was purchased from InvivoGen (Cat.#: hkb-htlr7, San Diego, Calif., USA). These cells were designed for studying the stimulation of human TLR7 by monitoring the activation of NF-κB. A SEAP (secreted embryonic alkaline phosphatase) reporter gene was placed under the control of the IFN-β□ minimal promoter fused to five NF-κB and AP-1-binding sites. The SEAP was induced by activating NF-κB and AP-1 via stimulating HEK-Blue hTLR7 cells with TLR7 ligands. Therefore the reporter expression was regulated by the NF-κB promoter upon stimulation of human TLR7 for 20 hours. The cell culture supernatant SEAP reporter activity was determined using QUANTI-Blue kit (Cat.#: rep-qb1, Invivogen, San Diego, Calif., USA) at a wavelength of 640 nm, a detection medium that turns purple or blue in the presence of alkaline phosphatase.HEK293-Blue-hTLR7 cells were incubated at a density of 250,000 ~ 450,000 cells/mL in a volume of 180 μL in a 96-well plate in Dulbecco's Modified Eagle's medium (DMEM) containing 4.5 g/L glucose, 50 U/mL penicillin, 50 mg/mL streptomycin, 100 mg/mL Normocin, 2 mM L-glutamine, 10% (v/v) heat-inactivated fetal bovine serum for 24 h. Then the HEK293-Blue-hTLR-7 cells were incubated with addition of 20 μL test compound in a serial dilution in the presence of final DMSO at 1% and perform incubation under 37° C. in a CO2 incubator for 20 hours. Then 20 μL of the supernatant from each well was incubated with 180 μL Quanti-blue substrate solution at 37° C. for 2 hours and the absorbance was read at 620-655 nm using a spectrophotometer. The signalling pathway that TLR7 activation leads to downstream NF-κB activation has been widely accepted, and therefore similar reporter assay was also widely used for evaluating TLR7 agonist (Tsuneyasu Kaisho and Takashi Tanaka, Trends in Immunology, Volume 29, Issue 7, July 2008, Pages 329.sci; Hiroaki Hemmi et al, Nature Immunology 3, 196-200 (2002).
- HEK293-Blue-hTLR-7 Cells Assay A stable HEK293-Blue-hTLR-7 cell line was purchased from InvivoGen (Cat. #: hkb-ht1r7, San Diego, Calif., USA). These cells were designed for studying the stimulation of human TLR7 by monitoring the activation of NF-κB. A SEAP (secreted embryonic alkaline phosphatase) reporter gene was placed under the control of the IFN-β␣minimal promoter fused to five NF-κB and AP-1-binding sites. The SEAP was induced by activating NF-κB and AP-1 via stimulating HEK-Blue hTLR7 cells with TLR7 ligands. Therefore the reporter expression was regulated by the NF-κB promoter upon stimulation of human TLR7 for 20 hours. The cell culture supernatant SEAP reporter activity was determined using QUANTI-Blue kit (Cat. #: rep-qb1, Invivogen, San Diego, Calif., USA) at a wavelength of 640 nm, a detection medium that turns purple or blue in the presence of alkaline phosphatase.HEK293-Blue-hTLR7 cells were incubated at a density of 250,000 450,000 cells/mL in a volume of 180 μL in a 96-well plate in Dulbecco's Modified Eagle's medium (DMEM) containing 4.5 g/L glucose, 50 U/mL penicillin, 50 mg/mL streptomycin, 100 mg/mL Normocin, 2 mM L-glutamine, 10% (v/v) heat-inactivated fetal bovine serum for 24 h. Then the HEK293-Blue-hTLR-7 cells were incubated with addition of 20 μL test compound in a serial dilution in the presence of final DMSO at 1% and perform incubation under 37° C. in a CO2 incubator for 20 hours. Then 20 μL of the supernatant from each well was incubated with 180 μL Quanti-blue substrate solution at 37° C. for 2 hours and the absorbance was read at 620 655 nm using a spectrophotometer. The signalling pathway that TLR7 activation leads to downstream NF-κB activation has been widely accepted, and therefore similar reporter assay was also widely used for evaluating TLR7 agonist (Tsuneyasu Kaisho and Takashi Tanaka, Trends in Immunology, Volume 29, Issue 7, July 2008, Pages 329.sci; Hiroaki Hemmi et al, Nature Immunology 3, 196-200 (2002).
- HEK293-Blue-hTLR-7 Cells Assay A stable HEK293-Blue-hTLR-7 cell line was purchased from InvivoGen (Cat.#: hkb-htlr7, San Diego, Calif., USA). These cells were designed for studying the stimulation of human TLR7 by monitoring the activation of NF-κB. A SEAP (secreted embryonic alkaline phosphatase) reporter gene was placed under the control of the IFN-3 minimal promoter fused to five NF-κB and AP-1-binding sites. The SEAP was induced by activating NF-κB and AP-1 via stimulating HEK-Blue hTLR7 cells with TLR7 ligands. Therefore the reporter expression was regulated by the NF-κB promoter upon stimulation of human TLR7. The cell culture supernatant SEAP reporter activity was determined using QUANTI-Blue kit (Cat.#: rep-qb 1, Invivogen, San Diego, Ca, USA) at a wavelength of 640 nm, a detection medium that turns purple to blue in the presence of alkaline phosphatase.HEK293-Blue-hTLR7 cells were incubated at a density of 250,000 450,000 cells/mL in a volume of 180 μL in a 96-well plate in Dulbecco's Modified Eagle's medium (DMEM) containing 4.5 g/l glucose, 50 U/ml penicillin, 50 mg/ml streptomycin, 100 mg/ml Normocin, 2 mM L-glutamine, 10% (v/v) heat-inactivated fetal bovine serum for 24 h. Then the HEK293-Blue-hTLR-7 cells were incubated with addition of 20 μL test compound in a serial dilution in the presence of final DMSO at 1% and perform incubation under 37° C. in a CO2 incubator for 20 hours. Then 20 μL of the supernatant from each well was incubated with 180 μL Quanti-blue substrate solution at 37° C. for 1-3 hours and the absorbance was read at 620 655 nm using a spectrophotometer. The signalling pathway that TLR7 activation leads to downstream NF-κB activation has been widely accepted, and therefore similar reporter assay was also widely used for evaluating TLR7 agonist (Tsuneyasu Kaisho and Takashi Tanaka, Trends in Immunology, Volume 29, Issue 7, July 2008, Pages 329.sci; Hiroaki Hemmi et al, Nature Immunology 3, 196-200 (2002).
- Inhibition Assays of Transporters (hSERT and rVMAT2) hSERT and rVMAT2 fluorometric screening assays. For both hSERT and rVMAT2 screening experiments, respective singly transfected cells were seeded at a density of 0.09×10⁶ cells/well in poly-D-Lysine (Alamanda Polymers, Inc.) coated white solid-bottom 96-well plates (Costar). Growth was permitted for approximately 44 hours in said aqueous media and at an incubation environment of 37° C. and 5% Carbon Dioxide. At the beginning of the experiment, the cellular growth solution was aspirated, and individual cells were rinsed with 150 μL of 1×Dulbecco's Phosphate Buffered Saline (PBS; HyClone). 63 μL of Experimental Media (consisting of the following contents: DMEM without phenol red but with 4.5 g/L of D-Glucose (Gibco), 1% (v/v) FBS (Atlanta Biologicals), 100 U/mL Penicillin (Gibco), and 10 μg/mL Streptomycin (Gibco)) with 2×tiered concentrations of inhibitor (or DMSO, the vehicle of these experiments) were added to the respective wells. Control inhibitors used in these studies include Imipramine for hSERT experiments, and Reserpine for rVMAT2 experiments (Eiden, L. E. and Weihe, E. 2011; Sette, M. et al. 1983). At the conclusion of the pre-incubation period (60 minutes for hSERT experiments and 30 minutes for rVMAT2 experiments), 63 μL of Experimental Media containing 2×various concentrations of tested inhibitor (or vehicle) along with a specified amount of fluorescent substrate, APP+(Karpowicz, R. J. et al 2013) (final concentration: 1.1 μM for hSERT experiments) or FFN206 (Hu, G. et al. 2013) (final concentration: 0.75 μM for rVMAT2 experiments) were added to the present solution contained within the wells. After a required incubation period (30 minutes for hSERT experiments and 60 minutes for rVMAT2 experiments) for proper fluorescent probe uptake, the contents of each well were aspirated and consequently, rinsed twice with 120 μL of PBS. A final solution of 120 μL of PBS is finally added to all corresponding wells for cell maintenance before undergoing fluorescence uptake reading by a BioTek H1MF plate reader. The excitation and emission wavelengths of APP+ were set at 389 and 442 nm, respectively. Alternatively, the excitation and emission wavelengths of FFN206 were designed at 370 and 464 nm, respectively.
- Inhibitory Effect on the Sodium-dependent Glucose Co-Transporter SGLT, SGLT1 and SGLT2 The SGLT-2 assay is carried out as follows: CHO-hSGLT2 cells are cultivated in Ham's F12 Medium (BioWhittaker) with 10% foetal calf serum and 250 μg/mL zeocin (Invitrogen), and HEK293-hSGLT2 cells are cultivated in DMEM medium with 10% foetal calf serum and 250 μg/mL zeocin (Invitrogen). The cells are detached from the culture flasks by washing twice with PBS and subsequently treating with trypsin/EDTA. After the addition of cell culture medium the cells are centrifuged, resuspended in culture medium and counted in a Casy cell counter. Then 40,000 cells per well are seeded into a white, 96-well plate coated with poly-D-lysine and incubated overnight at 37° C., 5% CO2. The cells are washed twice with 250 μl of assay buffer (Hanks Balanced Salt Solution, 137 mM NaCl, 5.4 mM KCl, 2.8 mM CaCl2, 1.2 mM MgSO4 and 10 mM HEPES (pH 7.4), 50 μg/mL of gentamycin). 250 μl of assay buffer and 5 μl of test compound are then added to each well and the plate is incubated for a further 15 minutes in the incubator. 5 μl of 10% DMSO are used as the negative control. The reaction is started by adding 5 μl of 14 C-AMG (0.05 μCi) to each well. After 2 hours' incubation at 37° C., 5% CO2, the cells are washed again with 250 μl of PBS (200 C) and then lysed by the addition of 25 μl of 0.1 N NaOH (5 min. at 37° C.). 200 μl of MicroScint20 (Packard) are added to each well and incubation is continued for a further 20 min at 37° C. After this incubation the radioactivity of the 14 C-AMG absorbed is measured in a Topcount (Packard) using a 14 C scintillation program.To determine the selectivity with respect to human SGLT1 an analogous test is set up in which the cDNA for hSGLTI (Genbank Ace. No. NM000343) instead of hSGLT2 cDNA is expressed in CHO-K1 or HEK293 cells.
- UDP-Glo Glucosylceramide Synthase Biochemical Assay Using Promega s UDP-Glo Glycosyltransferase assay kit (Promega Corporation, Madison, WI, USA (Promega)), GCS activity was indirectly measured by detecting the amount of UDP produced. An aliquot of GCS enzyme (1.5 µg crude golgi preparation, total protein) and titrated test compound were aliquoted to each well and incubated for 30 minutes at room temperature. Substrate mixture was prepared by mixing C6 ceramide (Avanti Polar Lipids, Alabaster, AL USA (Avanti)) (micelles prepared at 0.6 mM in 0.6 mM DOPC) and UDP-glucose (20 µM; Promega), at concentrations equivalent to 2x Km, in assay buffer (25 mM HEPES (pH 7.5), 50 mM KCl, 5 mM MgCl2). An equivalent volume of substrate mixture was then added to each well. Following a 20 h incubation at room temperature to allow for GCS turnover of substrate, an equal volume of UDP detection reagent (Promega) was added to each well and incubated for an additional 75 minutes at room temperature to simultaneously convert the accumulated UDP product into ATP and generate light in a luciferase reaction. The generated light was detected using a luminometer. Random luminescence values (RLUs) were normalized to mean min and max effects, as determined on each plate. Min was defined as the mean of the values of the wells treated with vehicle (DMSO) and which represent 0% inhibition; max was defined as the mean of the values of the wells treated with a reference inhibitor and which represent the 100% effect. Values for %Emax and EC50 were determined by best-fitting the normalized data to a curve in Activity Base along a four-parameter logistic nonlinear regression (4PL) model (based on the Levenberg-Marquardt algorithm and defined by the equation below):where: n is 4PMin (bottom of the curve); m is 4PMax (top of the curve); i is IP (inflection point of curve); and p is slope. See Levenberg, K., A Method for the Solution of Certain Problems in Least Squares , Quart. Appl. Math.2, (1944), pp 164 168 and Marquardt, D., An Algorithm for Least Squares Estimation on Nonlinear Parameters , SIAM J. Appl. Math.11, (1963) pp 431 441.
- [3H]DA and [3H]5-HT Uptake Assay [3H]DA and [3H]5-HT uptake into striatal synaptosomes was determined to evaluate compound inhibition of the dopamine transporter (DAT) and the serotonin transporter (SERT), respectively. Striata from individual rats were homogenized in ice-cold sucrose solution containing 5 mM NaHCO3 (pH 7.4), with 16 up-and-down strokes of a Teflon pestle homogenizer (clearance≈0.003″). Homogenates were centrifuged at 2000 g for 10 min at 4° C., and resulting supernatants were centrifuged at 20.000 g for 17 min at 4° C. Pellets were resuspended in 2.4 mL (for DAT assays) or 1.5 mL (for SERT assays) of assay buffer (125 mM NaCl, 5 mM KCl, 1.5 mM MgSO4, 1.25 mM CaCl2, 1.5 mM KH2PO4, 10 mM alpha-D-glucose, 25 mM HEPES, 0.1 mM EDTA, 0.1 mM pargyline, 0.1 mM ascorbic acid, saturated with 95% O2/5% CO2, pH 7.4). Assays were performed in duplicate in a total volume of 500 μL (for DAT assays) or 250 μL (for SERT assays). Aliquots of the synaptosomal suspension (25 μL for DAT, 50 μL for SERT) were added to tubes containing assay buffer and various concentrations of analog (1 nM-100 μM), and incubated at 34° C. for 5 min. Nonspecific uptake was determined in the presence of nomifensine (10 μM) for DAT assays or fluoxetine (10 μM) for SERT assays. GBR-12935 (100 nM) was included in the assay buffer for the SERT assay to maximally inhibit [3H]5-HT uptake through DAT and isolate uptake to SERT. Samples were placed on ice, and 50 μL of 0.1 μM [3H]DA (for DAT assays) or 25 μL of 0.1 μM [3H]5-HT (for SERT assays) was added to each tube, and incubated for 10 min at 34° C. Reactions were terminated by addition of 3 mL of ice-cold assay buffer and subsequent filtration and radioactivity retained by the filters was determined by liquid scintillation spectrometry (Tri-Carb 2100TR liquid scintillation analyzer; PerkinElmer Life and Analytical Sciences, Boston, MA).
- Compound Profiling Methods Strains expressing SCD1 or SCD5 as the sole desaturase, the human SCD1 and SCD5 genes were used to evaluate inhibition of SCD1/SCD5 using reduced growth as a surrogate for SCD inhibition. These yeast strains express human SCD1 or SCD5 from a plasmid harbored in a strain in which the yeast OLE1 gene is deleted.All compound profiling experiments were performed using the same basic protocol. Yeast were cultured using standard techniques in complete synthetic media lacking uracil and containing yeast nitrogen base supplemented with 2% (w/v) glucose (SD-Ura) Starter cultures were inoculated in 3 mL SD-Ura media containing 0.01% tween and 0.2 mM palmitoleic and oleic acid. Cultures were incubated overnight in a 30° C. shaker incubator (225 rpm). Saturated morning cultures were centrifuged, washed in SD-Ura media lacking TWEEN-20 and fatty acids, and then diluted 1:20 in fresh SD-Ura media also lacking TWEEN-20 and fatty acids. Cells were grown for 6 h to an OD600 (optical density) of 0.4-0.8 at 30° C. with shaking.Compound stocks (10 mM in 100% DMSO) were arrayed into 384-round well, v-bottom polypropylene plates and diluted according to indicated dilution factors. Compound administration was performed in two separate steps. First, 15 μL of SD-Ura was dispensed into clear 384-well assay plates using a MULTIDROP Combi reagent dispenser. The diluted compound stock plates were then applied to the assay plates using an automated workstation (Perkin Elmer JANUS ) outfitted with a 384-pin tool containing slotted pins that deliver 100 nL of compound. The cultures described above were centrifuged and washed with media lacking TWEEN-20 or oleic and palmitoleic acids. Cultures were then resuspended at a 2-fold concentrated OD600 of 0.02 (final OD600 of 0.0.01) in SD-Ura. 15 μL of diluted culture was then dispensed into the pinned assay plate to achieve 30 μL of the 1×OD600 culture (0.01) and a top drug concentration of 33.3 μM.After yeast delivery, assay plates were incubated under humidified conditions at 30° C. for 40 h. Yeast growth was monitored by reading the OD600 of each well using a microplate reader (Perkin Elmer EnVision ). Data were analyzed as follows. Raw data were processed by background subtracting and converting values to a percent of the nontreated condition for that strain [(EXP-0.035)/(DMSO-0.035)×100%].
- Electrophysiological Assay (EP) (In vitro Assay) Patch voltage clamp electrophysiology allows for the direct measurement and quantification of block of voltage-gated sodium channels (NaV's), and allows the determination of the time- and voltage-dependence of block which has been interpreted as differential binding to the resting, open, and inactivated states of the sodium channel (Hille, B., Journal of General Physiology (1977), 69: 497-515).The following patch voltage clamp electrophysiology studies were performed on representative compounds of the invention using human embryonic kidney cells (HEK), permanently transfected with an expression vector containing the full-length cDNA coding for the desired human sodium channel α-subunit, grown in culture media containing 10% FBS, 1% PSG, and 0.5 mg/mL G418 at 37° C. with 5% CO2. HEK cells used for the electrophysiology (EP) recordings had a passage number of less than 40 for all studies and were used within three days from the time of plating, NaV1.7 and NaV1.5 cDNAs (NM_002977 and AC137587; SCN5A, respectively) were stably expressed in HEK-293 cells. The β1 subunit was coexpressed in both the NaV1.7 and NaV1.5 cell lines.Sodium currents were measured rising the patch clamp technique in the whole-cell configuration using either a PatchXpress automated voltage clamp or manually using an Axopatch 200B (Axon Instruments) or Model 2400 (A-M systems) amplifier. The manual voltage clamp protocol was as follows: Borosilicate glass micropipettes were fire-polished to a tip diameter yielding a resistance of 2-4 Mohms in the working solutions. The pipette was filled with a solution comprised of: 5 mM NaCl, 10 mM CsCl, 120 mM CsF, 0.1 mM CaCl2, 2 mM MgCl2, 10 mM HEPES, 10 mM EGTA; and adjusted to pH 7.2 with CsOH. The external solution had the following composition: 140 mM NaCl, 5 mM KCl, 2 mM CaCl2, 1 mM MgCl2, 10 mM HEPES; and adjusted to pH 7.4 with NaOH. In some studies, the external sodium was reduced by equimolar replacement with choline. Osmolality in the CsF internal and NaCl external solutions was adjusted to 300 mOsm/kg and 310 mOsm/kg with glucose, respectively. All recordings were performed at ambient temperature in a bath chamber with a volume of 150 μL. Control sodium currents were measured in 0.5% DMSO.
- Evaluation of GLUT9 Inhibitory Activity Uricase/Hyper transiently-transfected human GLUT9 stably expressing cells or mock cells (blank) were seeded in a 96 well plate (Corning) at 1.6×10⁵ cells/well, and cultured overnight at 37° C., 5% CO2. D-MEM/high glucose (Wako Pure Chemical Industries, Ltd.) containing 10% Fetal Bovine Serum (Lifetechnology) and 100 units/ml penicillin/100 μg/ml streptomycin (GIBCO) was used as a medium. High K− buffer (129.8 mM KCl, 1.2 mM KH2PO4, 1.2 mM MgSO4.7H2O, 1.3 mM CaCl2. 2H2O, 25 mM HEPES, pH 7.4 with 1 M Tris) and the medium were mixed in equal amount to prepare Assay Buffer. The medium in each well was removed, and the test compound solution (final 1% DMSO) diluted with Assay Buffer was added thereto at 50 μl/well, and the mixture was left stand at room temperature for 30 to 60 min. For the solvent control and blank, Assay Buffer containing DMSO alone was added at 50 μl/well, and the mixture was left stand at room temperature for 30 to 60 min. In addition, uric acid solution (containing [14C]uric acid as a tracer) diluted with Assay Buffer was added to each well at 15 μl/well (final 300 μM uric acid), and the uptake reaction was performed at room temperature for 6 min. After the completion of the reaction, the cells were washed three times with ice-cooled Wash Buffer (Hank's Balanced Salt Solution containing 0.01% Bovine Serum Albumin) at 150 μl/well, and 0.1N aqueous NaOH solution was added thereto at 25 μl/well to dissolve the cell. MicroScint-20 (Perkin-Elmer) was added thereto at 150 μl/well, the plate was shaked, and CPM of [14C] was measured by TopCount NXT (Perkin-Elmer).Data was obtained by deducting average of CPM in blank well from average of CPM in each treated well. The inhibitory rate of the test compound in each concentration was calculated from the following formula: [(A−B)/A]×100, A is data of solvent control, B is data of test compound treatment. IC50 value (50% inhibition concentration) of the test compound was obtained by applying the inhibitory rate of the test compound in each concentration to logistic curve.
- Functional Ca2+ Mobilisation Assay Ca2+ ions are usually kept at nanomolar levels in the cytosol of cells, and act in a number of signal transduction pathways as second messengers. Many GPCRs including neurotensin receptor couple to induce calcium ion signaling, and many primary cellular assays employ measurement of intracellular calcium ion concentration as a functional readout of GPCR activation. Changes in calcium ion concentration in standard assay protocols can be readily detected with fluorescent dyes that emit light when changes in intracellular Ca2+ ion concentration occur. Given the transient nature of these responses, they are often read with instrumentation that has inject and read capability. This example shows that compounds of the present invention do not have any agonistic activity on NTR1-expressing cells. Furthermore, this example shows that conjugates of the present invention bind to NTR1 and inhibit the activity of an additionally present NTR1 agonist.HT29 or NTR1-expressing HEK293 cells were trypsinized and seeded into black flat clear-bottom 96-well plates (Corning, Amsterdam, The Netherlands) at 6×10⁵ cells per well. After 24 h incubation at 37° C. and 5% CO2, cells were washed twice with wash buffer (130 mM NaCl, 5 mM KCl, 10 mM Hepes, 2 mM CaCl2, 10 mM Glucose, pH 7.4) and loaded with 100 μl of Ca5 dye (Molecular Devices, Biberach, Germany) for 1 h at 37° C. and 5% CO2. For agonist assays, serial dilutions of agonistic substances were added to the cells loaded with dye and the change of the fluorescent signal was recorded continually for approx. 90 s using a FlexStation II (Molecular Devices, Biberach, Germany). Addition of wash buffer served as a control. Thus, EC50 concentrations for each conjugate were computed and provided a measure for the potency of the substance. For antagonist assays, cells loaded with 100 μl of Ca5-dye were pre-incubated with serial dilutions of antagonistic substances for 30 min, before the EC80-concentration of agonist was added to the cells and the change of the fluorescent signal was recorded continually for approx. 90 s. Thus, IC50 concentrations were computed for each conjugate and provided a measure for the inhibitory activity of the conjugates at the NTR1.The intrinsic fluorescence of fluorescein-containing conjugate (19) interfered with the Ca5-dye fluorescence. Therefore, no IC50 or EC50 values could be determined for this conjugate.
- Inhibition Assay hERG study was conducted with an automated patch clamp machine, Qpatch-48HT (Sophion Biosciences, Denmark). Cultured CHO cells stably expressing hERG channels (provided by Sophion Biosciences, Denmark) were harvested from culture flasks of 70-90% cell confluence rate and prepared as cell suspension with a cell density of 3-8&timse;10^6 cells/mL in serum-free media (CHO-S-SFM II, cat#12052 Invitrogen; 25 mM HEPES). Cells in such condition were placed into a Qpatch cell stir chamber and used within 4 hours. For each run, cells were first spun down by the built-in Qpatch centrifuge and re-suspended in an extracellular solution (in mM, 2 CaCl2, 1 MgCl2, 4 KCl, 145 NaCl, 10 Glucose, 10 HEPES, pH 7.4, osmolarity ~305 mOsm). Qplate-48 that holds one cell in each of its 48 channels for the later voltage-clamped assay were primed with the extracellular solution and intracellular solution (in mM, 5.4 CaCl2, 1.75 MgCl2, 120 KCl, 10 HEPES, 5 EGTA, 4 NaATP, pH 7.25, Osmolarity ~280-295 mOsm). Cells were dispatched by Qpatch robotic dispensing guns into each Qplate channel and went through the process of giga-ohm sealing and whole cell configuration. Whole-cell recordings were performed in voltage-clamp mode at a holding potential of −80 mV. The hERG current was activated by depolarizing at +20 mV for 5 sec, after which the current was taken back to −50 mV for 5 sec to remove the inactivation and observe the deactivating tail current. The maximum amount of tail current size was used to determine the hERG current amplitude. The above voltage protocol was applied to the cells every 15 sec throughout the whole procedure. External solution containing 0.1% DMSO (vehicle) was applied to the cells to establish the baseline. Compound solution was added, and the cells were kept in the test solution until the compound's effect reached a steady state or for a maximum of 4 min. For dose response assays (0.1, 0.3, 1, 3, 10 and 30 μM), the compound was applied to the cells accumulatively from low to high concentrations. Washout with extracellular solution was performed after compound testing. Positive control cisapride 0.1 μM was used on each cell after compound testing to ensure the normal response and the good quality of the cell.
- Intracellular Ca2+ Mobilization Assay (FLIPR) A monoclonal HEK-293 cell line stably transfected with a cDNA encoding for the human mGlu4 receptor was generated. Cells were cultured according to standard protocols (Freshney, 2000) in Dulbecco's Modified Eagle Medium with high glucose supplemented with 1 mM glutamine, 10% (vol/vol) heat-inactivated bovine calf serum, penicillin/streptomycin, 50 μg/ml hygromycin and 15 μg/ml blasticidin (all cell culture reagents and antibiotics from Invitrogen, Basel, Switzerland).About 24 hrs before an experiment, 5×10⁴ cells/well were seeded in poly-D-lysine coated, black/clear-bottomed 96-well plates. The cells were loaded with 2.5 μM Fluo-4AM in loading buffer (1×HBSS, 20 mM HEPES) for 1 hr at 37° C. and washed five times with loading buffer. The cells were transferred into a Functional Drug Screening System 7000 (Hamamatsu, Paris, France), and 11 half logarithmic serial dilutions of test compound at 37° C. were added and the cells were incubated for 10-30 min. with on-line recording of fluorescence. Following this pre-incubation step, the agonist (2S)-2-amino-4-phosphonobutanoic acid (L-AP4) was added to the cells at a concentration corresponding to EC80 with on-line recording of fluorescence; in order to account for day-to-day variations in the responsiveness of cells, the EC80 of L-AP4 was determined immediately ahead of each experiment by recording of a full dose-response curve of L-AP4.Responses were measured as peak increase in fluorescence minus basal (i.e. fluorescence without addition of L-AP4), normalized to the maximal stimulatory effect obtained with saturating concentrations of L-AP4. Graphs were plotted with the % maximal stimulatory using XLfit, a curve fitting program that iteratively plots the data using Levenburg Marquardt algorithm. The single site competition analysis equation used was y=A+((B-A)/(1+((x/C)D))), where y is the % maximal stimulatory effect, A is the minimum y, B is the maximum y, C is the IC50, x is the log 10 of the concentration of the competing compound and D is the slope of the curve (the Hill Coefficient). From these curves the IC50 (drug concentration at which 50% of the receptor activation achieved from the addition of L-AP4 in the experiment was inhibited), the Hill coefficient as well as the maximal response in % of the maximal stimulatory effect obtained with saturating concentrations of L-AP4 were calculated.
- MATE2-K IC50 Assay MATE2-K (multidrug and toxin extrusion protein 2) is expressed in the apical membrane in the kidney and mediates the elimination of compounds to urine. MDCK-II cells were maintained in DMEM with low glucose and 10% FBS. Cells passages up to 40 were seeded at 60K±10K cells/well on 96-well, transwell membrane plates approximately 24 hours before transfection. Transport assays were carried out approximately 48 hours after transfection. On assay day, the DMEM was removed, and cells were washed with HBSS. After washing, the cells in each well were pre-incubated with HBSS containing 30 mM NH4Cl and either vehicle, the compound being tested at 6 concentrations ranging from 0.127 μM to 40 AM, or 100 μM cimetidine as a reference inhibitor. The assay plate was then placed in a 37° C. incubator with orbital shaking at approximately 60 RPM for the pre-incubation time of 15 minutes. The pre-incubation solutions were then removed, and cells washed with HBSS once. 100 μL of incubation buffer was added to each well containing HBSS with 10 μM 14[C]-metformin as the probe substrate and either vehicle control, the compound being tested (at 6 concentrations ranging from 0.127 μM to 40 μM) or reference inhibitors. The assay plate was incubated at 37° C. with orbital shaking at approximately 60 RPM for the incubation time of 5 minutes. At end of the 5-minute incubation, 15 μL of dosing solution was removed from each well containing the compound being tested and measured using LC/MS/MS for dose recovery assessment. The assay wells were then washed four times with ice cold PBS. 60 μL cell extraction solution was added to each well and the plate was incubated at 37° C. with orbital shaking at approximately 60 RPM for the 15 minutes. After this incubation, 30 μL was removed from each well, added to 200 μL scintillation fluid, and counted on a 1450 Microbeta (Perkin-Elmer) to measure the probe substrate uptake. Inhibition potential of the compound being tested was calculated by dividing the transporter-mediated uptake rate in presence of the compound being tested or the reference inhibitor by the transporter-mediated uptake rate in presence of vehicle control and fitted to a sigmoidal function to determine the IC50 values.
- Radioligand Binding Assay on Rat HEK-293 cells stably expressing rat TAAR1 were maintained at 37° C. and 5% CO2 in DMEM high glucose medium, containing fetal calf serum (10%, heat inactivated for 30 min at 56° C.), penicillin/streptomycin (1%), and 375 μg/ml geneticin (Gibco). Cells were released from culture flasks using trypsin/EDTA, harvested, washed twice with ice-cold PBS (without Ca2+ and Mg2+), pelleted at 1,000 rpm for 5 min at 4° C., frozen and stored at −80° C. Frozen pellets were suspended in 20 ml HEPES-NaOH (20 mM, pH 7.4) containing 10 mM EDTA and homogenized with a Polytron (PT 6000, Kinematica) at 14,000 rpm for 20 s. The homogenate was centrifuged at 48,000×g for 30 min at 4° C. Subsequently, the supernatant was removed and discarded, and the pellet resuspended in 20 ml HEPES-NaOH (20 mM, pH 7.4) containing 0.1 mM EDTA using the Polytron (20 s at 14,000 rpm). This procedure was repeated and the final pellet resuspended in HEPES-NaOH containing 0.1 mM EDTA and homogenized using the Polytron. Typically, aliquots of 2 ml membrane portions were stored at −80° C. With each new membrane batch the dissociation constant (Kd) was determined via a saturation curve. The TAAR1 radioligand 3[H]-(S)-4-[(ethyl-phenyl-amino)-methyl]-4,5-dihydro-oxazol-2-ylamine (described in WO 2008/098857) was used at a concentration equal to the calculated Kd value, that was usually around 2.3 nM, resulting in the binding of approximately 0.2% of the radioligand and a specific binding representing approximately 85% of the total binding. Nonspecific binding was defined as the amount of 3[H]-(S)-4-[(ethyl-phenyl-amino)-methyl]-4,5-dihydro-oxazol-2-ylamine bound in the presence of 10 μM unlabeled ligand. All compounds were tested at a broad range of concentrations (10 μM to 10 μM) in duplicates. The test compounds (20 □μl/well) were transferred into a 96 deep well plate (TreffLab), and 180 μl of HEPES-NaOH (20 mM, pH 7.4) containing MgCl2 (10 mM) and CaCl2 (2 mM) (binding buffer), 300 μl of the radioligand 3[H]-(S)-4-[(ethyl-phenyl-amino)-methyl]-4,5-dihydro-oxazol-2-ylamine at a concentration of 3.3×Kd in nM and 500 μl of the membranes (resuspended at 50 μg protein per ml) added.
- patch clamp assay Inhibition of the T-type voltage gated calcium channel (Cav3.1) was evaluated using a HEK-293 natClytin/TASK1+Cav3.1 cell line. Currents were recorded using the SyncroPatch 384PE automated, patch clamp system. Pulse generation and data collection were performed with PatchController384 V1.3.0 and DataController384 V1.2.1 (Nanion Technologies). Off-line analysis was performed using Excel and Graphpad Prism (V 8.4.2) with complete data files uploaded to Dotmatics. The access resistance and apparent membrane capacitance were estimated using built-in protocols. Current was recorded in whole cell configuration from a population of cells. The cells were lifted, triturated, and resuspended at 800,000 cells/ml. The cells were allowed to recover in the cell hotel prior to experimentation. Currents were recorded at room temperature. The external solution contained the following (in mM): NaCl 80, NMDG 60, KCl 4, MgCl2 1, CaCl2 6, glucose 5 and HEPES 10 (pH=7.4, Osmolarity ˜300 mOsm). The extracellular solution was used as the wash, reference and compound delivery solution. The internal solution contained the following (in mM): CsF 110, CsCl 10, NaCl 10, EGTA 10, HEPES 10 (pH=7.2, Osmolarity ˜295 mOsm). The compound plate was created at 2× concentrated in the extracellular solution. The compound was diluted to 1:2 when added to the recording well. The amount of DMSO in the extracellular solution was held constant at the level used for the highest tested concentration. For the voltage clamp experiments on Cav3.1, data were sampled at 10 KHz. After establishment of the seal and the passage in the whole cell configuration, the cells were held at −120 mV. Cav3.1 current was evoked using a 100 ms step to −20 mV (to measure resting state block), followed by a 1600 ms step to −65 mV and a second 100 ms step to −20 mV (to measure voltage dependent block). The voltage protocol was applied every 15 seconds in the absence and in the presence of the compounds under investigation. 2.5 mM Nickel was used to completely inhibit Cav3.1 current to allow for offline subtraction of non-Cav3.1 current. Current amplitude (pA) was measured in the peak 1 and 2. The average of last 3 sweeps of each liquid period (vehicle, compound under investigation, full block) was calculated. Nickel-sensitive current was used to calculate the % of inhibition in the presence of the compound under investigation.
- Calcium Flux Assay An in vitro assay was used to determine the potency of test compounds as inhibitors of the glutamate response of the channel formed by GluA1o-γ8. To ensure a 1:1 stoichiometry of GluA1o and γ8 subunits in the expressed channel, a fusion of the cDNAs for GRIA1o and CACNG8 was used. Following Shi et al (2009) The stoichiometry of AMPA receptors and TARPs varies by neuronal cell type. Neuron 62(5): 633-640), the C-terminus of the cDNA for GRIA1o was fused to the N-terminus of the cDNA for γ8. The linker sequence was QQQQQQQQQQEFAT. Channels expressed with this construct appear to have similar properties to channels formed by co-expression of GRIA1o with an excess of CACNG8 (Shi et al. 2009). A clonal cell line in HEK293 cells stably expressing this construct, with a geneticin selection marker, was generated for use in this assay.Cell expressing the GRIA1o-CACNG8 fusion construct were grown in a monolayer in 96- or 384-well microtiter plates. They were washed with assay buffer (135 mM NaCl, 4 mM KCl, 3 mM CaCl2, 1 mM MgCl2, 5 mM glucose, 10 mM HEPES, pH 7.4, 300 mOs) using a Biotek EL405 plate washer. The cells were then loaded with a calcium-sensitive dye (Calcium-5 or Calcium-6, Molecular Devices) and the test compounds at a range of concentrations. Calcium flux following the addition of 15 μM glutamate was monitored using a Molecular Devices FLIPR Tetra.The fluorescence in each well was normalized to the fluorescence of negative and positive control wells. The negative control wells had no added compounds, and the positive control wells had been incubated with 10 μM CP465022 (a non-subtype-selective AMPA receptor antagonist) (Lazzaro et al. (2002). Functional characterization of CP-465,022, a selective, noncompetitive AMPA receptor antagonist. Neuropharmacology 42(2): 143-153). The responses to glutamate as functions of the test compound concentrations were fitted to a four-parameter logistic function. The fitted parameter corresponding to the midpoint was taken to be the potency of inhibition of the compound. The data in Table 4 below illustrates the observed potency for the compounds described herein. pIC50 refers to the negative log of the IC50 in molar.Using a similar protocol, compounds were also tested for their ability to inhibit TARP γ2 dependent AMPA receptor activity. The compounds that were tested for TARP γ2 AMPA receptor activity had pIC50 values less than 6.
- Calcium Flux Assay This assay was used to test compounds for their ability to inhibit TARP γ8 dependent AMPA receptor activity. The AMPA receptor is a non-selective cation channel activated by glutamate. lonotropic glutamate receptors normally desensitize too rapidly to allow detectable calcium influx in a FLIPR assay (Strange et al. (2006). Functional characterisation of homomeric ionotropic glutamate receptors GluR1-GluR6 in a fluorescence-based high throughput screening assay. Comb Chem High Throughput Screen 9(2): 147-158). But, this desensitization is incomplete, and a substantial steady-state current remains in the sustained presence of glutamate (Cho et al. (2007). Two families of TARP isoforms that have distinct effects on the kinetic properties of AMPA receptors and synaptic currents. Neuron 55(6): 890-904).An in vitro assay was used to determine the potency of test compounds as inhibitors of the glutamate response of the channel formed by GluA1o-g8. To ensure a 1:1 stoichiometry of GluA1o and g8 subunits in the expressed channel, a fusion of the cDNAs for GRIA1o and CACNG8 was used. Channels expressed with this construct appear to have similar properties to channels formed by co-expression of GRIA1o with an excess of CACNG8 (Shi et al. 2009). A clonal cell line in HEK293 cells stably expressing this construct, with a geneticin selection marker, was generated for use in this assay. Cell expressing the GRIAlo-CACNG8 fusion construct were grown in a monolayer in 96- or 384-well microtiter plates. They were washed with assay buffer (135 mM NaCl, 4 mM KCl, 3 mM CaCl2), 1 mM MgCl2, 5 mM glucose, 10 mM HEPES, pH 7.4, 300 mOs) using a Biotek EL405 plate washer. The cells were then loaded with a calcium-sensitive dye (Calcium-5 or Calcium-6, Molecular Devices) and the test compounds at a range of concentrations. Calcium flux following the addition of 15 μM glutamate was monitored using a Molecular Devices FLIPR Tetra.The fluorescence in each well was normalized to the fluorescence of negative and positive control wells. The negative control wells had no added compounds, and the positive control wells had been incubated with 10 μM CP465022 (a non-subtype-selective AMPA receptor antagonist) (Lazzaro et al. (2002). Functional characterization of CP-465,022, a selective, noncompetitive AMPA receptor antagonist. Neuropharmacology 42(2): 143-153). The responses to glutamate as functions of the test compound concentrations were fitted to a four-parameter logistic function. The fitted parameter corresponding to the midpoint was taken to be the potency of inhibition of the compound.
- Electrophysiological Assay (EP) (In Vitro Assay) Patch voltage clamp electrophysiology allows for the direct measurement and quantification of block of voltage-gated sodium channels (NaV's), and allows the determination of the time- and voltage-dependence of block which has been interpreted as differential binding to the resting, open, and inactivated states of the sodium channel (Hille, B., Journal of General Physiology (1977), 69: 497-515).The following voltage clamp electrophysiology studies were performed on representative compounds using cells heterologously expressing Nav1.7 or Nav1.5 channels. cDNAs for Nav1.7 (NM_002977) and Nav1.5 (AC137587) were stably expressed in Chinese Hamstr Ovary (CHO) cells and CHL (Chinese Hamster Lung) cells respectively. Sodium currents were measured in the whole-cell configuration using Syncropatch 384PE (NanIon Technologies, Germany). 1NPC -384 chips with custom medium resistance and single hole mode are used. Internal solution consists of (in mM): 110 CsCl, 10 CsCl, 20 EGTA, and 10 Hepes (pH adjusted to 7.2); and external solution contains (in mM): 60 NMDG, 80 NaCl, 4 KCl, 1 MgCl2, 2 CaCl2, 2 D-Glucose monohydrate, 10 Hepes (pH adjusted to 7.4 with NaOH).After system flushing, testing compounds are dissolved in external solution containing 0.1% Pluronic F-127. The chip is moved into the measuring head and the instrument primes the chip with external and internal solutions. 10l cells are added to the chip from a cell hotel, and a negative pressure of −50 mBar is applied to form a seal. Following treatment with seal enhancer solution and wash-off with external solution, negative pressure of −250 mbar is applied for 1 second to achieve the whole-cell configuration, followed by three washing steps in external solution. 20 μl of compounds is added to 40 μl in each well (1:3 dilution of compounds), and after mixing, 20 μl is removed so the volume is retained at 40 μl. After approximately 13 minutes recordings, 20 μl/well of 2 uM TTX, or 333 uM Tetracaine (for Nav1.5) is added to achieve full block.For voltage protocol, an holding potential of −50 mV is applied during the whole experiment. A depolarizing step is applied to −10 mV for 10 ms, followed by a hyperpolarization step to −150 mV for 20 ms to allow channel recovery from inactivation. A second depolarizing step is applied from −150 mV to −10 mV for 10 ms, where currents were measured to derive blocking effects of compounds. Inhibition is determined based on 7.5 min of compound incubation.
- Electrophysiological Assay (EP) (In Vitro Assay) Patch voltage clamp electrophysiology allows for the direct measurement and quantification of block of voltage-gated sodium channels (NaV's), and allows the determination of the time- and voltage-dependence of block which has been interpreted as differential binding to the resting, open, and inactivated states of the sodium channel (Hille, B., Journal of General Physiology (1977), 69: 497-515).The following voltage clamp electrophysiology studies were performed on representative compounds using cells heterologously expressing Nav1.7 or Nav1.5 channels. cDNAs for Nav1.7 (NM_002977) and Nav1.5 (AC137587) were stably expressed in Chinese Hamstr Ovary (CHO) cells and CHL (Chinese Hamster Lung) cells respectively. Sodium currents were measured in the whole-cell configuration using Syncropatch 384PE (Nanlon Technologies, Germany). 1NPC -384 chips with custom medium resistance and single hole mode are used. Internal solution consists of (in mM): 110 CsCl, 10 CsCl, 20 EGTA, and 10 Hepes (pH adjusted to 7.2); and external solution contains (in mM): 60 NMDG, 80 NaCl, 4 KCl, 1 MgCl2, 2 CaCl2, 2 D-Glucose monohydrate, 10 Hepes (pH adjusted to 7.4 with NaOH).After system flushing, testing compounds are dissolved in external solution containing 0.1% Pluronic F-127. The chip is moved into the measuring head and the instrument primes the chip with external and internal solutions. 10 l cells are added to the chip from a cell hotel, and a negative pressure of −50 mBar is applied to form a seal. Following treatment with seal enhancer solution and wash-off with external solution, negative pressure of −250 mbar is applied for 1 second to achieve the whole-cell configuration, followed by three washing steps in external solution. 20 l of compounds is added to 40 l in each well (1:3 dilution of compounds), and after mixing, 20 l is removed so the volume is retained at 40 ul. After approximately 13 minutes recordings, 20 l/well of 2 uM TTX, or 333 uM Tetracaine (for Nav1.5) is added to achieve full block.For voltage protocol, an holding potential of −50 mV is applied during the whole experiment. A depolarizing step is applied to −10 mV for 10 ms, followed by a hyperpolarization step to −150 mV for 20 ms to allow channel recovery from inactivation. A second depolarizing step is applied from −150 mV to −10 mV for 10 ms, where currents were measured to derive blocking effects of compounds. Inhibition is determined based on 7.5 min of compound incubation.
- Functional Assay HEK293 cells were transfected with human TRPV1 cloned in pcDNA3.1zeo(+) using the Effectene non-liposomal lipid based transfection kit (Qiagen) (hTRPV1/HEK293). hTRPV1/HEK293 cells were routinely grown as monolayers under selection in zeocin (200 μg/mL; Invitrogen) in Dulbecco's Modified Eagle Medium (DMEM, Gibco BRL) supplemented with 10% fetal bovine serum, and penicillin/streptomycin (50 units/mL) in 5% CO2 at 37° C. Cells were passaged frequently, every 3-5 days, to avoid overgrowth, depletion of essential medium components, or acidic medium exposure. Cells were passaged using a brief wash in 0.05% trypsin with 1 mM EDTA, followed by dissociation in divalent-free phosphate-buffered saline (Hyclone #SH30028.02). Dissociated cells were seeded onto poly-D-lysine coated black-walled 96-well plates (Biocoat; Becton Dickinson #354640) at about 40,000 cells per well and grown for approximately 1 day in culture medium to near confluency. The assay buffer was composed of 130 mM NaCl, 2 mM KCl, 2 mM MgCl2, 10 mM HEPES, 5 mM glucose, and either 2 mM or 20 μM CaCl2. On the day of the experiment, the culture medium was replaced with 2 mM calcium assay buffer using an automated plate washer (ELx405; Biotek, VT). The cells were incubated in 100 μL/well Fluo-3/AM (2 μM; TEFLabs #0116) with Pluronic F127 (100 μg/mL; Sigma #P2443) for 1 h at rt in the dark. After loading the cells, the dye solution was replaced with 50 μL/well of 20 μM calcium assay buffer using the ELx405 plate washer. Test compounds (50 μL/well) were added to the plate and incubated for 30 min. Intracellular Ca2+ levels were subsequently assayed using a Fluorometric Imaging Plate Reader (FLIPR™ instrument, Molecular Devices, CA) to simultaneously monitor Fluo-3 fluorescence in all wells (λexcitation=488 nm, λemission=540 nm) during challenge with agonist (capsaicin). The IC50 values were determined. Cells were challenged with 150 nM capsaicin and the fluorescence counts were captured following agonist addition at a sampling rate of 0.33 Hz. The contents of the wells were mixed 3 times (40 μL mix volume) immediately after the additions were made. Concentration dependence of block was determined by exposing each well of cells in duplicate rows of a 96 well plate to a serial dilution of test compound. The concentration series usually started at 10 M with a three-fold serial decrement in concentration. The magnitude of the capsaicin response was determined by measuring the change in fluo3 fluorescence before and 100 seconds after the addition of the agonist.
- Functional Assay The assay was performed as described below, using HEK293 cells transfected with rat TRPV1 (rTRPV1/HEK293). These cells had a geneticin selection marker and were grown in Dulbecco's Modified Eagle Medium (DMEM, Gibco BRL) supplemented with 10% fetal bovine serum, penicillin/streptomycin (50 units/mL), and 500 μg/mL geneticin in 5% CO2 at 37° C. Cells were passaged frequently, every 3-5 days, to avoid overgrowth, depletion of essential medium components, or acidic medium exposure. Cells were passaged using a brief wash in 0.05% trypsin with 1 mM EDTA, followed by dissociation in divalent-free phosphate-buffered saline (Hyclone #SH30028.02). Dissociated cells were seeded onto poly-D-lysine coated black-walled 96-well plates (Biocoat; Becton Dickinson #354640) at about 40,000 cells per well and grown for approximately 1 day in culture medium to near confluency. The assay buffer was composed of 130 mM NaCl, 2 mM KCl, 2 mM MgCl2, 10 mM HEPES, 5 mM glucose, and either 2 mM or 20 μM CaCl2. On the day of the experiment, the culture medium was replaced with 2 mM calcium assay buffer using an automated plate washer (ELx405; Biotek, VT). The cells were incubated in 100 μL/well Fluo-3/AM (2 μM; TEFLabs #0116) with Pluronic F127 (100 μg/mL; Sigma #P2443) for 1 h at rt in the dark. After loading the cells, the dye solution was replaced with 50 μL/well of 20 μM calcium assay buffer using the ELx405 plate washer. Test compounds (50 μL/well) were added to the plate and incubated for 30 min. Intracellular Ca2+ levels were subsequently assayed using a Fluorometric Imaging Plate Reader (FLIPR™ instrument, Molecular Devices, CA) to simultaneously monitor Fluo-3 fluorescence in all wells (λexcitation=488 nm, λemission=540 nm) during challenge with agonist (capsaicin). The IC50 values were determined. Cells were challenged with 150 nM capsaicin and the fluorescence counts were captured following agonist addition at a sampling rate of 0.33 Hz. The contents of the wells were mixed 3 times (40 μL mix volume) immediately after the additions were made. Concentration dependence of block was determined by exposing each well of cells in duplicate rows of a 96 well plate to a serial dilution of test compound. The concentration series usually started at 10 M with a three-fold serial decrement in concentration. The magnitude of the capsaicin response was determined by measuring the change in fluo3 fluorescence before and 100 seconds after the addition of the agonist.
- GCS Enzymatic Assay This assay was modified based on the study by Larsen et al. (J. Lipid Res. 2011, 53, 282). Madin-Darby canine kidney (MDCK) cell lysate was prepared using M-PER Mammalian Protein Extraction Reagent (Thermal Scientific) in the presence of a protease inhibitor cocktail (Roche). Protein concentration was determined using BCA assay kit (Pierce). Sixty micrograms of MDCK cell lysate was incubated with various concentrations of a compound described herein from 0.001 μM-10 μM, respectively, or as indicated in Table 2, in 100 mM Tris buffer (pH 7.5) containing 10 mM MgCl2, 1 mM dithiothreitol, 1 mM EGTA, 2 mM NAD, 100 μM UDP-glucose, 10 μM C6-NBD-Ceramide (Matreya LLC, Pleasant Gap, Pa.), 35 μM dioleoylphosphatidylcholine and 5 μM sulfatide (Sigma) in a final reaction volume of 100 μL at 37° C. for 1 hour. 0.1% DMSO was used as mock treatment or control. The reaction was terminated by adding 100 μL acetonitrile solution and subjected to LC/MS analysis.The quantitative analysis of NBD-Ceramide and glucosylceramide was performed on a Shimadzu ultra-fast liquid chromatography (Shimadzu, Japan) coupled with API 4000 triple quadrupole mass spectrometer (Applied Biosystems, Concord, Ontario, Canada). Sample separation was conducted on a Waters Xbridge BEH130 C18, 100 mm×4.6 mm i.d, 3.5 μm (Milford, Mass., USA). The mobile phase consisted of water and acetonitrile supplemented with 0.1% formic acid (v/v). The flow rate was 1.0 mL/min. The initial mobile phase was 20% acetonitrile and was ramped in a linear fashion to 50% acetonitrile in 0.4 min. From 0.4 to 1.5 min, the gradient was ramped to 98% acetonitrile, and then was held at 100% until 8.0 min. Acetonitrile was reset to 20% in 1.5 min, and maintained until 10.0 min. The total run time was 10.0 min. The MS/MS detection was performed in ESI positive mode. The mass transition of NBD-Ceramide was m/z 576.36→558.40 under the collision energy of 15 V, and the mass transition of glucosylceramide was m/z 738.35-558.40 under 21V collision energy. The cell lysate was diluted with equal volume of acetonitrile. Aliquots of 50 μL diluted samples were added to 1.5 mL tubes, and 100 μL of acetonitrile containing internal standard (100 ng/mL tolbutamide) were added for protein precipitation. The mixture were vortexed and then centrifuged at 13000 rpm for 10 min. 70 μL of supernatant were mixed with 140 μL of H2O and the final solution were injected for LC/MS/MS analysis and IC50's and/or percent inhibitions calculated.
- Intracellular Ca2+ Mobilization Assay A monoclonal HEK-293 cell line stably transfected with a cDNA encoding for the human mGlu5a receptor was generated; for the work with mGlu5 Positive Allosteric Modulators (PAMs), a cell line with low receptor expression levels and low constitutive receptor activity was selected to allow the differentiation of agonistic versus PAM activity. Cells were cultured according to standard protocols (Freshney, 2000) in Dulbecco's Modified Eagle Medium with high glucose supplemented with 1 mM glutamine, 10% (vol/vol) heat-inactivated bovine calf serum, Penicillin/Streptomycin, 50 μg/ml hygromycin and 15 μg/ml blasticidin (all cell culture reagents and antibiotics from Invitrogen, Basel, Switzerland).About 24 hrs before an experiment, 5×10⁴ cells/well were seeded in poly-D-lysine coated, black/clear-bottomed 96-well plates. The cells were loaded with 2.5 μM Fluo-4AM in loading buffer (1×HBSS, 20 mM HEPES) for 1 hr at 37° C. and washed five times with loading buffer. The cells were transferred into a Functional Drug Screening System 7000 (Hamamatsu, Paris, France), and 11 half logarithmic serial dilutions of test compound at 37° C. were added and the cells were incubated for 10-30 min with on-line recording of fluorescence. Following this pre-incubation step, the agonist L-glutamate was added to the cells at a concentration corresponding to EC20 (typically around 80 μM) with on-line recording of fluorescence; in order to account for day-to-day variations in the responsiveness of cells, the EC20 of glutamate was determined immediately ahead of each experiment by recording of a full dose-response curve of glutamate.Responses were measured as peak increase in fluorescence minus basal (i.e. fluorescence without addition of L-glutamate), normalized to the maximal stimulatory effect obtained with saturating concentrations of L-glutamate. Graphs were plotted with the % maximal stimulatory using XLfit, a curve fitting program that iteratively plots the data using Levenburg Marquardt algorithm. The single site competition analysis equation used was y=A+((B−A)/(1+((x/C)D))), where y is the % maximal stimulatory effect, A is the minimum y, B is the maximum y, C is the EC50, x is the log 10 of the concentration of the competing compound and D is the slope of the curve (the Hill Coefficient). From these curves the EC50 (concentration at which half maximal stimulation was achieved), the Hill coefficient as well as the maximal response in % of the maximal stimulatory effect obtained with saturating concentrations of L-glutamate were calculated.
- Determination of EC50 values using a Ca2+ mobilization in vitro assay on recombinant human mGlu4 expressed in HEK293 cells A monoclonal HEK-293 cell line stably transfected with a cDNA encoding for the human mGlu4 receptor was generated; for the work with mGlu4 Positive Allosteric Modulators (PAMs), a cell line with low receptor expression levels and low constitutive receptor activity was selected to allow the differentiation of agonistic versus PAM activity. Cells were cultured according to standard protocols (Freshney, 2000) in Dulbecco's Modified Eagle Medium with high glucose supplemented with 1 mM glutamine, 10% (vol/vol) heat-inactivated bovine calf serum, Penicillin/Streptomycin, 50 μg/ml hygromycin and 15 μg/ml blasticidin (all cell culture reagents and antibiotics from Invitrogen, Basel, Switzerland).About 24 hrs before an experiment, 5×10⁴ cells/well were seeded in poly-D-lysine coated, black/clear-bottomed 96-well plates. The cells were loaded with 2.5 μM Fluo-4AM in loading buffer (1×HBSS, 20 mM HEPES) for 1 hr at 37° C. and washed five times with loading buffer. The cells were transferred into a Functional Drug Screening System 7000 (Hamamatsu, Paris, France), and 11 half logarithmic serial dilutions of test compound at 37° C. were added and the cells were incubated for 10-30 min. with on-line recording of fluorescence. Following this pre-incubation step, the agonist (2S)-2-amino-4-phosphonobutanoic acid (L-AP4) was added to the cells at a concentration corresponding to EC20 with on-line recording of fluorescence; in order to account for day-to-day variations in the responsiveness of cells, the EC20 of L-AP4 was determined immediately ahead of each experiment by recording of a full dose-response curve of L-AP4. Responses were measured as peak increase in fluorescence minus basal (i.e. fluorescence without addition of L-AP4), normalized to the maximal stimulatory effect obtained with saturating concentrations of L-AP4. Graphs were plotted with the % maximal stimulatory using XLfit, a curve fitting program that iteratively plots the data using Levenburg Marquardt algorithm. The single site competition analysis equation used was y=A+((B-A)/(1+((x/C)D))), where y is the % maximal stimulatory effect, A is the minimum y, B is the maximum y, C is the EC50, x is the log 10 of the concentration of the competing compound and D is the slope of the curve (the Hill Coefficient). From these curves the EC50 (drug concentration at which 50% of the maximal receptor activation was achieved), the Hill coefficient as well as the maximal response in % of the maximal stimulatory effect obtained with saturating concentrations of L-AP4 were calculated.
- In Vitro SGLT2 Inhibitory Activity Assay 1. Materials and methods(1) MaterialsThe humanized SGLT2 overexpression cells (CHO-SGLT2) constructed from Chinese hamster ovary (CHO) cells were cultured in 1640 medium (Gibco) containing 10% fetal bovine serum (Gibco, 10270), subcultured at a ratio of 1:3, and replaced with new culture medium 3 times every week. Fluorescence detection cell culture plates and other culture flasks were purchased from Corning Company. Dapagliflozin was used as a positive control, and the test compounds were compound 2 and compound 3. Appropriate amounts of all compounds were weighed, prepared into 100 mM stock solutions with DMSO, and stored at 4° C. in the dark.(2) Main reagentsPreparation of choline buffer: 140 mM choline chloride, 5 mM KCl, 2.5 mM CaCl2, 1 mM MgSO4, 1 mM KH2PO4, 10 mM HEPES, pH adjusted to 7.4 with Tris base. The filtration was conducted with a 0.22 m membrane.Preparation of Na+ sodium buffer: 140 mM NaCl, 5 mM KCl, 2.5 mM CaCl2, 1 mM MgSO4, 1 mM KH2PO4, 10 mM HEPES, pH adjusted to 7.4 with Tris basePreparation of neutral lysate: 1% Nonidet P-40, 1% sodium deoxycholate, 40 mM KCl, pH adjusted to 20 mM Tris base.(3) InstrumentsMultifunctional microplate reader Biotek Synergy2(4) Detection of uptake of NBDG by cells:Before the 1-NBDG uptake test, CHO-SGLT2 cells were digested and seeded in a 96-well cell culture plate with a cell number of 40,000/well. After the cells were cultured for 48 h, the medium was discarded, and 100 μl of choline buffer was added to each well. After the cells were starved at 37° C. for 30 min, the choline buffer was discarded and 100 μl of the newly prepared Na+ sodium buffer containing 100 M 1-NBDG and the test compounds (Compound) was added. The solvent DMSO was used as the negative control (Control) for the test compounds.The Na+ sodium buffer without 1-NBDG was used as the blank control (Blank). After 1 h of culture, the incubation solution was discarded. The cells were washed with choline buffer solution 3 times, and then 50 μl of neutral lysate was added to each well to lyse the cells on ice for 10 min. The fluorescence value of each well was detected using a multi-functional microplate reader at Em=485/20 nm and Ex=528/20 nm.(5) Calculation and statistical methodsAt least 3 experimental replicates were set for each compound at indicated concentrations, and the data were expressed as mean±SEM. Uptake amount of 1-NBDG by cells=fluorescence value1-NBDG-fluorescence valueBlank. Inhibition rate on uptake amount of SGLT2 glucose (%)=(uptake amountcontrol−uptake amountcompound)/uptake amountcontrol×100%. Concentration-inhibition rate curves were plotted using Graphpad Prism software, and IC50 values were calculated accordingly.
- Radioligand Binding (rat TAAR1) HEK-293 cells stably expressing rat TAAR1 were maintained at 37 ° C. and 5% CO2 in DMEM high glucose medium, containing fetal calf serum (10%, heat inactivated for 30 min at 56 ° C.), penicillin/streptomycin (1%), and 375 g/ml geneticin (Gibco). Cells were released from culture flasks using trypsin/EDTA, harvested, washed twice with ice-cold PBS (without Ca2+ and Mg2+), pelleted at 1'000 rpm for 5 min at 4 ° C., frozen and stored at 80 ° C. Frozen pellets were suspended in 20 ml HEPES-NaOH (20 mM, pH 7.4) containing 10 mM EDTA and homogenized with a Polytron (PT 6000, Kinematica) at 14'000 rpm for 20 s. The homogenate was centrifuged at 48'000 g for 30 min at 4 ° C. Subsequently, the supernatant was removed and discarded, and the pellet resuspended in 20 ml HEPES-NaOH (20 mM, pH 7.4) containing 0.1 mM EDTA using the Polytron (20 s at 14'000 rpm). This procedure was repeated and the final pellet resuspended in HEPES-NaOH containing 0.1 mM EDTA and homogenized using the Polytron. Typically, aliquots of 2 ml membrane portions were stored at 80 ° C. With each new membrane batch the dissociation constant (Kd) was determined via a saturation curve. The TAAR1 radioligand 3[H] (S)-4-[(ethyl-phenyl-amino)-methyl]-4,5-dihydro-oxazol-2-ylamine (described in WO 2008/098857) was used at a concentration equal to the calculated Kd value, that was usually around 2.3 nM, resulting in the binding of approximately 0.2% of the radioligand and a specific binding representing approximately 85% of the total binding. Nonspecific binding was defined as the amount of 3[H] (S)-4-[(ethyl-phenyl-amino)-methyl]-4,5-dihydro-oxazol-2-ylamine bound in the presence of 10 M unlabeled ligand. All compounds were tested at a broad range of concentrations (10 M to 10 M) in duplicates. The test compounds (20 l/well) were transferred into a 96 deep well plate (TreffLab), and 180 l of HEPES-NaOH (20 mM, pH 7.4) containing MgCl2 (10 mM) and CaCl2 (2 mM) (binding buffer), 300 l of the radioligand 3[H] (S)-4-[(ethyl-phenyl-amino)-methyl]-4,5-dihydro-oxazol-2-ylamine at a concentration of 3.3 Kd in nM and 500 l of the membranes (resuspended at 50 g protein per ml) added. The 96 deep well plates were incubated for 1 hr at 4 ° C. Incubations were terminated by rapid filtration through Unifilter-96 plates (Packard Instrument Company) and glass filters GF/C (Perkin Elmer) presoaked for 1 hr in polyethylenimine (0.3%) and washed 3 times with 1 ml of cold binding buffer. After addition of 45 l of Microscint 40 (PerkinElmer) the Unifilter-96 plate was sealed and after 1 hr the ratioactivity counted using a TopCount Microplate Scintillation Counter (Packard Instrument Company).
- Radioligand Binding Mouse:HEK-293 cells stably expressing mouse TAAR1 were maintained at 37° C. and 5% CO2 in DMEM high glucose medium, containing fetal calf serum (10%, heat inactivated for 30 min at 56° C.), penicillin/streptomycin (1%), and 375 μg/ml geneticin (Gibco). Cells were released from culture flasks using trypsin/EDTA, harvested, washed twice with ice-cold PBS (without Ca2+ and Mg2+), pelleted at 1′000 rpm for 5 min at 4° C., frozen and stored at −80° C. Frozen pellets were suspended in 20 ml HEPES-NaOH (20 mM, pH 7.4) containing 10 mM EDTA and homogenized with a Polytron (PT 6000, Kinematica) at 14,000 rpm for 20 s. The homogenate was centrifuged at 48,000×g for 30 min at 4° C. Subsequently, the supernatant was removed and discarded, and the pellet resuspended in 20 ml HEPES-NaOH (20 mM, pH 7.4) containing 0.1 mM EDTA using the Polytron (20 s at 14,000 rpm). This procedure was repeated and the final pellet resuspended in HEPES-NaOH containing 0.1 mM EDTA and homogenized using the Polytron. Typically, aliquots of 2 ml membrane portions were stored at −80° C. With each new membrane batch the dissociation constant (Kd) was determined via a saturation curve. The TAAR1 radioligand 3[H](S)-4-[(ethyl-phenyl-amino)-methyl]-4,5-dihydro-oxazol-2-ylamine (described in WO 2008/098857) was used at a concentration equal to the calculated Kd value, that was usually around 0.7 nM, resulting in the binding of approximately 0.5% of the radioligand and a specific binding representing approximately 70% of(S)-4-[(ethyl-phenyl-amino)-methyl]-4,5-dihydro-oxazol-2-ylamine bound in the presence of 10 μM unlabeled ligand. All compounds were tested at a broad range of concentrations (10 pM to 10 μM) in duplicates. The test compounds (20□ μl/well) were transferred into a 96 deep well plate (TreffLab), and 180 μl of HEPES-NaOH (20 mM, pH 7.4) containing MgCl2 (10 mM) and CaCl2 (2 mM) (binding buffer), 300 μl of the radioligand 3[H](S)-4-[(ethyl-phenyl-amino)-methyl]-4,5-dihydro-oxazol-2-ylamine at a concentration of 3.3×Kd in nM and 500 μl of the membranes (resuspended at 60 g protein per ml) added. The 96 deep well plates were incubated for 1 hr at 4° C. Incubations were terminated by rapid filtration through Unifilter-96 plates (Packard Instrument Company) and glass filters GF/C (Perkin Elmer) presoaked for 1 hr in polyethylenimine (0.3%) and washed 3 times with 1 ml of cold binding buffer. After addition of 45 μl of Microscint 40 (PerkinElmer) the Unifilter-96 plate was sealed and after 1 hr the radioactivity counted using a TopCount Microplate Scintillation Counter (Packard Instrument Company).
- Calcium Flux Assay This assay was used to test compounds for their ability to inhibit TARP γ8 dependent AMPA receptor activity. The AMPA receptor is a non-selective cation channel activated by glutamate. Ionotropic glutamate receptors normally desensitize too rapidly to allow detectable calcium influx in a FLIPR assay (Strange et al. (2006). Functional characterisation of homomeric ionotropic glutamate receptors GluR1-GluR6 in a fluorescence-based high throughput screening assay. Comb Chem High Throughput Screen 9(2): 147-158). But, this desensitization is incomplete, and a substantial steady-state current remains in the sustained presence of glutamate (Cho et al. (2007). Two families of TARP isoforms that have distinct effects on the kinetic properties of AMPA receptors and synaptic currents. Neuron 55(6): 890-904).An in vitro assay was used to determine the potency of test compounds as inhibitors of the glutamate response of the channel formed by GluA10-γ8. To ensure a 1:1 stoichiometry of GluA1o and γ8 subunits in the expressed channel, a fusion of the cDNAs for GRIA1o and CACNG8 was used. Following Shi et al (2009) The stoichiometry of AMPA receptors and TARPs varies by neuronal cell type. Neuron 62(5): 633-640), the C-terminus of the cDNA for GRIA1o was fused to the N-terminus of the cDNA for γ8. The linker sequence was QQQQQQQQQQEFAT. Channels expressed with this construct appear to have similar properties to channels formed by co-expression of GRIA1o with an excess of CACNG8 (Shi et al. 2009). A clonal cell line in HEK293 cells stably expressing this construct, with a geneticin selection marker, was generated for use in this assay.Cell expressing the GRIA1o-CACNG8 fusion construct were grown in a monolayer in 96- or 384-well microtiter plates. They were washed with assay buffer (135 mM NaCl, 4 mM KCl, 3 mM CaCl2, 1 mM MgCl2, 5 mM glucose, 10 mM HEPES, pH 7.4, 300 mOs) using a Biotek EL405 plate washer. The cells were then loaded with a calcium-sensitive dye (Calcium-5 or Calcium-6, Molecular Devices) and the test compounds at a range of concentrations. Calcium flux following the addition of 15 μM glutamate was monitored using a Molecular Devices FLIPR Tetra.The fluorescence in each well was normalized to the fluorescence of negative and positive control wells. The negative control wells had no added compounds, and the positive control wells had been incubated with 10 μM CP465022 (a non-subtype-selective AMPA receptor antagonist) (Lazzaro et al. (2002). Functional characterization of CP-465,022, a selective, noncompetitive AMPA receptor antagonist. Neuropharmacology 42(2): 143-153). The responses to glutamate as functions of the test compound concentrations were fitted to a four-parameter logistic function. The fitted parameter corresponding to the midpoint was taken to be the potency of inhibition of the compound. The data in Table 4 below illustrates the observed potency for the compounds described herein. pIC50 refers to the negative log of the IC50 in molar.
- Calcium Flux Assay This assay was used to test compounds for their ability to inhibit TARP γ8 dependent AMPA receptor activity. The AMPA receptor is a non-selective cation channel activated by glutamate. Ionotropic glutamate receptors normally desensitize too rapidly to allow detectable calcium influx in a FLIPR assay (Strange et al. (2006). Functional characterisation of homomeric ionotropic glutamate receptors GluR1-GluR6 in a fluorescence-based high throughput screening assay. Comb Chem High Throughput Screen 9(2): 147-158). But, this desensitization is incomplete, and a substantial steady-state current remains in the sustained presence of glutamate (Cho et al. (2007). Two families of TARP isoforms that have distinct effects on the kinetic properties of AMPA receptors and synaptic currents. Neuron 55(6): 890-904).An in vitro assay was used to determine the potency of test compounds as inhibitors of the glutamate response of the channel formed by GluA1o-γ8. To ensure a 1:1 stoichiometry of GluA10 and γ8 subunits in the expressed channel, a fusion of the cDNAs for GRIA1o and CACNG8 was used. Following Shi et al (2009) The stoichiometry of AMPA receptors and TARPs varies by neuronal cell type. Neuron 62(5): δ 33-640), the C-terminus of the cDNA for GRI1o was fused to the N-terminus of the cDNA for γ8. The linker sequence was QQQQQQQQQQEFAT. Channels expressed with this construct appear to have similar properties to channels formed by co-expression of GRI1o with an excess of CACNG8 (Shi et al. 2009). A clonal cell line in HEK293 cells stably expressing this construct, with a geneticin selection marker, was generated for use in this assay. Cell expressing the GRIA1o-CACNG8 fusion construct were grown in a monolayer in 96- or 384-well microtiter plates. They were washed with assay buffer (135 mM NaCl, 4 mM KCl, 3 mM CaCl2, 1 mM MgCl2, 5 mM glucose, 10 mM HEPES, pH 7.4, 300 mOs) using a Biotek EL405 plate washer. The cells were then loaded with a calcium-sensitive dye (Calcium-5 or Calcium-6, Molecular Devices) and the test compounds at a range of concentrations. Calcium flux following the addition of 15 μM glutamate was monitored using a Molecular Devices FLIPR Tetra.The fluorescence in each well was normalized to the fluorescence of negative and positive control wells. The negative control wells had no added compounds, and the positive control wells had been incubated with 10 μM CP465022 (a non-subtype-selective AMPA receptor antagonist) (Lazzaro et al. (2002). Functional characterization of CP-465,022, a selective, noncompetitive AMPA receptor antagonist. Neuropharmacology 42(2): 143-153). The responses to glutamate as functions of the test compound concentrations were fitted to a four-parameter logistic function. The fitted parameter corresponding to the midpoint was taken to be the potency of inhibition of the compound. The data in Table 3 below illustrates the observed potency for the compounds described herein. pIC50 refers to the negative log of the IC50 in molar.
- Characterization of Agonism of Human D2L Receptors Using Cyclic Adenosine Monophosphate Detection Agonist activity at human D2L receptors was assayed by measuring cAMP levels in CHO-K1 cells expressing human D2L receptors (Eurofins DiscoverX, Fremont, CA, USA) by homogenous time-resolved fluorescence (HTRF®) using the cAMP Gi kit (Cisbio/PerkinElmer). CHO-K1 cells expressing human D2L receptors were cultured in Ham's F12 medium supplemented with 10% FBS, 1% penicillin-streptomycin antimycotic solution, and 800 μg/mL G418 (Thermo Fisher Scientific, Waltham, MA, USA) and maintained at 37° C. in a humidified atmosphere containing 5.0% CO2. For the cAMP measurements, cryopreserved cells were thawed, and seeded in white-walled, half area 96-well plates at 10,000 cells/well in PathHunter® AssayComplete™ Cell Plating 2 (CP2) reagent (Eurofins DiscoverX) and incubated overnight at 37° C. in a humidified atmosphere with 5.0% CO2. Prior to the cAMP measurement, the CP2 reagent was removed from the cells and replaced with 20 μL compound or vehicle containing assay buffer (140 mM NaCl, 5 mM KCl, 2 mM MgCl2, 2 mM CaCl2, 10 mM 2-[4-(2-hydroxyethyl)piperazin-1-yl ]ethane-1-sulfonic acid (HEPES), 10 mM glucose, pH 7.4) supplemented with 100 μM IBMX and incubated at ambient temperature for 20 minutes. After an additional 30-minute incubation step at ambient temperature with 0.5 μM forskolin (Eurofins DiscoverX), cell stimulation was stopped by adding the detection reagents (20 μL cAMP-d2 and 20 μL anti-cAMP cryptate, Cisbio/PerkinElmer) diluted in lysis buffer. The time-resolved fluorescence signal was quantified with a PHERAstar FS multimode reader (BMG Labtech, Ortenberg, Germany) using standard HTRF® settings with laser excitation at 337 nm after 60 minutes of incubation at ambient temperature. Results were calculated from the ratio of acceptor fluorescence signal (A665 nm) and donor fluorescence signal (A620 nm)×104 and expressed as ΔF % values using the following formula: 100×(Ratio Sample−Ratio Negative Control)/Ratio Negative Control. In experiments, all treatments were measured in multiple wells in parallel, and the mean ΔF % values were used for further analysis. Agonist activity values were calculated as percentage of inhibition of forskolin-stimulated cAMP accumulation normalized to the response evoked by a maximally effective concentration of dopamine tested in the same experiment. All calculations were done using Microsoft Excel® (Microsoft, Redmond, WA, USA). The pEC50 values shown in Table 5 (the negative logarithm of the concentration, expressed in mol/liter, of the agonist that produces 50% inhibition of forskolin-stimulated cAMP accumulation) were obtained by fitting 4-parameter sigmoidal curves to the concentration-effect data with the lower asymptote constrained to zero using GraphPad Prism (GraphPad, San Diego, CA, USA). The results indicate that the examples of the present disclosure are potent agonists of the G-protein-coupled signaling pathway of human recombinant D2L receptors.
- GIRK1/4 Activity Assay The GIRK1/4 activity of a compound according to the present invention was assessed by the following in vitro method.Buffers:a. External buffer: 10 mM NaCl, 50 mM Na Gluconate, 80 mM K Gluconate, 1.8 mM CaCl2, 1 mM MgCl2, 10 mM HEPES, 10 mM Glucose, pH 7.4; osmolarity 300-310 Osm/L.b. Internal buffer: 30 mM KCl, 100 mM K Gluconate, 1 mM MgCl2, 10 mM HEPES, 1 mM EGTA, 10 mM NaCl, pH 7.2; osmolarity 284-292 Osm/L.Compounds:c. Prepare seven-fold compound dilution series (10 mM to 20 uM) in 100% DMSO, in 384-well polypropylene plates.d. Propafenone (Sigma Aldrich, catalog number P4670) was used as a positive control and DMSO for neutral controle. Resuspend 1 μl of compounds in DMSO into 66.7 μl external buffer in 384-well polypropylene plate and load into Plate 1 section of Molecular Devices Quattro Quattro Setup:f. Load 384-well Population Patch Plate (Molecular Devices #9000-0902) into Quattrog. Fill Quattro F-soak trough with 20% DMSO and 50% EtOHh. Fill Quattro buffer trough with external bufferi. Attach internal buffer flask to Quattro internal buffer tubingj. Attach PBS (Phosphate Buffered Saline, minus Ca++ and Mg++, pH7.4) bottle to F-head & E-head wash on QuattroAntibiotic:k. Resuspend 5.1-5.8 mg amphotericin B (Sigma Aldrich, catalog number A2411) in 175 μl DMSOl. Add the resulting solution to 50 mL internal buffer and attach to antibiotic tubing port on QuattroCells:m. Use GIRK1/4 HEK293 stable cells (obtained from ChanTest, 14656 Neo Parkway, Cleveland, Ohio 44128) grown to 80% confluency in the following cell culture medium: DMEM containing 10% (v/v) Fetal Bovine Serum, Penicillin/Streptomycin (at IX concentration from a 100× stock), 0.5 mg/mL G418 and 0.1 mg/mL Zeocin.n. Detach cells using Detachin (Genlantis, 11011 Torreyana, San Diego, CA 92121), washed with PBS (minus Ca++ and Mg++) and resuspend in external buffer (5 mL final volume at 2.0-2.1×10⁶ cells/mL)o. Load into cell trough of QuattroAssay Protocol:Quattro was controlled using IonWorks v2 software to perform the following steps:p. Added 3.5 μl cells plus 3.5 μl external buffer to wells of Quattro Patch Plate q. Circulated amphotericin B and internal buffer onto cellsr. Applied the following voltage protocol: Pulse 1: 15 mV for 300 milliseconds (ms), followed by Pulse 2: −120 mV for 400 ms, then Pulse 3: −15 mV for 400 ms, and finally Pulse 4: −120 mV to 40 mV over 500 ms (this is a voltage ramp).s. Measured magnitude of inward potassium current at time point between 1200-1220 ms from start of Pulse 1 (i.e., during the voltage ramp phase).t. Added 3.5 μl of diluted compounds (or DMSO) to wells and repeated steps c-d (final compound concentrations are 50 uM to 0.1 uM, and each concentration was tested in quadruplicate i.e., in 4 separate wells).u. The difference between current magnitude pre vs. post-compound gave a measure of GIRK1/4 inhibition.
- Radioligand Binding (mouse TAAR1) HEK-293 cells stably expressing mouse TAAR1 were maintained at 37° C. and 5% CO2 in DMEM high glucose medium, containing fetal calf serum (10%, heat inactivated for 30 min at 56° C.), penicillin/streptomycin (1%), and 375 μg/ml geneticin (Gibco). Cells were released from culture flasks using trypsin/EDTA, harvested, washed twice with ice-cold PBS (without Ca2+ and Mg2+), pelleted at 1'000 rpm for 5 min at 4μ C., frozen and stored at −80° C. Frozen pellets were suspended in 20 ml HEPES-NaOH (20 mM, pH 7.4) containing 10 mM EDTA and homogenized with a Polytron (PT 6000, Kinematica) at 14'000 rpm for 20 s. The homogenate was centrifuged at 48'000×g for 30 min at 4° C. Subsequently, the supernatant was removed and discarded, and the pellet resuspended in 20 ml HEPES-NaOH (20 mM, pH 7.4) containing 0.1 mM EDTA using the Polytron (20 s at 14'000 rpm). This procedure was repeated and the final pellet resuspended in HEPES-NaOH containing 0.1 mM EDTA and homogenized using the Polytron. Typically, aliquots of 2 ml membrane portions were stored at −80° C. With each new membrane batch the dissociation constant (Kd) was determined via a saturation curve. The TAAR1 radioligand 3[H]−(S)-4-[(ethyl-phenyl-amino)-methyl]-4,5-dihydro-oxazol-2-ylamine (described in WO 2008/098857) was used at a concentration equal to the calculated Kd value, that was usually around 0.7 nM, resulting in the binding of approximately 0.5% of the radioligand and a specific binding representing approximately 70% of the total binding. Nonspecific binding was defined as the amount of 3[H]−(S)-4-[(ethyl-phenyl-amino)-methyl]-4,5-dihydro-oxazol-2-ylamine bound in the presence of 10 μM unlabeled ligand. All compounds were tested at a broad range of concentrations (10 pM to 10 μM) in duplicates. The test compounds (20 μl/well) were transferred into a 96 deep well plate (TreffLab), and 180 μl of HEPES-NaOH (20 mM, pH 7.4) containing MgCl2 (10 mM) and CaCl2 (2 mM) (binding buffer), 300 μl of the radioligand 3[H]−(S)-4-[(ethyl-phenyl-amino)-methyl]-4,5-dihydro-oxazol-2-ylamine at a concentration of 3.3×Kd in nM and 500 μl of the membranes (resuspended at 60 μg protein per ml) added. The 96 deep well plates were incubated for 1 hr at 4° C. Incubations were terminated by rapid filtration through Unifilter-96 plates (Packard Instrument Company) and glass filters GF/C (Perkin Elmer) presoaked for 1 hr in polyethylenimine (0.3%) and washed 3 times with 1 ml of cold binding buffer. After addition of 45 μl of Microscint 40 (PerkinElmer) the Unifilter-96 plate was sealed and after 1 hr the ratioactivity counted using a TopCount Microplate Scintillation Counter (Packard Instrument Company).
- Radioligand Binding Assay HEK-293 cells stably expressing mouse TAAR1 were maintained at 37° C. and 5% CO2 in DMEM high glucose medium, containing fetal calf serum (10%, heat inactivated for 30 min at 56° C.), penicillin/streptomycin (1%), and 375 ug/ml geneticin (Gibco). Cells were released from culture flasks using trypsin/EDTA, harvested, washed twice with ice-cold PBS (without Ca2+ and Mg2+), pelleted at 1,000 rpm for 5 min at 4° C., frozen and stored at -80° C. Frozen pellets were suspended in 20 ml HEPES-NaOH (20 mM, pH 7.4) containing 10 mM EDTA and homogenized with a Polytron (PT 6000, Kinematica) at 14,000 rpm for 20 s. The homogenate was centrifuged at 48,000 g for 30 min at 4° C. Subsequently, the supernatant was removed and discarded, and the pellet resuspended in 20 ml HEPES-NaOH (20 mM, pH 7.4) containing 0.1 mM EDTA using the Polytron (20 s at 14,000 rpm). This procedure was repeated and the final pellet resuspended in HEPES-NaOH containing 0.1 mM EDTA and homogenized using the Polytron. Typically, aliquots of 2 ml membrane portions were stored at -80° C. With each new membrane batch the dissociation constant (Kd) was determined via a saturation curve. The TAAR1 radioligand 3[H] (S)-4-[(ethyl-phenyl-amino)-methyl]-4,5-dihydro-oxazol-2-ylamine (described in WO 2008/098857) was used at a concentration equal to the calculated Kd value, that was usually around 2.3 nM, resulting in the binding of approximately 0.2% of the radioligand and a specific binding representing approximately 85% of the total binding. Nonspecific binding was defined as the amount of 3[H] (S)-4-[(ethyl-phenyl-amino)-methyl]-4,5-dihydro-oxazol-2-ylamine bound in the presence of 10 uM unlabeled ligand. All compounds were tested at a broad range of concentrations (10 pM to 10 uM) in duplicates. The test compounds (20 ul/well) were transferred into a 96 deep well plate (TreffLab), and 180 ul of HEPES-NaOH (20 mM, pH 7.4) containing MgCl2 (10 mM) and CaCl2 (2 mM) (binding buffer), 300 ul of the radioligand 3[H] (S)-4-[(ethyl-phenyl-amino)-methyl]-4,5-dihydro-oxazol-2-ylamine at a concentration of 3.3xKd in nM and 500 ul of the membranes (resuspended at 50 ug protein per ml) added. The 96 deep well plates were incubated for 1 hr at 4° C. Incubations were terminated by rapid filtration through Unifilter-96 plates (Packard Instrument Company) and glass filters GF/C (Perkin Elmer) presoaked for 1 hr in polyethylenimine (0.3%) and washed 3 times with 1 ml of cold binding buffer. After addition of 45 ul of Microscint 40 (PerkinElmer) the Unifilter-96 plate was sealed and after 1 hr the ratioactivity counted using a TopCount Microplate Scintillation Counter (Packard Instrument Company).
- Radioligand Binding Assay HEK-293 cells stably expressing mouse TAAR1 were maintained at 37° C. and 5% CO2 in DMEM high glucose medium, containing fetal calf serum (10%, heat inactivated for 30 min at 56° C.), penicillin/streptomycin (1%), and 375 ug/ml geneticin (Gibco). Cells were released from culture flasks using trypsin/EDTA, harvested, washed twice with ice-cold PBS (without Ca2+ and Mg2+), pelleted at 1,000 rpm for 5 min at 4° C., frozen and stored at -80° C. Frozen pellets were suspended in 20 ml HEPES-NaOH (20 mM, pH 7.4) containing 10 mM EDTA and homogenized with a Polytron (PT 6000, Kinematica) at 14,000 rpm for 20 s. The homogenate was centrifuged at 48,000xg for 30 min at 4° C. Subsequently, the supernatant was removed and discarded, and the pellet resuspended in 20 ml HEPES-NaOH (20 mM, pH 7.4) containing 0.1 mM EDTA using the Polytron (20 s at 14,000 rpm). This procedure was repeated and the final pellet resuspended in HEPES-NaOH containing 0.1 mM EDTA and homogenized using the Polytron. Typically, aliquots of 2 ml membrane portions were stored at -80° C. With each new membrane batch the dissociation constant (Kd) was determined via a saturation curve. The TAAR1 radioligand 3[H]-(S)-4-[(ethyl-phenyl-amino)-methyl]-4,5-dihydro-oxazol-2-ylamine (described in WO 2008/098857) was used at a concentration equal to the calculated Kd value, that was usually around 2.3 nM, resulting in the binding of approximately 0.2% of the radioligand and a specific binding representing approximately 85% of the total binding. Nonspecific binding was defined as the amount of 3[H]-(S)-4-[(ethyl-phenyl-amino)-methyl]-4,5-dihydro-oxazol-2-ylamine bound in the presence of 10 uM unlabeled ligand. All compounds were tested at a broad range of concentrations (10 pM to 10 uM) in duplicates. The test compounds (20 ul/well) were transferred into a 96 deep well plate (TreffLab), and 180 ul of HEPES-NaOH (20 mM, pH 7.4) containing MgCl2 (10 mM) and CaCl2 (2 mM) (binding buffer), 300 ul of the radioligand 3[H]-(S)-4-[(ethyl-phenyl-amino)-methyl]-4,5-dihydro-oxazol-2-ylamine at a concentration of 3.3xKd in nM and 500 ul of the membranes (resuspended at 50 ug protein per ml) added. The 96 deep well plates were incubated for 1 hr at 4° C. Incubations were terminated by rapid filtration through Unifilter-96 plates (Packard Instrument Company) and glass filters GF/C (Perkin Elmer) presoaked for 1 hr in polyethylenimine (0.3%) and washed 3 times with 1 ml of cold binding buffer. After addition of 45 ul of Microscint 40 (PerkinElmer) the Unifilter-96 plate was sealed and after 1 hr the radioactivity counted using a TopCount Microplate Scintillation Counter (Packard Instrument Company).
- Radioligand Binding Assay HEK-293 cells stably expressing rat TAAR1 were maintained at 37° C. and 5% CO2 in DMEM high glucose medium, containing fetal calf serum (10%, heat inactivated for 30 min at 56° C.), penicillin/streptomycin (1%), and 375 ug/ml geneticin (Gibco). Cells were released from culture flasks using trypsin/EDTA, harvested, washed twice with ice-cold PBS (without Ca2+ and Mg2+), pelleted at 1,000 rpm for 5 min at 4° C., frozen and stored at -80° C. Frozen pellets were suspended in 20 ml HEPES-NaOH (20 mM, pH 7.4) containing 10 mM EDTA and homogenized with a Polytron (PT 6000, Kinematica) at 14,000 rpm for 20 s. The homogenate was centrifuged at 48,000 g for 30 min at 4° C. Subsequently, the supernatant was removed and discarded, and the pellet resuspended in 20 ml HEPES-NaOH (20 mM, pH 7.4) containing 0.1 mM EDTA using the Polytron (20 s at 14,000 rpm). This procedure was repeated and the final pellet resuspended in HEPES-NaOH containing 0.1 mM EDTA and homogenized using the Polytron. Typically, aliquots of 2 ml membrane portions were stored at -80° C. With each new membrane batch the dissociation constant (Kd) was determined via a saturation curve. The TAAR1 radioligand 3[H] (S)-4-[(ethyl-phenyl-amino)-methyl]-4,5-dihydro-oxazol-2-ylamine (described in WO 2008/098857) was used at a concentration equal to the calculated Kd value, that was usually around 2.3 nM, resulting in the binding of approximately 0.2% of the radioligand and a specific binding representing approximately 85% of the total binding. Nonspecific binding was defined as the amount of 3[H] (S)-4-[(ethyl-phenyl-amino)-methyl]-4,5-dihydro-oxazol-2-ylamine bound in the presence of 10 uM unlabeled ligand. All compounds were tested at a broad range of concentrations (10 pM to 10 uM) in duplicates. The test compounds (20 ul/well) were transferred into a 96 deep well plate (TreffLab), and 180 ul of HEPES-NaOH (20 mM, pH 7.4) containing MgCl2 (10 mM) and CaCl2 (2 mM) (binding buffer), 300 ul of the radioligand 3[H] (S)-4-[(ethyl-phenyl-amino)-methyl]-4,5-dihydro-oxazol-2-ylamine at a concentration of 3.3xKd in nM and 500 ul of the membranes (resuspended at 50 ug protein per ml) added. The 96 deep well plates were incubated for 1 hr at 4° C. Incubations were terminated by rapid filtration through Unifilter-96 plates (Packard Instrument Company) and glass filters GF/C (Perkin Elmer) presoaked for 1 hr in polyethylenimine (0.3%) and washed 3 times with 1 ml of cold binding buffer. After addition of 45 ul of Microscint 40 (PerkinElmer) the Unifilter-96 plate was sealed and after 1 hr the ratioactivity counted using a TopCount Microplate Scintillation Counter (Packard Instrument Company).
- Radioligand Binding Assay HEK-293 cells stably expressing rat TAAR1 were maintained at 37° C. and 5% CO2 in DMEM high glucose medium, containing fetal calf serum (10%, heat inactivated for 30 min at 56° C.), penicillin/streptomycin (1%), and 375 ug/ml geneticin (Gibco). Cells were released from culture flasks using trypsin/EDTA, harvested, washed twice with ice-cold PBS (without Ca2+ and Mg2+), pelleted at 1,000 rpm for 5 min at 4° C., frozen and stored at -80° C. Frozen pellets were suspended in 20 ml HEPES-NaOH (20 mM, pH 7.4) containing 10 mM EDTA and homogenized with a Polytron (PT 6000, Kinematica) at 14,000 rpm for 20 s. The homogenate was centrifuged at 48,000xg for 30 min at 4° C. Subsequently, the supernatant was removed and discarded, and the pellet resuspended in 20 ml HEPES-NaOH (20 mM, pH 7.4) containing 0.1 mM EDTA using the Polytron (20 s at 14,000 rpm). This procedure was repeated and the final pellet resuspended in HEPES-NaOH containing 0.1 mM EDTA and homogenized using the Polytron. Typically, aliquots of 2 ml membrane portions were stored at -80° C. With each new membrane batch the dissociation constant (Kd) was determined via a saturation curve. The TAAR1 radioligand 3[H]-(S)-4-[(ethyl-phenyl-amino)-methyl]-4,5-dihydro-oxazol-2-ylamine (described in WO 2008/098857) was used at a concentration equal to the calculated Kd value, that was usually around 0.7 nM, resulting in the binding of approximately 0.5% of the radioligand and a specific binding representing approximately 70% of the total binding. Nonspecific binding was defined as the amount of 3[H]-(S)-4-[(ethyl-phenyl-amino)-methyl]-4,5-dihydro-oxazol-2-ylamine bound in the presence of 10 uM unlabeled ligand. All compounds were tested at a broad range of concentrations (10 pM to 10 uM) in duplicates. The test compounds (20 ul/well) were transferred into a 96 deep well plate (TreffLab), and 180 ul of HEPES-NaOH (20 mM, pH 7.4) containing MgCl2 (10 mM) and CaCl2 (2 mM) (binding buffer), 300 ul of the radioligand 3[H]-(S)-4-[(ethyl-phenyl-amino)-methyl]-4,5-dihydro-oxazol-2-ylamine at a concentration of 3.3xKd in nM and 500 ul of the membranes (resuspended at 60 ug protein per ml) added. The 96 deep well plates were incubated for 1 hr at 4° C. Incubations were terminated by rapid filtration through Unifilter-96 plates (Packard Instrument Company) and glass filters GF/C (Perkin Elmer) presoaked for 1 hr in polyethylenimine (0.3%) and washed 3 times with 1 ml of cold binding buffer. After addition of 45 ul of Microscint 40 (PerkinElmer) the Unifilter-96 plate was sealed and after 1 hr the radioactivity counted using a TopCount Microplate Scintillation Counter (Packard Instrument Company).
- Radioligand Binding Assay on Mouse HEK-293 cells stably expressing mouse TAAR1 were maintained at 37° C. and 5% CO2 in DMEM high glucose medium, containing fetal calf serum (10%, heat inactivated for 30 min at 56° C.), penicillin/streptomycin (1%), and 375 μg/ml geneticin (Gibco). Cells were released from culture flasks using trypsin/EDTA, harvested, washed twice with ice-cold PBS (without Ca2+and Mg2+), pelleted at 1,000 rpm for 5 min at 4° C., frozen and stored at −80° C. Frozen pellets were suspended in 20 ml HEPES-NaOH (20 mM, pH 7.4) containing 10 mM EDTA and homogenized with a Polytron (PT 6000, Kinematica) at 14,000 rpm for 20 s. The homogenate was centrifuged at 48,000×g for 30 min at 4° C. Subsequently, the supernatant was removed and discarded, and the pellet resuspended in 20 ml HEPES-NaOH (20 mM, pH 7.4) containing 0.1 mM EDTA using the Polytron (20 s at 14,000 rpm). This procedure was repeated and the final pellet resuspended in HEPES-NaOH containing 0.1 mM EDTA and homogenized using the Polytron. Typically, aliquots of 2 ml membrane portions were stored at −80° C. With each new membrane batch the dissociation constant (Kd) was determined via a saturation curve. The TAAR1 radioligand 3[H]-(S)-4-[(ethyl-phenyl-amino)-methyl]-4,5-dihydro-oxazol-2-ylamine (described in WO 2008/098857) was used at a concentration equal to the calculated Kd value, that was usually around 0.7 nM, resulting in the binding of approximately 0.5% of the radioligand and a specific binding representing approximately 70% of the total binding. Nonspecific binding was defined as the amount of 3[H]-(S)-4-[(ethyl-phenyl-amino)-methyl]-4,5-dihydro-oxazol-2-ylamine bound in the presence of 10 μM unlabeled ligand. All compounds were tested at a broad range of concentrations (10 μM to 10 μM) in duplicates. The test compounds (20 □μl/well) were transferred into a 96 deep well plate (TreffLab), and 180 μl of HEPES-NaOH (20 mM, pH 7.4) containing MgCl2 (10 mM) and CaCl2 (2 mM) (binding buffer), 300 μl of the radioligand 3[H]-(S)-4-[(ethyl-phenyl-amino)-methyl]-4,5-dihydro-oxazol-2-ylamine at a concentration of 3.3×Kd in nM and 500 μl of the membranes (resuspended at 60 protein per ml) added. The 96 deep well plates were incubated for 1 hr at 4° C. Incubations were terminated by rapid filtration through Unifilter-96 plates (Packard Instrument Company) and glass filters GF/C (Perkin Elmer) presoaked for 1 hr in polyethylenimine (0.3%) and washed 3 times with 1 ml of cold binding buffer. After addition of 45 μl of Microscint 40 (PerkinElmer) the Unifilter-96 plate was sealed and after 1 hr the ratioactivity counted using a TopCount Microplate Scintillation Counter (Packard Instrument Company).
- Radioligand Binding Assay on Mouse TAAR1 HEK-293 cells stably expressing mouse TAAR1 were maintained at 37° C. and 5% CO2 in DMEM high glucose medium, containing fetal calf serum (10%, heat inactivated for 30 min at 56° C.), penicillin/streptomycin (1%), and 375 μg/ml geneticin (Gibco). Cells were released from culture flasks using trypsin/EDTA, harvested, washed twice with ice-cold PBS (without Ca2+ and Mg2+), pelleted at 1,000 rpm for 5 min at 4° C., frozen and stored at −80° C. Frozen pellets were suspended in 20 ml HEPES-NaOH (20 mM, pH 7.4) containing 10 mM EDTA and homogenized with a Polytron (PT 6000, Kinematica) at 14,000 rpm for 20 s. The homogenate was centrifuged at 48,000×g for 30 min at 4° C. Subsequently, the supernatant was removed and discarded, and the pellet resuspended in 20 ml HEPES-NaOH (20 mM, pH 7.4) containing 0.1 mM EDTA using the Polytron (20 s at 14,000 rpm). This procedure was repeated and the final pellet resuspended in HEPES-NaOH containing 0.1 mM EDTA and homogenized using the Polytron. Typically, aliquots of 2 ml membrane portions were stored at −80° C. With each new membrane batch the dissociation constant (Kd) was determined via a saturation curve. The TAAR1 radioligand 3[H] (S)-4-[(ethyl-phenyl-amino)-methyl]-4,5-dihydro-oxazol-2-ylamine (described in WO 2008/098857) was used at a concentration equal to the calculated Kd value, that was usually around 0.7 nM, resulting in the binding of approximately 0.5% of the radioligand and a specific binding representing approximately 70% of the total binding. Nonspecific binding was defined as the amount of 3[H] (S)-4-[(ethyl-phenyl-amino)-methyl]-4,5-dihydro-oxazol-2-ylamine bound in the presence of 10 M unlabeled ligand. All compounds were tested at a broad range of concentrations (10 pM to 10 μM) in duplicates. The test compounds (20□ μl/well) were transferred into a 96 deep well plate (TreffLab), and 180 μl of HEPES-NaOH (20 mM, pH 7.4) containing MgCl2 (10 mM) and CaCl2 (2 mM) (binding buffer), 300 μl of the radioligand 3[H] (S)-4-[(ethyl-phenyl-amino)-methyl]-4,5-dihydro-oxazol-2-ylamine at a concentration of 3.3×Kd in nM and 500 μl of the membranes (resuspended at 60 g protein per ml) added. The 96 deep well plates were incubated for 1 hr at 4° C. Incubations were terminated by rapid filtration through Unifilter-96 plates (Packard Instrument Company) and glass filters GF/C (Perkin Elmer) presoaked for 1 hr in polyethylenimine (0.3%) and washed 3 times with 1 ml of cold binding buffer. After addition of 45 μl of Microscint 40 (PerkinElmer) the Unifilter-96 plate was sealed and after 1 hr the radioactivity counted using a TopCount Microplate Scintillation Counter (Packard Instrument Company).
- Radioligand Binding Assay on Rat TAAR1 HEK-293 cells stably expressing rat TAAR1 were maintained at 37° C. and 5% CO2 in DMEM high glucose medium, containing fetal calf serum (10%, heat inactivated for 30 min at 56° C.), penicillin/streptomycin (1%), and 375 μg/ml geneticin (Gibco). Cells were released from culture flasks using trypsin/EDTA, harvested, washed twice with ice-cold PBS (without Ca2+ and Mg2+), pelleted at 1,000 rpm for 5 min at 4° C., frozen and stored at −80° C. Frozen pellets were suspended in 20 ml HEPES-NaOH (20 mM, pH 7.4) containing 10 mM EDTA and homogenized with a Polytron (PT 6000, Kinematica) at 14,000 rpm for 20 s. The homogenate was centrifuged at 48,000×g for 30 min at 4° C. Subsequently, the supernatant was removed and discarded, and the pellet resuspended in 20 ml HEPES-NaOH (20 mM, pH 7.4) containing 0.1 mM EDTA using the Polytron (20 s at 14,000 rpm). This procedure was repeated and the final pellet resuspended in HEPES-NaOH containing 0.1 mM EDTA and homogenized using the Polytron. Typically, aliquots of 2 ml membrane portions were stored at −80° C. With each new membrane batch the dissociation constant (Kd) was determined via a saturation curve. The TAAR1 radioligand 3[H] (S)-4-[(ethyl-phenyl-amino)-methyl]-4,5-dihydro-oxazol-2-ylamine (described in WO 2008/098857) was used at a concentration equal to the calculated Kd value, that was usually around 2.3 nM, resulting in the binding of approximately 0.2% of the radioligand and a specific binding representing approximately 85% of the total binding. Nonspecific binding was defined as the amount of [H] (S)-4-[(ethyl-phenyl-amino)-methyl]-4,5-dihydro-oxazol-2-ylamine bound in the presence of 10 M unlabeled ligand. All compounds were tested at a broad range of concentrations (10 pM to 10 μM) in duplicates. The test compounds (20□ μl/well) were transferred into a 96 deep well plate (TreffLab), and 180 μl of HEPES-NaOH (20 mM, pH 7.4) containing MgCl2 (10 mM) and CaCl2 (2 mM) (binding buffer), 300 μl of the radioligand 3[H] (S)-4-[(ethyl-phenyl-amino)-methyl]-4,5-dihydro-oxazol-2-ylamine at a concentration of 3.3×Kd in nM and 500 μl of the membranes (resuspended at 50 g protein per ml) added. The 96 deep well plates were incubated for 1 hr at 4° C. Incubations were terminated by rapid filtration through Unifilter-96 plates (Packard Instrument Company) and glass filters GF/C (Perkin Elmer) presoaked for 1 hr in polyethylenimine (0.3%) and washed 3 times with 1 ml of cold binding buffer. After addition of 45 μl of Microscint 40 (PerkinElmer) the Unifilter-96 plate was sealed and after 1 hr the radioactivity counted using a TopCount Microplate Scintillation Counter (Packard Instrument Company).
- Radioligand Binding Rat:HEK-293 cells stably expressing rat TAAR1 were maintained at 37° C. and 5% CO2 in DMEM high glucose medium, containing fetal calf serum (10%, heat inactivated for 30 min at 56° C.), penicillin/streptomycin (1%), and 375 μg/ml geneticin (Gibco). Cells were released from culture flasks using trypsin/EDTA, harvested, washed twice with ice-cold PBS (without Ca2+ and Mg2+), pelleted at 1′000 rpm for 5 min at 4° C., frozen and stored at −80° C. Frozen pellets were suspended in 20 ml HEPES-NaOH (20 mM, pH 7.4) containing 10 mM EDTA and homogenized with a Polytron (PT 6000, Kinematica) at 14,000 rpm for 20 s. The homogenate was centrifuged at 48,000×g for 30 min at 4° C. Subsequently, the supernatant was removed and discarded, and the pellet resuspended in 20 ml HEPES-NaOH (20 mM, pH 7.4) containing 0.1 mM EDTA using the Polytron (20 s at 14,000 rpm). This procedure was repeated and the final pellet resuspended in HEPES-NaOH containing 0.1 mM EDTA and homogenized using the Polytron. Typically, aliquots of 2 ml membrane portions were stored at −80° C. With each new membrane batch the dissociation constant (Kd) was determined via a saturation curve. The TAAR1 radioligand 3[H](S)-4-[(ethyl-phenyl-amino)-methyl]-4,5-dihydro-oxazol-2-ylamine (described in WO 2008/098857) was used at a concentration equal to the calculated Kd value, that was usually around 2.3 nM, resulting in the binding of approximately 0.2% of the radioligand and a specific binding representing approximately 85% of the total binding. Nonspecific binding was defined as the amount of [H](S)-4-[(ethyl-phenyl-amino)-methyl]-4,5-dihydro-oxazol-2-ylamine bound in the presence of 10 μM unlabeled ligand. All compounds were tested at a broad range of concentrations (10 pM to 10 μM) in duplicates. The test compounds (20□ μl/well) were transferred into a 96 deep well plate (TreffLab), and 180 μl of HEPES-NaOH (20 mM, pH 7.4) containing MgCl2 (10 mM) and CaCl2 (2 mM) (binding buffer), 300 μl of the radioligand 3[H](S)-4-[(ethyl-phenyl-amino)-methyl]-4,5-dihydro-oxazol-2-ylamine at a concentration of 3.3×Kd in nM and 500 μl of the membranes (resuspended at 50 g protein per ml) added. The 96 deep well plates were incubated for 1 hr at 4° C. Incubations were terminated by rapid filtration through Unifilter-96 plates (Packard Instrument Company) and glass filters GF/C (Perkin Elmer) presoaked for 1 hr in polyethylenimine (0.3%) and washed 3 times with 1 ml of cold binding buffer. After addition of 45 μl of Microscint 40 (PerkinElmer) the Unifilter-96 plate was sealed and after 1 hr the radioactivity counted using a TopCount Microplate Scintillation Counter (Packard Instrument Company).
- VHL HEK-293 BRET Assay The VHL NanoBRET Target Engagement Assay analyzes the apparent affinity of test compounds for VHL in cells by competitive displacement of a VHL NanoBRET tracer reversibly bound to a NanoLuc VHL fusion protein stably expressed in the cells. [0463] Test compounds were transferred to the assay plate (384 Well White NonBinding Corning Assay Plates (Coming- 3574)) using an Echo 555 Liquid Handler (Labcyte) in 2.5 nL increments and, as appropriate, intermediate stock concentrations of compounds, in order to prepare a titration series. 50 nL of control compound (lOmM; parental unlabeled VHL antagonist; see structure below) and 50 nL of DMSO (negative control) were dispensed into the appropriate control wells. DMSO was backfilled to a final volume of 50 nL as required. 50nl per well of 1 mM VHL NanoBRET Tracer in DMSO (NanoBRET Tracer-PEG2-590 (see structure below)) was transferred into each well using an Echo 555 (ultimately yielding a final concentration of luM). HEK 293 RT VHL-NanoLuc stable cells were cultured in DMEM High Glucose with Pyruvate, 10% fetal bovine serum, 2 mg/mL of Geneticin Selective Antibiotic (50 mg/ml) and 2 mM HEPES (1 M). Cells were seeded in Opti-MEM (Life Technologies-11058-021), 1.7 x 10⁵ cells/mL, 40 pl per well into the assay plate, centrifuged at 500 rpm for 30 seconds and incubated for 2 hours. Max Signal control wells consisted of DMSO only treated wells. Minimum Signal control wells contained of 10 uM parental unlabeled VHL antagonist (control compound - see structure below). 3X Complete Substrate plus Inhibitor Solution was prepared in Opti-MEM (consists of a 1:166 dilution of NanoBRET Nano-Gio Substrate plus a 1 : 500 dilution of Extracellular NanoLuc Inhibitor in Opti-MEM), and 20 ul was dispensed into each well of the 384-well plate and centrifuged at 1000 rpm for 1 minute, then incubated for 2 minutes at room temperature. Background Signal control wells were prepared without tracer for background correction steps. [0464] Plates were read using a PerkinElmer Envision Reader (model 2104-0020) equipped with Luminescence option (Mirror: BRET2 Enh (PE Barcode 659), Emission Filter: Omega 610LP (Barcode 504), 2nd Emission Filter: Umbelliferone 460 (Barcode 207), Measurement height: 6.5 mm, Measurement time: Is). The raw BRET ratio values were calculated by dividing the acceptor emission value (610 nm) by the donor emission value (460nm) for each sample. To correct for background, the BRET ratio in the absence of tracer (average of no-tracer control samples) was subtracted from the BRET ratio of each sample. Raw BRET units were converted to milliBRET units (mBU) by multiplying each raw BRET value by 1,000. The normalized NanoBRET signal was calculated relative to the Max Signal control wells (DMSO treated control wells) and the Minimum Signal control wells. Percentage inhibition was calculated relative to the Minimum Signal control and Maximum Signal control wells. IC50 values were derived by four parameter curve fitting using the Robust method.
- VHL HEK-293 BRET Assay The VHL NanoBRET Target Engagement Assay analyzes the apparent affinity of test compounds for VHL in cells by competitive displacement of a VHL NanoBRET tracer reversibly bound to a NanoLuc VHL fusion protein stably expressed in the cells.Test compounds were transferred to the assay plate (384 Well White Non-Binding Corning Assay Plates (Corning-3574)) using an Echo 555 Liquid Handler (Labcyte) in 2.5 nL increments and, as appropriate, intermediate stock concentrations of compounds, in order to prepare a titration series. 50 nL of control compound (10 mM; parental unlabeled VHL antagonist; see structure below) and 50 nL of DMSO (negative control) were dispensed into the appropriate control wells. DMSO was backfilled to a final volume of 50 nL as required. 50 nl per well of 1 mM VHL NanoBRET Tracer in DMSO (NanoBRET Tracer-PEG2-590 (see structure below)) was transferred into each well using an Echo 555 (ultimately yielding a final concentration of 1 uM). HEK 293 RT VHL-NanoLuc stable cells were cultured in DMEM High Glucose with Pyruvate, 10% fetal bovine serum, 2 mg/mL of Geneticin Selective Antibiotic (50 mg/ml) and 2 mM HEPES (1 M). Cells were seeded in Opti-MEM (Life Technologies-11058-021), 1.7×10⁵ cells/mL, 40 μl per well into the assay plate, centrifuged at 500 rpm for 30 seconds and incubated for 2 hours. Max Signal control wells consisted of DMSO only treated wells. Minimum Signal control wells contained of 10 uM parental unlabeled VHL antagonist (control compound see structure below). 3× Complete Substrate plus Inhibitor Solution was prepared in Opti-MEM (consists of a 1:166 dilution of NanoBRET Nano-Glo Substrate plus a 1:500 dilution of Extracellular NanoLuc Inhibitor in Opti-MEM), and 20 ul was dispensed into each well of the 384-well plate and centrifuged at 1000 rpm for 1 minute, then incubated for 2 minutes at room temperature. Background Signal control wells were prepared without tracer for background correction steps.Plates were read using a PerkinElmer Envision Reader (model 2104-0020) equipped with Luminescence option (Mirror: BRET2 Enh (PE Barcode 659), Emission Filter: Omega 610LP (Barcode 504), 2nd Emission Filter: Umbelliferone 460 (Barcode 207), Measurement height: 6.5 mm, Measurement time: 1 s). The raw BRET ratio values were calculated by dividing the acceptor emission value (610 nm) by the donor emission value (460 nm) for each sample. To correct for background, the BRET ratio in the absence of tracer (average of no-tracer control samples) was subtracted from the BRET ratio of each sample. Raw BRET units were converted to milliBRET units (mBU) by multiplying each raw BRET value by 1,000. The normalized NanoBRET signal was calculated relative to the Max Signal control wells (DMSO treated control wells) and the Minimum Signal control wells. Percentage inhibition was calculated relative to the Minimum Signal control and Maximum Signal control wells. IC50 values were derived by four parameter curve fitting using the Robust method.
- VHL HEK-293 BRET Assay The VHL NanoBRET Target Engagement Assay analyzes the apparent affinity of test compounds for VHL in cells by competitive displacement of a VHL NanoBRET tracer reversibly bound to a NanoLuc VHL fusion protein stably expressed in the cells.[0488] Test compounds were transferred to the assay plate (384 Well White Non-Binding Corning Assay Plates (Corning-3574)) using an Echo 555 Liquid Handler (Labcyte) in 2.5 nL increments and, as appropriate, intermediate stock concentrations of compounds, in order to prepare a titration series.50 nL of control compound (10mM; parental unlabeled VHL antagonist; see structure below) and 50 nL of DMSO (negative control) were dispensed into the appropriate control wells. DMSO was backfilled to a final volume of 50 nL as required.50nl per well of 1 mM VHL NanoBRET Tracer in DMSO (NanoBRETTM Tracer-PEG2-590 (see structure below)) was transferred into each well using an Echo 555 (ultimately yielding a final concentration of 1uM). HEK 293 RT VHL-NanoLuc stable cells were cultured in DMEM High Glucose with Pyruvate, 10% fetal bovine serum, 2 mg/mL of Geneticin Selective Antibiotic (50 mg/ml) and 2 mM HEPES (1 M). Cells were seeded in Opti-MEM (Life Technologies-11058-021), 1.7 × 10⁵ cells/mL, 40 ^l per well into the assay plate, centrifuged at 500 rpm for 30 seconds and incubated for 2 hours. Max Signal control wells consisted of DMSO only treated wells. Minimum Signal control wells contained of 10 uM parental unlabeled VHL antagonist (control compound see structure below). 3X Complete Substrate plus Inhibitor Solution was prepared in Opti-MEM (consists of a 1:166 dilution of NanoBRET Nano-Glo Substrate plus a 1:500 dilution of Extracellular NanoLuc Inhibitor in Opti-MEM), and 20 ul was dispensed into each well of the 384-well plate and centrifuged at 1000 rpm for 1 minute, then incubated for 2 minutes at room temperature. Background Signal control wells were prepared without tracer for background correction steps.[0489] Plates were read using a PerkinElmer Envision Reader (model 2104-0020) equipped with Luminescence option (Mirror: BRET2 Enh (PE Barcode 659), Emission Filter: Omega 610LP (Barcode 504), 2nd Emission Filter: Umbelliferone 460 (Barcode 207), Measurement height: 6.5 mm, Measurement time: 1s). The raw BRET ratio values were calculated by dividing the acceptor emission value (610 nm) by the donor emission value (460nm) for each sample. To correct for background, the BRET ratio in the absence of tracer (average of no-tracer control samples) was subtracted from the BRET ratio of each sample. Raw BRET units were converted to milliBRET units (mBU) by multiplying each raw BRET value by 1,000. The normalized NanoBRET signal was calculated relative to the Max Signal control wells (DMSO treated control wells) and the Minimum Signal control wells. Percentage inhibition was calculated relative to the Minimum Signal control and Maximum Signal control wells. IC50 values were derived by four parameter curve fitting using the Robust method.
- Calcium Flux Assays (hB1 IC50 IMR90) Notably, Compound Examples are tested in the FLIPR assays in the presence (hB1 free IC50) of 0.1% BSA in assay buffer, in order to assess the potency shifts due to serum protein binding of Compound Examples. The effect of BSA on the potency of endothelin receptor antagonists have been described in the prior art (Wu-Wong, J. R. et al. (1997), JPET 281: 791-798). The teaching can be applied in analogy to testing the potency of Bradykinin B1 receptor antagonist in the FLIPR assays. For the calcium flux assay, 80% confluent cells are detached from the culture vessels with Versene (Gibco), and seeded into 384-well plates (Cell binding Surface; Corning, N.Y.; #3683) at a density of 15,000 cells per well. Cells are seeded in a volume of 50 μL in medium without antibiotics and incubated overnight in a humidified atmosphere with 5% CO2 at 37° C. The following day, the medium is replaced with 20 μL of 5 μM Fluo-4AM dye (Molecular Probes) in assay buffer (2.5 mM probenicid, 1 mg/mL pluronic acid, 135 mM NaCl, 5 mM KCl, 1.8 mM CaCl, 1 mM MgCl2, 10 mM HEPES, 5.6 mM glucose, and 0.05% gelatine, pH 7.4), which contains or lacks 0.1% BSA for determination of compound potency units as hB1 IC50 or hB1 free IC50, respectively. The calcium indicator loaded cells are incubated at 37° C. for 2 hrs. Extracellular dye is then removed and each well is filled with 45 μL of assay buffer. Cell plates are kept in dark until used. Compound examples are assayed at 8 concentrations in triplicate. Serial 10-fold dilutions in 100% DMSO are made at a 100-times higher concentration than the final concentration, and then diluted 1:10 in assay buffer. 5 μL of each diluted compound is added to the well of cell plates (yielding final concentration with 1% DMSO), and incubated for 30 min at 28° C. before the addition of Bradykinin B1 receptor agonist on the FLIPR instrument. Agonist plates contain the agonist Lys-(Des-Arg)-Bradykinin (Bachem, Brackley) at 3.5×EC90 in assay buffer with 1% DMSO. The addition of agonist 20 μl per well to the assay plate is carried out on the FLIPR instrument while continuously monitoring Ca2+-dependent fluorescence at 538 nm. A peptide antagonist Lys-(Des-Arg-Leu)-Bradykinin (Bachem, Brackley) at 20 □M is used to determine the full inhibition as control. Peak fluorescence is used to determine the response to agonist obtained at each concentration of Compound Examples by the following equation: % Response=100*(RFU(compound)−RFU(control))/(RFU(DMSO)−RFU(control)) RFU means relative fluorescence units. Control means full inhibition by the peptide antagonist Lys-(Des-Arg-Leu)-Bradykinin at 20 □M.The response values are plotted against the logarithm of the compound concentrations. The Compound Examples are tested in triplicates per plate and mean values are plotted in Excel XLfit to determine IC50 values, percentage of maximal inhibition and the Hill slopes.
- Calcium Flux Assays (hB1 IC50 free) Notably, Compound Examples are tested in the FLIPR assays in the absence (hB1 free IC50) of 0.1% BSA in assay buffer, in order to assess the potency shifts due to serum protein binding of Compound Examples. The effect of BSA on the potency of endothelin receptor antagonists have been described in the prior art (Wu-Wong, J. R. et al. (1997), JPET 281: 791-798). The teaching can be applied in analogy to testing the potency of Bradykinin B1 receptor antagonist in the FLIPR assays. For the calcium flux assay, 80% confluent cells are detached from the culture vessels with Versene (Gibco), and seeded into 384-well plates (Cell binding Surface; Corning, N.Y.; #3683) at a density of 15,000 cells per well. Cells are seeded in a volume of 50 μL in medium without antibiotics and incubated overnight in a humidified atmosphere with 5% CO2 at 37° C. The following day, the medium is replaced with 20 μL of 5 μM Fluo-4AM dye (Molecular Probes) in assay buffer (2.5 mM probenicid, 1 mg/mL pluronic acid, 135 mM NaCl, 5 mM KCl, 1.8 mM CaCl, 1 mM MgCl2, 10 mM HEPES, 5.6 mM glucose, and 0.05% gelatine, pH 7.4), which contains or lacks 0.1% BSA for determination of compound potency units as hB1 IC50 or hB1 free IC50, respectively. The calcium indicator loaded cells are incubated at 37° C. for 2 hrs. Extracellular dye is then removed and each well is filled with 45 μL of assay buffer. Cell plates are kept in dark until used. Compound examples are assayed at 8 concentrations in triplicate. Serial 10-fold dilutions in 100% DMSO are made at a 100-times higher concentration than the final concentration, and then diluted 1:10 in assay buffer. 5 μL of each diluted compound is added to the well of cell plates (yielding final concentration with 1% DMSO), and incubated for 30 min at 28° C. before the addition of Bradykinin B1 receptor agonist on the FLIPR instrument. Agonist plates contain the agonist Lys-(Des-Arg)-Bradykinin (Bachem, Brackley) at 3.5×EC90 in assay buffer with 1% DMSO. The addition of agonist 20 μl per well to the assay plate is carried out on the FLIPR instrument while continuously monitoring Ca2+-dependent fluorescence at 538 nm. A peptide antagonist Lys-(Des-Arg-Leu)-Bradykinin (Bachem, Brackley) at 20 □M is used to determine the full inhibition as control. Peak fluorescence is used to determine the response to agonist obtained at each concentration of Compound Examples by the following equation: % Response=100*(RFU(compound)−RFU(control))/(RFU(DMSO)−RFU(control)) RFU means relative fluorescence units. Control means full inhibition by the peptide antagonist Lys-(Des-Arg-Leu)-Bradykinin at 20 □M.The response values are plotted against the logarithm of the compound concentrations. The Compound Examples are tested in triplicates per plate and mean values are plotted in Excel XLfit to determine IC50 values, percentage of maximal inhibition and the Hill slopes.
- High Throughput Screening Assay The commercially available HEK293/TREx line (Invitrogen) was stably transfected with a TRPC5 construct and screened by conventional calcium imaging to find clones with TRPC5 expression following stimulation with 1 μg/ml tetracycline. These cells were maintained in the growth medium recommended by the manufacturer supplemented with 100 μg/ml hygromycin to promote retention of the TRPC5 construct. After growing to near confluency, cells were plated at a density of 35,000 cells/well in 384 well CellBind plates (Corning) in the presence of 1 μg/ml tetracycline, and allowed to grow for 20-30 hrs. A nearly confluent monolayer resulted. Cells were then loaded with Ca2+ dye: Fura-2/AM or Fluo4/AM was added to the wells to a final concentration of 4 μM or 0.5 μM, respectively, and incubated for 80 min or 60 min, respectively, at room temperature. Supernatant was then removed from the cells by inverting plates with a sharp flick, and 25 μl Hank's Balanced Salt Solution (HBSS; 0.185 g/l D-glucose, 0.9767 g/l MgS04 (anhydrous), 0.4 g/l KCl, 0.06 g/l KH2PO4 (anhydrous), 0.35 g/l NaHCO3, 8.0 g/l NaCl, and 0.04788 g/l Na2HPO4 (anhydrous); pH 7.4) was then added to each well. Following 0.5 hour for recovery from loading, cells were assayed using the Hamamatsu FDSS 6000 system, which permitted illumination alternately at 340 nm and 380 nm for Fura-2 experiments, or at 485 nm for Fluo4 experiments. Frames were acquired at a rate of 0.2 Hz. During the assay, the plates were continuously vortexed, with pipette mixing of wells following addition of each reagent. For the screening assay, 26 μl of a diluted compound stock (at 50 μM) was added to each well for 2 minutes following the collection of a short (4 frame) baseline. 13 μl 62 mM high-Ca2+Ringer solution (4.17 ml of normal ringer (with 2 mM Ca2+) plus 5.83 ml of isotonic calcium ringer (105 mM Ca2+; in this ringer all sodium has been replaced with calcium)) was then added to each well, achieving a final concentration of 14 mM Ca2+ and 10 μM test compound. Data was collected for 3 minutes following addition of high Ca2+Ringer, where the fluorescent intensity (for Fluo4) and the F340/F380 ratio (for Fura-2) were proportional to the [Ca2+]i Negative controls consisted of HEK293/TREx TRPC5 cells exposed to high Ca2+ solution, but no compound. Positive control conditions consisted of addition of 2-APB, a promiscuous blocker of TRPC5 and other channels, to columns 23 and 24 of the plates, to a final concentration of 200 μM. The Fluo4 cell-based fluorescence assay was used to determine the intracellular Ca2+ concentration in the presence of varying drug concentration. Final concentrations of compounds tested were 20 μM, 6.667 μM, 2.222 μM, 0.741 μM, 0.247 μM, 0.082 μM, and 0.027 μM. Compounds were tested in triplicate at all concentrations.
- In Vitro GIRK Thallium Flux (2.5 minute) Assay Human Embryonic Kidney (HEK-293) cell lines co-expressing rat mGlu receptors 2, 3, 4, 6, 7 or 8 and G protein-coupled inwardly-rectifying potassium (GIRK) channels_ENREF_54 were grown in Growth Media containing 45% DMEM, 45% F-12, 10% FBS, 20 mM HEPES, 2 mM L-glutamine, antibiotic/antimycotic, non-essential amino acids, 700 μg/ml G418, and 0.6 μg/ml puromycin at 37° C. in the presence of 5% CO2. All cell culture reagents were purchased from Invitrogen Corp. (Carlsbad, Calif.) unless otherwise noted. Compound activity at the group II (mGlu2 and mGlu3) mGlus was assessed using thallium flux through GIRK channels. Briefly, cells were plated into 384-well, black-walled, clear-bottomed poly-D-lysine-coated plates at a density of 15,000 cells/20 μL/well in DMEM containing 10% dialyzed FBS, 20 mM HEPES, and 100 units/mL penicillin/streptomycin (assay media). Plated cells were incubated overnight at 37° C. in the presence of 5% CO2. The following day, the medium was exchanged from the cells to assay buffer [Hanks' balanced salt solution (Invitrogen) containing 20 mM HEPES, pH 7.3] using an ELX405 microplate washer (BioTek), leaving 20 μL/well, followed by the addition of 20 μL/well FluoZin2-AM (330 nM final concentration) indicator dye (Invitrogen; prepared as a stock in DMSO and mixed in a 1:1 ratio with Pluronic acid F-127) in assay buffer. Cells were incubated for 1 h at room temperature, and the dye exchanged to assay buffer using an ELX405, leaving 20 μL/well. Test compounds were diluted to 2 times their final desired concentration in assay buffer (0.3% DMSO final concentration). Agonists were diluted in thallium buffer [125 mM sodium bicarbonate (added fresh the morning of the experiment), 1 mM magnesium sulfate, 1.8 mM calcium sulfate, 5 mM glucose, 12 mM thallium sulfate, and 10 mM HEPES, pH 7.3] at 5 times the final concentration to be assayed. Cell plates and compound plates were loaded onto a kinetic imaging plate reader (FDSS 6000 or 7000; Hamamatsu Corporation, Bridgewater, N.J.). Appropriate baseline readings were taken (10 images at 1 Hz; excitation, 470±20 nm; emission, 540±30 nm) and test compounds were added in a 20 μL volume and incubated for 2.5 min as indicated before the addition of 10 μL of thallium buffer with or without agonist. After the addition of agonist, data were collected for approximately an additional 2.5 min. Data were analyzed using Excel (Microsoft Corp, Redmond, Wash.). The slope of the fluorescence increase beginning 5 s after thallium/agonist addition and ending 15 s after thallium/agonist addition was calculated, corrected to vehicle and maximal agonist control slope values, and plotted in using either XLfit (ID Business Solutions Ltd) or Prism software (GraphPad Software, San Diego, Calif.) to generate concentration-response curves. Potencies were calculated from fits using a four-point parameter logistic equation. For concentration-response curve experiments, compounds were serially diluted 1:3 into 10 point concentration response curves and were transferred to daughter plates using an Echo acoustic plate reformatter (Labcyte, Sunnyvale, Calif.).
- In Vitro GIRK Thallium Flux (60 minute) Assay Human Embryonic Kidney (HEK-293) cell lines co-expressing rat mGlu receptors 2, 3, 4, 6, 7 or 8 and G protein-coupled inwardly-rectifying potassium (GIRK) channels_ENREF_54 were grown in Growth Media containing 45% DMEM, 45% F-12, 10% FBS, 20 mM HEPES, 2 mM L-glutamine, antibiotic/antimycotic, non-essential amino acids, 700 μg/ml G418, and 0.6 μg/ml puromycin at 37° C. in the presence of 5% CO2. All cell culture reagents were purchased from Invitrogen Corp. (Carlsbad, Calif.) unless otherwise noted. Compound activity at the group II (mGlu2 and mGlu3) mGlus was assessed using thallium flux through GIRK channels. Briefly, cells were plated into 384-well, black-walled, clear-bottomed poly-D-lysine-coated plates at a density of 15,000 cells/20 μL/well in DMEM containing 10% dialyzed FBS, 20 mM HEPES, and 100 units/mL penicillin/streptomycin (assay media). Plated cells were incubated overnight at 37° C. in the presence of 5% CO2. The following day, the medium was exchanged from the cells to assay buffer [Hanks' balanced salt solution (Invitrogen) containing 20 mM HEPES, pH 7.3] using an ELX405 microplate washer (BioTek), leaving 20 μL/well, followed by the addition of 20 μL/well FluoZin2-AM (330 nM final concentration) indicator dye (Invitrogen; prepared as a stock in DMSO and mixed in a 1:1 ratio with Pluronic acid F-127) in assay buffer. Cells were incubated for 1 h at room temperature, and the dye exchanged to assay buffer using an ELX405, leaving 20 μL/well. Test compounds were diluted to 2 times their final desired concentration in assay buffer (0.3% DMSO final concentration). Agonists were diluted in thallium buffer [125 mM sodium bicarbonate (added fresh the morning of the experiment), 1 mM magnesium sulfate, 1.8 mM calcium sulfate, 5 mM glucose, 12 mM thallium sulfate, and 10 mM HEPES, pH 7.3] at 5 times the final concentration to be assayed. Cell plates and compound plates were loaded onto a kinetic imaging plate reader (FDSS 6000 or 7000; Hamamatsu Corporation, Bridgewater, N.J.). Appropriate baseline readings were taken (10 images at 1 Hz; excitation, 470±20 nm; emission, 540±30 nm) and test compounds were added in a 20 μL volume and incubated for 60 min as indicated before the addition of 10 μL of thallium buffer with or without agonist. After the addition of agonist, data were collected for approximately an additional 2.5 min. Data were analyzed using Excel (Microsoft Corp, Redmond, Wash.). The slope of the fluorescence increase beginning 5 s after thallium/agonist addition and ending 15 s after thallium/agonist addition was calculated, corrected to vehicle and maximal agonist control slope values, and plotted in using either XLfit (ID Business Solutions Ltd) or Prism software (GraphPad Software, San Diego, Calif.) to generate concentration-response curves. Potencies were calculated from fits using a four-point parameter logistic equation. For concentration-response curve experiments, compounds were serially diluted 1:3 into 10 point concentration response curves and were transferred to daughter plates using an Echo acoustic plate reformatter (Labcyte, Sunnyvale, Calif.).
- Measurement of Human α7 Nicotinic Acetylcholine Receptor (nAChR)'s Activity Activity of heteromeric α7 nAChR was measured via FlexStation-Ca2+ influx assay. In the present example, in consideration of α7 nAChR being Ca2+-permeable non-selective cationic channels, changes intracellular Ca2+ concentration were measured using a fluorescent dye Calcium-3 (available from Molecular Devices) and FlexStation II instrument (available from Molecular Devices).Human CHRNA7 (NM_000746) cDNA ORF clone (C/N RC221382; Origene) and Human RIC3 (NM_024557) cDNA ORF clone (C/N RC205179; Origene) were subcloned into pcDNA2.1/Zeo(+) vector (available from Invitrogen, Co.) to construct HEK293T/17 cells (ATCC, CRL-11268) transfected with human α7 nAChR. Afterward, the cells were suspended in growth media (consisted of Dulbecco's Modified Eagle's Media (DMEM, available from Invitrogen), a 10% heat-inactivated fetal bovine serum (FBS, available from Invitrogen), 300 μg/ml Geneticin (available from Invitrogen), 250 μg/ml Zeocin (available from Invitrogen), and 1× penicillin/streptomycin (available from Invitrogen)), followed by plating onto a Φ150 mm plate. Twenty-four hours prior to the start of the assay, grown cells in the suspension were collected, followed by centrifugation and further suspension at a concentration of 5×10⁵ cells/mL in growth media. This cell suspension was dispensed to each well of a 96-well black plate (5×10⁴ cells/well) with a poly-D-lysine-coated transparent bottom (available from Biocoat, BD). The plate with the cells were incubated at about 37° C. in 5% CO2 for about 24 hours.On the day of the assay, after removal of the growth media, the cells were washed once with an assay buffer (7 mM Tris-Cl, 20 mM HEPES, 20 mM NaCl, 5 mM KCl, 0.8 mM MgSO4, 4 mM CaCl2, 120 mM NMDG, 5 mM D-glucose, pH 7.4), followed by addition of about 100 ul per well of a Calcium-3 dye diluted with the assay buffer, and storage at room temperature for about 1 hour. A test compound (10 mM stock in 100% dimethyl sulfoxide (DMSO)) was diluted with the assay buffer to various concentrations, from the highest at about 40 μM to be lower by ⅓, and PNU-120596 (available from Sigma) for amplifying Ca2+ permeability signaling was diluted to about 30 μM with the assay buffer. Epibatidine (available from Sigma) in a final concentration of about 1 μM was used as a positive control group.To measure changes in intracellular Ca2+ concentration, after the plate was stored at room temperature for about 1 hour and the test compound dilution plate were put into FlexStation II equipment, fluorescence of the cells were measured for about 30 seconds prior to addition of drugs (the compounds), followed by addition of PNU-120596 and measurement of changes in fluorescence for about 120 seconds. After the cells were exposed to the test compound, changes in fluorescence for about 90 seconds were measured (excitation at 485 nm/emission at 525 nm). The largest fluorescence value at each concentration was recorded, and an EC50 of the test compound was determined using non-linear regression analysis with relative fluorescence values relative to the positive control group.
- In Vitro GIRK Thallium Flux Assay (2.5 minutes) Human Embryonic Kidney (HEK-293) cell lines co-expressing rat mGlu receptors 2, 3, 4, 6, 7 or 8 and G protein-coupled inwardly-rectifying potassium (GIRK) channels_ENREF_54 were grown in Growth Media containing 45% DMEM, 45% F-12, 10% FBS, 20 mM HEPES, 2 mM L-glutamine, antibiotic/antimycotic, non-essential amino acids, 700 μg/ml G418, and 0.6 μg/ml puromycin at 37° C. in the presence of 5% CO2. All cell culture reagents were purchased from Invitrogen Corp. (Carlsbad, Calif.) unless otherwise noted. Compound activity at the group II (mGlu2 and mGlu3) mGlus was assessed using thallium flux through GIRK channels. Briefly, cells were plated into 384-well, black-walled, clear-bottomed poly-D-lysine-coated plates at a density of 15,000 cells/20 μL/well in DMEM containing 10% dialyzed FBS, 20 mM HEPES, and 100 units/mL penicillin/streptomycin (assay media). Plated cells were incubated overnight at 37° C. in the presence of 5% CO2. The following day, the medium was exchanged from the cells to assay buffer [Hanks' balanced salt solution (Invitrogen) containing 20 mM HEPES, pH 7.3] using an ELX405 microplate washer (BioTek), leaving 20 μL/well, followed by the addition of 20 μL/well FluoZin2-AM (330 nM final concentration) indicator dye (Invitrogen; prepared as a stock in DMSO and mixed in a 1:1 ratio with Pluronic acid F-127) in assay buffer. Cells were incubated for 1 h at room temperature, and the dye exchanged to assay buffer using an ELX405, leaving 20 μL/well. Test compounds were diluted to 2 times their final desired concentration in assay buffer (0.3% DMSO final concentration). Agonists were diluted in thallium buffer [125 mM sodium bicarbonate (added fresh the morning of the experiment), 1 mM magnesium sulfate, 1.8 mM calcium sulfate, 5 mM glucose, 12 mM thallium sulfate, and 10 mM HEPES, pH 7.3] at 5 times the final concentration to be assayed. Cell plates and compound plates were loaded onto a kinetic imaging plate reader (FDSS 6000 or 7000; Hamamatsu Corporation, Bridgewater, N.J.). Appropriate baseline readings were taken (10 images at 1 Hz; excitation, 470±20 nm; emission, 540±30 nm) and test compounds were added in a 20 μL volume and incubated for either 2.5 min or 60 min as indicated before the addition of 10 μL of thallium buffer with or without agonist. After the addition of agonist, data were collected for approximately an additional 2.5 min. Data were analyzed using Excel (Microsoft Corp, Redmond, Wash.). The slope of the fluorescence increase beginning 5 s after thallium/agonist addition and ending 15 s after thallium/agonist addition was calculated, corrected to vehicle and maximal agonist control slope values, and plotted in using either XLfit (ID Business Solutions Ltd) or Prism software (GraphPad Software, San Diego, Calif.) to generate concentration-response curves. Potencies were calculated from fits using a four-point parameter logistic equation. For concentration-response curve experiments, compounds were serially diluted 1:3 into 10 point concentration response curves and were transferred to daughter plates using an Echo acoustic plate reformatter (Labcyte, Sunnyvale, Calif.). Test compounds were applied and followed by EC80 concentrations of glutamate.
- In Vitro GIRK Thallium Flux Assay (60 minutes) Human Embryonic Kidney (HEK-293) cell lines co-expressing rat mGlu receptors 2, 3, 4, 6, 7 or 8 and G protein-coupled inwardly-rectifying potassium (GIRK) channels_ENREF_54 were grown in Growth Media containing 45% DMEM, 45% F-12, 10% FBS, 20 mM HEPES, 2 mM L-glutamine, antibiotic/antimycotic, non-essential amino acids, 700 μg/ml G418, and 0.6 μg/ml puromycin at 37° C. in the presence of 5% CO2. All cell culture reagents were purchased from Invitrogen Corp. (Carlsbad, Calif.) unless otherwise noted. Compound activity at the group II (mGlu2 and mGlu3) mGlus was assessed using thallium flux through GIRK channels. Briefly, cells were plated into 384-well, black-walled, clear-bottomed poly-D-lysine-coated plates at a density of 15,000 cells/20 μL/well in DMEM containing 10% dialyzed FBS, 20 mM HEPES, and 100 units/mL penicillin/streptomycin (assay media). Plated cells were incubated overnight at 37° C. in the presence of 5% CO2. The following day, the medium was exchanged from the cells to assay buffer [Hanks' balanced salt solution (Invitrogen) containing 20 mM HEPES, pH 7.3] using an ELX405 microplate washer (BioTek), leaving 20 μL/well, followed by the addition of 20 μL/well FluoZin2-AM (330 nM final concentration) indicator dye (Invitrogen; prepared as a stock in DMSO and mixed in a 1:1 ratio with Pluronic acid F-127) in assay buffer. Cells were incubated for 1 h at room temperature, and the dye exchanged to assay buffer using an ELX405, leaving 20 μL/well. Test compounds were diluted to 2 times their final desired concentration in assay buffer (0.3% DMSO final concentration). Agonists were diluted in thallium buffer [125 mM sodium bicarbonate (added fresh the morning of the experiment), 1 mM magnesium sulfate, 1.8 mM calcium sulfate, 5 mM glucose, 12 mM thallium sulfate, and 10 mM HEPES, pH 7.3] at 5 times the final concentration to be assayed. Cell plates and compound plates were loaded onto a kinetic imaging plate reader (FDSS 6000 or 7000; Hamamatsu Corporation, Bridgewater, N.J.). Appropriate baseline readings were taken (10 images at 1 Hz; excitation, 470±20 nm; emission, 540±30 nm) and test compounds were added in a 20 μL volume and incubated for either 2.5 min or 60 min as indicated before the addition of 10 μL of thallium buffer with or without agonist. After the addition of agonist, data were collected for approximately an additional 60 min. Data were analyzed using Excel (Microsoft Corp, Redmond, Wash.). The slope of the fluorescence increase beginning 5 s after thallium/agonist addition and ending 15 s after thallium/agonist addition was calculated, corrected to vehicle and maximal agonist control slope values, and plotted in using either XLfit (ID Business Solutions Ltd) or Prism software (GraphPad Software, San Diego, Calif.) to generate concentration-response curves. Potencies were calculated from fits using a four-point parameter logistic equation. For concentration-response curve experiments, compounds were serially diluted 1:3 into 10 point concentration response curves and were transferred to daughter plates using an Echo acoustic plate reformatter (Labcyte, Sunnyvale, Calif.). Test compounds were applied and followed by EC80 concentrations of glutamate.
- Electrophysiological Assay (In Vitro Assay) Patch voltage clamp electrophysiology allows for the direct measurement and quantification of block of voltage-gated sodium channels (NaV's), and allows the determination of the time- and voltage-dependence of block which has been interpreted as differential binding to the resting, open, and inactivated states of the sodium channel (Hille, B., Journal of General Physiology (1977), 69: 497-515).The following patch voltage clamp electrophysiology studies were performed on representative compounds of the invention using human embryonic kidney cells (HEK), permanently transfected with an expression vector containing the full-length cDNA coding for the desired human sodium channel α-subunit, grown in culture media containing 10% FBS, 1% PSG, and 0.5 mg/mL G418 at 37° C. with 5% CO2. HEK cells used for the electrophysiology (EP) recordings had a passage number of less than 40 for all studies and were used within three days from the time of plating. NaV1.1, NaV1.5 and NaV1.6 cDNAs (NM_001165964 (SCN1A), NM_000335 (SCN5A) and NM_014191 (SCN8A), respectively) were stably expressed in HEK-293 cells.Sodium currents were measured using the patch clamp technique in the whole-cell configuration using either a PatchXpress automated voltage clamp or manually using an Axopatch 200B (Axon Instruments) or Model 2400 (A-M systems) amplifier. The manual voltage clamp protocol was as follows: Borosilicate glass micropipettes were fire-polished to a tip diameter yielding a resistance of 2-4 Mohms in the working solutions. The pipette was filled with a solution comprised of: 5 mM NaCl, 10 mM CsCl, 120 mM CsF, 0.1 mM CaCl2, 2 mM MgCl2, 10 mM HEPES, 10 mM EGTA; and adjusted to pH 7.2 with CsOH. The external solution had the following composition: 140 mM NaCl, 5 mM KCl, 2 mM CaCl2, 1 mM MgCl2, 10 mM HEPES; and adjusted to pH 7.4 with NaOH. In some studies, the external sodium was reduced by equimolar replacement with choline. Osmolarity in the CsF internal and NaC external solutions was adjusted to 300 mOsm/kg and 310 mOsm/kg with glucose, respectively. All recordings were performed at ambient temperature in a bath chamber with a volume of 150 μL. Control sodium currents were measured in 0.5% DMSO. Controls and representative compounds of the invention were applied to the recording chamber through a 4-pinch or 8-pinch valve bath perfusion system manufactured by ALA Scientific Instruments.Currents were recorded at 40 kHz sampling frequency, filtered at 5 Hz, and stored using a Digidata-1322A analogue/digital interface with the pClamp software (Axon Instruments). Series resistance compensation was applied (60-80%). Cells were rejected if currents showed inadequate voltage control (as judged by the IV relationship during stepwise activation). All statistics in this study are given as mean±SD.The membrane potential was maintained at a voltage where inactivation of the channel is complete. The voltage is then stepped back to a very negative (Vhold=−150 mV) voltage for 20 ms and then a test pulse is applied to quantify the compound block. The 20 ms brief repolarization was long enough for compound-free channels to completely recover from fast inactivation, but the compound-bound channels recovered more slowly such that negligible recovery could occur during this interval. The percent decrease in sodium current following wash-on of compound was taken as the percent block of sodium channels.
- Electrophysiological Assay (In Vitro Assay) Patch voltage clamp electrophysiology allows for the direct measurement and quantification of block of voltage-gated sodium channels (NaV's), and allows the determination of the time- and voltage-dependence of block which has been interpreted as differential binding to the resting, open, and inactivated states of the sodium channel (Hille, B., Journal of General Physiology (1977), 69: 497-515).The following patch voltage clamp electrophysiology studies were performed on representative compounds of the invention using human embryonic kidney cells (HEK), permanently transfected with an expression vector containing the full-length cDNA coding for the desired human sodium channel α-subunit, grown in culture media containing 10% FBS, 1% PSG, and 0.5 mg/mL G418 at 37° C. with 5% CO2. HEK cells used for the electrophysiology (EP) recordings had a passage number of less than 40 for all studies and were used within three days from the time of plating. NaV1.7 and NaV1.5 cDNAs (NM_002977 and AC137587; SCN5A, respectively) were stably expressed in HEK-293 cells. The β1 subunit was coexpressed in both the NaV1.7 and NaV1.5 cell lines.Sodium currents were measured using the patch clamp technique in the whole-cell configuration using either a PatchXpress automated voltage clamp or manually using an Axopatch 200B (Axon Instruments) or Model 2400 (A-M systems) amplifier. The manual voltage clamp protocol was as follows:Borosilicate glass micropipettes were fire-polished to a tip diameter yielding a resistance of 2-4 Mohms in the working solutions. The pipette was filled with a solution comprised of: 5 mM NaCl, 10 mM CsCl, 120 mM CsF, 0.1 mM CaCl2, 2 mM MgCl2, 10 mM HEPES, 10 mM EGTA; and adjusted to pH 7.2 with CsOH. The external solution had the following composition: 140 mM NaCl, 5 mM KCl, 2 mM CaCl2, 1 mM MgCl2, 10 mM HEPES; and adjusted to pH 7.4 with NaOH. In some studies, the external sodium was reduced by equimolar replacement with choline. Osmolarity in the CsF internal and NaCl external solutions was adjusted to 300 mOsm/kg and 310 mOsm/kg with glucose, respectively. All recordings were performed at ambient temperature in a bath chamber with a volume of 150 μL. Control sodium currents were measured in 0.5% DMSO. Controls and representative compounds of the invention were applied to the recording chamber through a 4-pinch or 8-pinch valve bath perfusion system manufactured by ALA Scientific Instruments.Currents were recorded at 40 kHz sampling frequency, filtered at 5 Hz, and stored using a Digidata-1322A analogue/digital interface with the pClamp software (Axon Instruments). Series resistance compensation was applied (60-80%). Cells were rejected if currents showed inadequate voltage control (as judged by the IV relationship during stepwise activation). All statistics in this study are given as mean±SD.The membrane potential was maintained at a voltage where inactivation of the channel is complete (which was −60 mV for both NaV1.7 and NaV1.5). The voltage is then stepped back to a very negative (Vhold=150 mV) voltage for 20 ms and then a test pulse is applied to quantify the compound block. The 20 ms brief repolarization was long enough for compound-free channels to completely recover from fast inactivation, but the compound-bound channels recovered more slowly such that negligible recovery could occur during this interval. The percent decrease in sodium current following wash-on of compound was taken as the percent block of sodium channels.
- Electrophysiological Assay (In Vitro Assay) Patch voltage clamp electrophysiology allows for the direct measurement and quantification of block of voltage-gated sodium channels (Nav's), and allows the determination of the time- and voltage-dependence of block which has been interpreted as differential binding to the resting, open, and inactivated states of the sodium channel (Hille, B., Journal of General Physiology (1977), 69: 497-515).The following patch voltage clamp electrophysiology studies were performed on representative compounds of the invention using human embryonic kidney cells (HEK), permanently transfected with an expression vector containing the full-length cDNA coding for the desired human sodium channel α-subunit, grown in culture media containing 10% FBS, 1% PSG, and 0.5 mg/mL G418 at 37° C. with 5% CO2. HEK cells used for the electrophysiology (EP) recordings had a passage number of less than 40 for all studies and were used within three days from the time of plating. Nav1.1, Nav1.5 and Nav1.6 cDNAs (NM_001165964 (SCN1A), NM_000335 (SCN5A) and NM_014191 (SCN8A), respectively) were stably expressed in HEK-293 cells.Sodium currents were measured using the patch clamp technique in the whole-cell configuration using either a PatchXpress automated voltage clamp or manually using an Axopatch 200B (Axon Instruments) or Model 2400 (A-M systems) amplifier. The manual voltage clamp protocol was as follows: Borosilicate glass micropipettes were fire-polished to a tip diameter yielding a resistance of 2-4 Mohms in the working solutions. The pipette was filled with a solution comprised of: 5 mM NaCl, 10 mM CsCl, 120 mM CsF, 0.1 mM CaCl2, 2 mM MgCl2, 10 mM HEPES, 10 mM EGTA; and adjusted to pH 7.2 with CsOH. The external solution had the following composition: 140 mM NaCl, 5 mM KCl, 2 mM CaCl2, 1 mM MgCl2, 10 mM HEPES; and adjusted to pH 7.4 with NaOH. In some studies, the external sodium was reduced by equimolar replacement with choline. Osmolarity in the CsF internal and NaCl external solutions was adjusted to 300 mOsm/kg and 310 mOsm/kg with glucose, respectively. All recordings were performed at ambient temperature in a bath chamber with a volume of 150 μL. Control sodium currents were measured in 0.5% DMSO. Controls and representative compounds of the invention were applied to the recording chamber through a 4-pinch or 8-pinch valve bath perfusion system manufactured by ALA Scientific Instruments.Currents were recorded at 40 kHz sampling frequency, filtered at 5 Hz, and stored using a Digidata-1322A analogue/digital interface with the pClamp software (Axon Instruments). Series resistance compensation was applied (60-80%). Cells were rejected if currents showed inadequate voltage control (as judged by the IV relationship during stepwise activation). All statistics in this study are given as mean±SD.The membrane potential was maintained at a voltage where inactivation of the channel is complete. The voltage is then stepped back to a very negative (Vhold=−150 mV) voltage for 20 ms and then a test pulse is applied to quantify the compound block. The 20 ms brief repolarization was long enough for compound-free channels to completely recover from fast inactivation, but the compound-bound channels recovered more slowly such that negligible recovery could occur during this interval. The percent decrease in sodium current following wash-on of compound was taken as the percent block of sodium channels.
- Electrophysiological Assay (In Vitro Assay) Patch voltage clamp electrophysiology allows for the direct measurement and quantification of block of voltage-gated sodium channels (Nav's), and allows the determination of the time- and voltage-dependence of block which has been interpreted as differential binding to the resting, open, and inactivated states of the sodium channel (Hille, B., Journal of General Physiology (1977), 69: 497-515).The following patch voltage clamp electrophysiology studies were performed on representative compounds of the invention using human embryonic kidney cells (HEK), permanently transfected with an expression vector containing the full-length cDNA coding for the desired human sodium channel a-subunit, grown in culture media containing 10% FBS, 1% PSG, and 0.5 mg/mL G418 at 37° C. with 5% CO2. HEK cells used for the electrophysiology (EP) recordings had a passage number of less than 40 for all studies and were used within three days from the time of plating. Nav1.1, Nav1.5 and Nav1.6 cDNAs (NM_001165964 (SCN1A), NM_000335 (SCN5A) and NM_014191 (SCN8A), respectively) were stably expressed in HEK-293 cells.Sodium currents were measured using the patch clamp technique in the whole-cell configuration using either a PatchXpress automated voltage clamp or manually using an Axopatch 200B (Axon Instruments) or Model 2400 (A-M systems) amplifier. The manual voltage clamp protocol was as follows: Borosilicate glass micropipettes were fire-polished to a tip diameter yielding a resistance of 2-4 Mohms in the working solutions. The pipette was filled with a solution comprised of: 5 mM NaCl, 10 mM CsCl, 120 mM CsF, 0.1 mM CaCl2, 2 mM MgCl2, 10 mM HEPES, 10 mM EGTA; and adjusted to pH 7.2 with CsOH. The external solution had the following composition: 140 mM NaCl, 5 mM KCl, 2 mM CaCl2, 1 mM MgCl2, 10 mM HEPES; and adjusted to pH 7.4 with NaOH. In some studies, the external sodium was reduced by equimolar replacement with choline. Osmolarity in the CsF internal and NaCl external solutions was adjusted to 300 mOsm/kg and 310 mOsm/kg with glucose, respectively. All recordings were performed at ambient temperature in a bath chamber with a volume of 150 μL. Control sodium currents were measured in 0.5% DMSO. Controls and representative compounds of the invention were applied to the recording chamber through a 4-pinch or 8-pinch valve bath perfusion system manufactured by ALA Scientific Instruments.Currents were recorded at 40 kHz sampling frequency, filtered at 5 Hz, and stored using a Digidata-1322A analogue/digital interface with the pClamp software (Axon Instruments). Series resistance compensation was applied (60-80%). Cells were rejected if currents showed inadequate voltage control (as judged by the IV relationship during stepwise activation). All statistics in this study are given as mean±SD.The membrane potential was maintained at a voltage where inactivation of the channel is complete. The voltage is then stepped back to a very negative (Vhold=−150 mV) voltage for 20 ms and then a test pulse is applied to quantify the compound block. The 20 ms brief repolarization was long enough for compound-free channels to completely recover from fast inactivation, but the compound-bound channels recovered more slowly such that negligible recovery could occur during this interval. The percent decrease in sodium current following wash-on of compound was taken as the percent block of sodium channels.
- Electrophysiological Assay (In Vitro Assay) Patch voltage clamp electrophysiology allows for the direct measurement and quantification of block of voltage-gated sodium channels (Nay's), and allows the determination of the time-and voltage-dependence of block which has been interpreted as differential binding to the resting, open, and inactivated states of the sodium channel (Hille, B., Journal of General Physiology (1977), 69: 497-515).The following patch voltage clamp electrophysiology studies were performed on representative compounds of the invention using human embryonic kidney cells (HEK), permanently transfected with an expression vector containing the full-length cDNA coding for the desired human sodium channel α-subunit, grown in culture media containing 10% FBS, 1% PSG, and 0.5 mg/mL G418 at 37° C. with 5% CO2. HEK cells used for the electrophysiology (EP) recordings had a passage number of less than 40 for all studies and were used within three days from the time of plating. NaV1.1, NaV1.5 and NaV1.6 cDNAs (NM_001165964 (SCN1A), NM_000335 (SCN5A) and NM_014191 (SCN8A), respectively) were stably expressed in HEK-293 cells.Sodium currents were measured using the patch clamp technique in the whole-cell configuration using either a PatchXpress automated voltage clamp or manually using an Axopatch 200B (Axon Instruments) or Model 2400 (A-M systems) amplifier.The manual voltage clamp protocol was as follows: Borosilicate glass micropipettes were fire-polished to a tip diameter yielding a resistance of 2-4 Mohms in the working solutions. The pipette was filled with a solution comprised of: 5 mM NaCl, 10 mM CsCl, 120 mM CsF, 0.1 mM CaCl2, 2 mM MgCl2, 10 mM HEPES, 10 mM EGTA; and adjusted to pH 7.2 with CsOH. The external solution had the following composition: 140 mM NaCl, 5 mM KCl, 2 mM CaCl2, 1 mM MgCl2, 10 mM HEPES; and adjusted to pH 7.4 with NaOH. In some studies, the external sodium was reduced by equimolar replacement with choline. Osmolarity in the CsF internal and NaCl external solutions was adjusted to 300 mOsm/kg and 310 mOsm/kg with glucose, respectively. All recordings were performed at ambient temperature in a bath chamber with a volume of 150 μL. Control sodium currents were measured in 0.5% DMSO. Controls and representative compounds of the invention were applied to the recording chamber through a 4-pinch or 8-pinch valve bath perfusion system manufactured by ALA Scientific Instruments.Currents were recorded at 40 kHz sampling frequency, filtered at 5 Hz, and stored using a Digidata-1322A analogue/digital interface with the pClamp software (Axon Instruments). Series resistance compensation was applied (60-80%). Cells were rejected if currents showed inadequate voltage control (as judged by the IV relationship during stepwise activation). All statistics in this study are given as mean±SD.The membrane potential was maintained at a voltage where inactivation of the channel is complete. The voltage is then stepped back to a very negative (Vhold=−150 mV) voltage for 20 ms and then a test pulse is applied to quantify the compound block. The 20 ms brief repolarization was long enough for compound-free channels to completely recover from fast inactivation, but the compound-bound channels recovered more slowly such that negligible recovery could occur during this interval. The percent decrease in sodium current following wash-on of compound was taken as the percent block of sodium channels.
- Electrophysiological Assay Patch voltage clamp electrophysiology allows for the direct measurement and quantification of block of voltage-gated sodium channels (Nay's), and allows the determination of the time- and voltage-dependence of block which has been interpreted as differential binding to the resting, open, and inactivated states of the sodium channel (Hille, B., Journal of General Physiology (1977), 69: 497-515).The following patch voltage clamp electrophysiology studies were performed on representative compounds of the invention using human embryonic kidney cells (HEK), permanently transfected with an expression vector containing the full-length cDNA coding for the desired human sodium channel α-subunit, grown in culture media containing 10% FBS, 1% PSG, and 0.5 mg/mL G418 at 37° C. with 5% CO2. HEK cells used for the electrophysiology (EP) recordings had a passage number of less than 40 for all studies and were used within three days from the time of plating. NaV1.1, NaV1.5 and NaV1.6 cDNAs (NM_001165964 (SCN1A), NM_000335 (SCN5A) and NM_014191 (SCN8A), respectively) were stably expressed in HEK-293 cells.Sodium currents were measured using the patch clamp technique in the whole-cell configuration using either a PatchXpress automated voltage clamp or manually using an Axopatch 200B (Axon Instruments) or Model 2400 (A-M systems) amplifier. The manual voltage clamp protocol was as follows: Borosilicate glass micropipettes were fire-polished to a tip diameter yielding a resistance of 2-4 Mohms in the working solutions. The pipette was filled with a solution comprised of: 5 mM NaCl, 10 mM CsCl, 120 mM CsF, 0.1 mM CaCl2, 2 mM MgCl2, 10 mM HEPES, 10 mM EGTA; and adjusted to pH 7.2 with CsOH. The external solution had the following composition: 140 mM NaCl, 5 mM KCl, 2 mM CaCl2, 1 mM MgCl2, 10 mM HEPES; and adjusted to pH 7.4 with NaOH. In some studies, the external sodium was reduced by equimolar replacement with choline. Osmolarity in the CsF internal and NaCl external solutions was adjusted to 300 mOsm/kg and 310 mOsm/kg with glucose, respectively. All recordings were performed at ambient temperature in a bath chamber with a volume of 150 μL. Control sodium currents were measured in 0.5% DMSO. Controls and representative compounds of the invention were applied to the recording chamber through a 4-pinch or 8-pinch valve bath perfusion system manufactured by ALA Scientific Instruments.Currents were recorded at 40 kHz sampling frequency, filtered at 5 Hz, and stored using a Digidata-1322A analogue/digital interface with the pClamp software (Axon Instruments). Series resistance compensation was applied (60-80%). Cells were rejected if currents showed inadequate voltage control (as judged by the IV relationship during stepwise activation). All statistics in this study are given as mean±SD.The membrane potential was maintained at a voltage where inactivation of the channel is complete. The voltage is then stepped back to a very negative (Vhold=−150 mV) voltage for 20 ms and then a test pulse is applied to quantify the compound block. The 20 ms brief repolarization was long enough for compound-free channels to completely recover from fast inactivation, but the compound-bound channels recovered more slowly such that negligible recovery could occur during this interval. The percent decrease in sodium current following wash-on of compound was taken as the percent block of sodium channels.
- Kinase-Glo luminescent kinase assay The sample compounds were dissolved in DMSO and diluted it to 500 μM concentration with DMSO and transferred to a dose plate. The compounds were serially diluted with DMSO in 5 fold concentration. Then each concentration was diluted 10-fold with the reaction buffer to get a 10× final concentration. Transfer the compounds with concentrations ranging from 0.003 μM to 50 μM to EGFR assay plate to determine their kinase activity with a dose of 1 μL/well.The positive control compound Gifitinib was dissolved in DMSO as 10 mM stock solution and diluted it to 100 μM concentration with DMSO. The control compound was serially diluted with DMSO in 5 fold concentration. Then each concentration was diluted 10-fold with the reaction buffer to get a 10× final concentration. Transfer the positive control compound with concentrations ranging from 0.00064 μM to 10 μM to EGFR assay plate to determine their kinase activity with a dose of 1 μL/well.For the HPE (hundred percent effect: No kinase and no compound, but containing ATP, substrate and 1% DMSO) and ZPE (zero percent effect: No compound but containing kinase, ATP, substrate and 1% DMSO) wells, dilute 2 μL DMSO 10-fold with reaction buffer to obtain 10% DMSO solution. Then transfer it to the assay plat, 1 μL/well. The positive control wells contain kinase, ATP, substrate and positive control compound in different concentrations. The sample compound wells contain kinase, ATP, substrate and the compounds to be tested in different concentrations.Preparation of the reagents in need: 4×ATP: dilute ATP 4 times with assay buffer to obtain a working solution; 4× substrate: dilute Poly (glucose: tyrosine) 4 times with assay buffer to obtain a working solution; 2.5×EGFR kinase: dilute EGFR kinase 2.5 times with assay buffer to obtain a working solution.Kinase reaction: Add 10× compounds to the assay plate in a 384-well plate layout, 1 μL/well. For the HPE and ZPE wells, equal volume (1 μL/well) of 10% DMSO was added to the 384-well assay plate; Add 2.5×EGFR kinase into the assay plate in 384-well plate layout, 4 μL/well. For HPE and ZPE wells, an equal volume (4 μL/well) of assay buffer was added to the 384-well assay plate; Centrifuge the assay plate with 1000 rpm for 1 min to mix them; Pre-incubate the assay plate for 30 min at 30° C.; Mix equal volume of 4×ATP and 4× substrate to obtain 2×ATP-substrate mixture which serves as a reaction mixture for the determination of EGFR activity; Add 2×ATP-substrate mixture to the assay plate, 5 μL/well; Centrifuge the assay plate at 1000 rpm for 1 min to mix them; Incubate the assay plate for one hour at 30° C.; Add Kinase glo plus was to each well (10 μL/well), and then incubated the assay plate for 20 min at 27° C.; Read luminescence signal with Envision plate reader.Raw data analysis: The raw data was analyzed by Prism 5.0 and the rate of inhibition was calculated by the following formula: Compound inhibition rate=( compound reading−ZPE)/(HPE−ZPE)*100%.
- Automated Electrophysiology (Barra) Ion Works Barracuda population patch clamp (PPC). PPC measurements were performed using an IonWorks Barracuda instrument (Molecular Devices Corporation, Union City, Calif.) using either PatchPlate PPC substrates (Molecular Devices Corporation) with 64 apertures per well. The ability to average currents from 64 recordings from each well greatly improves data consistency and recording success rates in the measurement of NaV1.7 mediated ionic currents. Calculated leak current was digitally subtracted from the total cell NaV1.7 current for each sample point acquired.NaV1.7 currents were elicited by a voltage clamp protocol designed to bias the NaV1.7 channels to their inactivated state as follows. From holding potential of −60 mV cells were briefly hyperpolarized to −100 mV for 1.25 sec, then stepped to −20 mV for 20 sec to inactivate the channels. This was followed by a relatively brief hyperpolarization to −100 mv for 300 ms, then a 20 msec test pulse to −20 mV to elicit the NaV1.7 current used to measure the pharmacology of all test compounds. Compounds were incubated for 600 sec between the pre- and post-compound reads. The external recording solution used was (in mM) 137 NaCl, 4 KCl, 1 MgCl2, 1.8 CaCl2, 10 Hepes, 10 glucose, pH to 7.4 with NaOH, and the internal solution used was (in mM) 100 K-gluconate, 40 KCl, 3.2 zMgCl2, 5 EGTA, 10 HEPES pH to 7.2 with KOH. The same solutions were used to record NaV1.5 currents, with the following voltage clamp protocol. NaV1.5 currents were elicited by a voltage clamp protocol designed to bias the NaV1.5 channels to their inactivated state as follows. From holding potential of −40 mV cells were briefly hyperpolarized to −100 mV for 300 ms, then stepped to −10 mV for 20 sec to inactivate the channels. This was followed by a relatively brief hyperpolarization to −100 mv for 30 ms, then a 20 msec test pulse to −10 mV to elicit the NaV1.5 current used to measure the pharmacology of all test compounds. HEK 293 cells expressing NaV1.7 and NaV1.5 channels, were used (Essen Biosciences, Ann Arbor, Mich.). Cells were cultured in T-175 flasks and passaged every 2 to 3 days at 1:3 to 1:6 seeding density dilutions. Cells were grown to 70% to 90% confluence in a flask and removed from the incubator (37° C., 5% CO2) 1 to 3 days after plating. Growth medium was aspirated from the culture flasks. Cells were gently rinsed with 10 ml of PBS (Catalog number: 14190144, Gibco) to remove residual media. Next a total of 2 mL TrypLE (Gibco) solution was added, and the flasks containing cells were sat for 3 min at RT, after which, the cells became visibly rounded and were easily dislodged from the bottom of the flask with a few brief taps on a solid surface. A total of 8 mL of media was added to the flask to inactivate the TrypLE, and the mixture was centrifuged at 910 rpm for 4 min. The cell supernatant was decanted, and the cell pellets were resuspended in 5-6 mL of external solution followed by gentle triturations using a 10 ml pipette, and transferred to a 15 ml conical tube and immediately brought to the IW Barracuda instrument. The cell suspension had a final concentration of 2 to 3 million cells per ml; this corresponds to 10,000 cells added per well.Peak membrane currents were analyzed with IW Barracuda software and exported to Excel for further analysis. Concentration response curve fitting was performed with BMS in-house software. IC50 values were obtained by fits of the Hill equation to the average percent inhibition data plotted versus compound concentration. Concentration-response curves for all test compounds were fitted to a 4-parameter equation: % of control=100 (1+([drug]/IC50)p)−1, where IC50 is the concentration of drug required to inhibit current by 50% and p is the Hill slope.
- KOR Antagonist Assay The cell line for the OPRK1 antagonist assay stably expresses the following elements: The carboxy terminus of the OPRK1 receptor has a 7-amino acid linker, followed by the TEV protease cleavage site and a GAL4-VP16 fusion protein. The cell line also expresses a b-arrestin-2-TEV protease fusion protein and contains a reporter construct consisting of the UAS response element and the b-lactamase (bla) reporter gene. Upon activation of the receptor, g-protein receptor kinase (GRK) phosphorylates specific intracellular residues and this induces recruitment of B-arrestin2-TEV protease. The TEV protease recognizes and cleaves the TEV site, releasing the GAL4-VP16 fusion protein, which then translocates to the nucleus. The GAL4-V16 binds to the UAS element, driving expressing of the b-lactamase gene. B-lactamase expression is detected with the cell permeable, fluorescent substrate, CCF4-AM. This substrate consists of coumarin tethered to fluorescein via a b-lactam ring. In the absence of b-lactamase, excitation of the dye with 405 nm light results in FRET from the coumarin to fluorescein and emission of green (525 nm maximum) light. B-lactamase cleavage of the substrate separates the coumarin fluorophore from the fluorescein, and 405 nm excitation results in blue (460 nm maximum) emission. The assay is monitored by the blue/green emission ratio.OPRK1 TANGO U2OS cells are cultured in growth media (McCoy's 5 A medium, 10% Dialyzed FBS, Non-essential amino acids, 25 mM HEPES, 1 mM sodium pyruvate, penicillin/streptomycin). Two million cells are added to a T175 flask in 30 mL of growth medium and incubated at 37° C./5% CO2 for four days at which point they are 70-90% confluent. Growth medium is removed by aspiration, 5 mL of 0.25% Trypsin/EDTA is added to the flask and gently washed over the cells. The trypsin is then removed by aspiration. Cells are allowed to round up and are detached by tapping the flask. Cells are suspended in assay medium (DMEM high glucose with 1% charcoal dextran stripped FBS, Non-essential amino acids, 25 mM HEPES, 1 mM sodium pyruvate, penicillin/streptomycin) triturated, counted and pelleted by centrifugation. Cells are resuspended at 1.6 million cells per mL and 10 ul added to each well of a black, clear-bottom 384-well assay plate (Greiner part number 788092). Assay plates are placed in a humidified box and incubated 16-24 hours at 37° C./5% CO2. Compounds dissolved in DMSO are serially diluted in DMSO in a 384-well polypropylene plate. 50 nl of each compound dilution is added to the wells of the assay plate using pintools. Control wells receive 50 nl DMSO. The plates are returned to the incubator for 30 minutes. After the preincubation with compound, 50 nl of 600 nM (−)-U-50,488 (agonist challenge) is added to the compound wells of the assay plate. Control wells receive 50 nl of 5.6 uM (−)-U-50,488 (100% response control), 50 nl of 600 nM (−)-U-50,488 (EC80 control) or 50 nl of DMSO (0% response control). Assay plates are returned to the incubator for 4 hours at 37° C./5% CO2. Assay plates are then removed from the incubator and 2.5 ul of LiveBlazer CCF4-AM substrate dye (Invitrogen) is added to each well. The assay plates are then placed on the benchtop for two hours at room temperature covered in foil to avoid light.The plates are then read on a fluorescence plate reader with an excitation wavelength of 405 nm and emission wavelengths of 460 nm and 525 nm. Results are calculated using the blue/green emission ratio. Percent inhibition is calculated by the following equation, with IC50 being the concentration of compound required to achieve 50% inhibition.
- mGlu Receptor In Vitro Assays Human Embryonic Kidney (HEK-293) cell lines co-expressing rat mGlu receptors 2, 3, 4, 6, 7 or 8 and G protein-coupled inwardly-rectifying potassium (GIRK) channels were grown in Growth Media containing 45% DMEM, 45% F-12, 10% FBS, 20 mM HEPES, 2 mM L-glutamine, antibiotic/antimycotic, non-essential amino acids, 700 μg/ml G418, and 0.6 μg/ml puromycin at 37° C. in the presence of 5% CO2. Cells expressing rat mGlui and mGlu5 receptor were cultured as described in Hemstapat et al (Mol. Pharmacol. 2006, 70, 616-626). All cell culture reagents were purchased from Invitrogen Corp. (Carlsbad, Calif.) unless otherwise noted. Calcium assays were used to assess activity of compounds at mGlu1 and mGlu5, as previously described in Engers et al (J. Med. Chem. 2009, 52, 4115-4118). Calcium assays at mGlu3 were performed as described for mGlu5 with the exception that TREx293 mGlu3 Gα15 cells were treated with tetracycline at 20 ng/mL for 20 h prior to assay.Compound activity at the group II (mGlu2 and mGlu3) and group III (mGlu4, mGlu6, mGlu7, and mGlu8) was assessed using thallium flux through GIRK channels, a method that has been described in detail. Briefly, cells were plated into 384-well, black-walled, clear-bottomed poly-D-lysine-coated plates at a density of 15,000 cells/20 μL/well in DMEM containing 10% dialyzed FBS, 20 mM HEPES, and 100 units/mL penicillin/streptomycin (assay media). Plated cells were incubated overnight at 37° C. in the presence of 5% CO2. The following day, the medium was exchanged from the cells to assay buffer [Hanks' balanced salt solution (Invitrogen) containing 20 mM HEPES, pH 7.3] using an FLX405 microplate washer (BioTek), leaving 20 μL/well, followed by the addition of 20 μL/well FluoZin2-AM (330 nM final concentration) indicator dye (Invitrogen; prepared as a stock in DMSO and mixed in a 1:1 ratio with Pluronic acid F-127) in assay buffer. Cells were incubated for 1 h at room temperature, and the dye exchanged to assay buffer using an ELX405, leaving 20 μL/well. Test compounds were diluted to 2 times their final desired concentration in assay buffer (0.3% DMSO final concentration). Agonists were diluted in thallium buffer [125 mM sodium bicarbonate (added fresh the morning of the experiment), 1 mM magnesium sulfate, 1.8 mM calcium sulfate, 5 mM glucose, 12 mM thallium sulfate, and 10 mM HEPES, pH 7.3] at 5 times the final concentration to be assayed. Cell plates and compound plates were loaded onto a kinetic imaging plate reader (FDSS 6000 or 7000; Hamamatsu Corporation, Bridgewater, N.J.). Appropriate baseline readings were taken (10 images at 1 Hz; excitation, 470±20 nm; emission, 540±30 nm) and test compounds were added in a 20 μL volume and incubated for approximately 2.5 min before the addition of 10 μL of thallium buffer with or without agonist. After the addition of agonist, data were collected for approximately an additional 2.5 min. Data were analyzed using Excel (Microsoft Corp, Redmond, Wash.). The slope of the fluorescence increase beginning 5 s after thallium/agonist addition and ending 15 s after thallium/agonist addition was calculated, corrected to vehicle and maximal agonist control slope values, and plotted in using either XLfit (ID Business Solutions Ltd) or Prism software (GraphPad Software, San Diego, Calif.) to generate concentration-response curves. Potencies were calculated from fits using a four-point parameter logistic equation. For concentration-response curve experiments, compounds were serially diluted 1:3 into 10 point concentration response curves and were transferred to daughter plates using an Echo acoustic plate reformatter (Labcyte, Sunnyvale, Calif.).
- FRET Activity Assay Determination of a ligand mediated cofactor peptide interaction to quantify ligand binding to the nuclear receptor FXR was performed as follows.Preparation of human FXR alpha ligand binding domain: The human FXRalpha LBD was expressed in E. coli strain BL21(DE3) as an N-terminally GST tagged fusion protein. The DNA encoding the FXR ligand binding domain was cloned into vector pDEST15 (Invitrogen). Expression was under control of an IPTG inducible T7 promoter. The amino acid boundaries of the ligand binding domain were amino acids 187-472 of Database entry NM_005123 (RefSeq). Expression and purification of the FXR-LBD: An overnight preculture of a transformed E. coli strain was diluted 1:20 in LB-Ampicillin medium and grown at 30° C. to an optical density of OD600=0.4-0.6. Gene expression was then induced by addition of 0.5 mM IPTG. Cells were incubated an additional 6 h at 30° C., 180 rpm. Cells were collected by centrifugation (7000×g, 7 min, rt). Per liter of original cell culture, cells were resuspended in 10 mL lysis buffer (50 mM Glucose, 50 mM Tris pH 7.9, 1 mM EDTA and 4 mg/mL lysozyme) and left on ice for 30 min. Cells were then subjected to sonication and cell debris removed via centrifugation (22000×g, 30 min, 4° C.). Per 10 mL of supernatant 0.5 mL prewashed Glutathione 4B sepharose slurry (Qiagen) was added and the suspension kept slowly rotating for 1 h at 4° C. Glutathione 4B sepharose beads were pelleted by centrifugation (2000×g, 15 sec, 4° C.) and washed twice in wash buffer (25 mM Tris, 50 mM KCl, 4 mM MgCl2 and 1M NaCl). The pellet was resuspended in 3 mL elution buffer per liter of original culture (elution buffer: 20 mM Tris, 60 mM KCl, 5 mM MgCl2 and 80 mM glutathione added immediately prior to use as powder). The suspension was left rotating for 15 min at 4° C., the beads pelleted and eluted again with half the volume of elution buffer than the first time. The eluates were pooled and dialysed overnight in 20 mM Hepes buffer (pH 7.5) containing 60 mM KCl, 5 mM MgCl2 as well as 1 mM dithiothreitol and 10% (v/v) glycerol. The protein was analysed by SDS-Page.The method measures the ability of putative ligands to modulate the interaction between the purified bacterial expressed FXR ligand binding domain (LBD) and a synthetic biotinylated peptide based on residues 676-700 of SRC-1 (LCD2, 676-700). The sequence of the peptide used was B-CPSSHSSLTERHKILHRLLQEGSPS-COOH (SEQ ID NO: 1) where the N-terminus was biotinylated (B). The ligand binding domain (LBD) of FXR was expressed as fusion protein with GST in BL-21 cells using the vector pDEST15. Cells were lysed by sonication, and the fusion proteins purified over glutathione sepharose (Pharmacia) according to the manufacturers instructions. For screening of compounds for their influence on the FXR-peptide interaction, the Perkin Elmer LANCE technology was applied. This method relies on the binding dependent energy transfer from a donor to an acceptor fluorophor attached to the binding partner of interest. For ease of handling and reduction of background from compound fluorescence LANCE technology makes use of generic fluorophore labels and time resolved detection Assays were done in a final volume of 25 μL in a 384 well plate, in a Tris-based buffer (20 mM Tris-HCl pH 7.5; 60 mM KCl, 5 mM MgCl2; 35 ng/μL BSA), containing 20-60 ng/well recombinantly expressed FXR-LBD fused to GST, 200-600 nM N-terminally biotinylated peptide, representing SRC1 aminoacids 676-700, 200 ng/well Streptavidin-xlAPC conjugate (Prozyme) and 6-10 ng/well Eu W1024-antiGST (Perkin Elmer). DMSO content of the samples was kept at 1%. After generation of the assay mix and diluting the potentially FXR modulating ligands, the assay was equilibrated for 1 h in the dark at rt in FIA-plates black 384 well (Greiner). The LANCE signal was detected by a Perkin Elmer VICTOR2VTM Multilabel Counter.
- RET Activity Assay Preparation of human FXR alpha ligand binding domain: The human FXRalpha LBD was expressed in E. coli strain BL21(DE3) as an N-terminally GST tagged fusion protein. The DNA encoding the FXR ligand binding domain was cloned into vector pDEST15 (Invitrogen). Expression was under control of an IPTG inducible T7 promoter. The amino acid boundaries of the ligand binding domain were amino acids 187-472 of Database entry NM_005123 (RefSeq). Expression and purification of the FXR-LBD: An overnight preculture of a transformed E. coli strain was diluted 1:20 in LB-Ampicillin medium and grown at 30° C. to an optical density of OD600=0.4-0.6. Gene expression was then induced by addition of 0.5 mM IPTG. Cells were incubated an additional 6 h at 30° C., 180 rpm. Cells were collected by centrifugation (7000×g, 7 min, rt). Per liter of original cell culture, cells were resuspended in 10 mL lysis buffer (50 mM Glucose, 50 mM Tris pH 7.9, 1 mM EDTA and 4 mg/mL lysozyme) and left on ice for 30 min. Cells were then subjected to sonication and cell debris removed via centrifugation (22000×g, 30 min, 4° C.). Per 10 mL of supernatant 0.5 mL prewashed Glutathione 4B sepharose slurry (Qiagen) was added and the suspension kept slowly rotating for 1 h at 4° C. Glutathione 4B sepharose beads were pelleted by centrifugation (2000×g, 15 sec, 4° C.) and washed twice in wash buffer (25 mM Tris, 50 mM KCl, 4 mM MgCl2 and 1M NaCl). The pellet was resuspended in 3 mL elution buffer per liter of original culture (elution buffer: 20 mM Tris, 60 mM KCl, 5 mM MgCl2 and 80 mM glutathione added immediately prior to use as powder). The suspension was left rotating for 15 min at 4° C., the beads pelleted and eluted again with half the volume of elution buffer than the first time. The eluates were pooled and dialysed overnight in 20 mM Hepes buffer (pH 7.5) containing 60 mM KCl, 5 mM MgCl2 as well as 1 mM dithiothreitol and 10% (v/v) glycerol. The protein was analysed by SDS-Page.The method measures the ability of putative ligands to modulate the interaction between the purified bacterial expressed FXR ligand binding domain (LBD) and a synthetic biotinylated peptide based on residues 676-700 of SRC-1 (LCD2, 676-700). The sequence of the peptide used was B-CPSSHSSLTERHKILHRLLQEGSPS-COOH (SEQ ID NO: 1) where the N-terminus was biotinylated (B). The ligand binding domain (LBD) of FXR was expressed as fusion protein with GST in BL-21 cells using the vector pDEST15. Cells were lysed by sonication, and the fusion proteins purified over glutathione sepharose (Pharmacia) according to the manufacturers instructions. For screening of compounds for their influence on the FXR-peptide interaction, the Perkin Elmer LANCE technology was applied. This method relies on the binding dependent energy transfer from a donor to an acceptor fluorophor attached to the binding partner of interest. For ease of handling and reduction of background from compound fluorescence LANCE technology makes use of generic fluorophore labels and time resolved detection Assays were done in a final volume of 25 μL in a 384 well plate, in a Tris-based buffer (20 mM Tris-HCl pH 7.5; 60 mM KCl, 5 mM MgCl2; 35 ng/μL BSA), containing 20-60 ng/well recombinantly expressed FXR-LBD fused to GST, 200-600 nM N-terminally biotinylated peptide, representing SRC1 aminoacids 676-700, 200 ng/well Streptavidin-xlAPC conjugate (Prozyme) and 6-10 ng/well Eu W1024-antiGST (Perkin Elmer). DMSO content of the samples was kept at 1%. After generation of the assay mix and diluting the potentially FXR modulating ligands, the assay was equilibrated for 1 h in the dark at rt in FIA-plates black 384 well (Greiner). The LANCE signal was detected by a Perkin Elmer VICTOR2V Multilabel Counter. The results were visualized by plotting the ratio between the emitted light at 665 and 615 nm. A basal level of FXR-peptide formation is observed in the absence of added ligand.