 BDBM76231 cid_24978582 MLS002153715 SMR001231141 KI-KE
 BDBM76232 cid_24978594 SMR001231145 MLS002153719 KI-SM
 BDBM79258 KI-TG MLS002153658 SMR001231036 cid_25163000
 KE-KI BDBM67003 MLS000560112 cid_25163034 SMR000127334
 KI-GK BDBM79256 cid_25162997 SMR001231033 MLS002153655
 KI-RI MLS002153718 SMR001231144 BDBM79184 cid_24983198
 MLS002153716 KI-KS SMR001231142 BDBM79183 cid_24978591
 cid_24978583 MLS002153714 KI-KG SMR001231140 BDBM79182
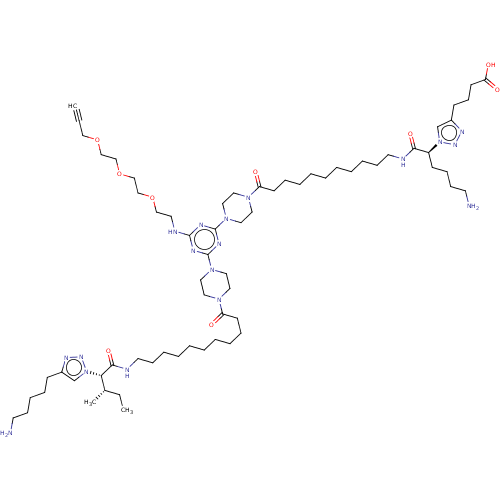 cid_25163003 SMR001231034 KI-EK BDBM79261 MLS002153656
 Fluor-de-Lys Fluorogenic Deacetylase Substrate KI-104 (BioMol Research Laboratories) BDBM25143
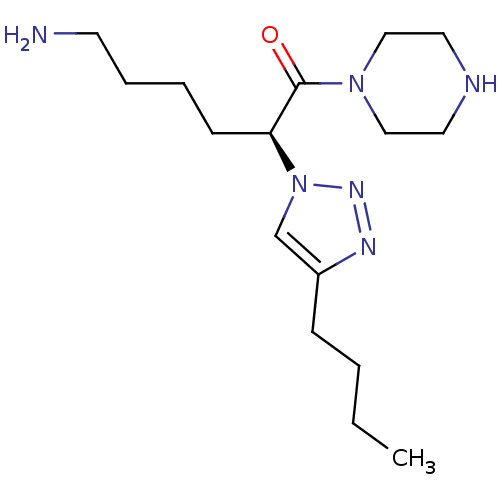 (2S)-6-azanyl-2-(4-butyl-1,2,3-triazol-1-yl)-1-piperazin-1-yl-hexan-1-one;hydrochloride SMR000327432 YU-MONO-KI-DP BDBM52515 MLS000560535 (2S)-6-amino-2-(4-butyl-1-triazolyl)-1-(1-piperazinyl)-1-hexanone;hydrochloride cid_16129542 (2S)-6-amino-2-(4-butyltriazol-1-yl)-1-piperazino-hexan-1-one;hydrochloride (2S)-6-amino-2-(4-butyltriazol-1-yl)-1-piperazin-1-ylhexan-1-one;hydrochloride
- Nacro, K; Sigano, DM; Yan, S; Nicklaus, MC; Pearce, LL; Lewin, NE; Garfield, SH; Blumberg, PM; Marquez, VE An optimized protein kinase C activating diacylglycerol combining high binding affinity (Ki) with reduced lipophilicity (log P). J Med Chem 44: 1892-904 (2001)
- PubChem, PC Late-stage radioligand binding dose response assay to identify inhibitors of NADPH oxidase 1 (NOX1): PDSP screen Ki Set 2 PubChem Bioassay (2011)
- Wentland, MP; Jo, S; Gargano, JM; VanAlstine, MA; Cohen, DJ; Bidlack, JM Redefining the structure-activity relationships of 2,6-methano-3-benzazocines. Part 8. High affinity ligands for opioid receptors in the picomolar Ki range: oxygenated N-(2-[1,1'-biphenyl]-4-ylethyl) analogues of 8-CAC. Bioorg Med Chem Lett 22: 7340-4 (2012)
- Verschueren, WG; Dierynck, I; Amssoms, KI; Hu, L; Boonants, PM; Pille, GM; Daeyaert, FF; Hertogs, K; Surleraux, DL; Wigerinck, PB J Med Chem 48: 1930-40 (2005)
- Atigadda, VR; Xia, G; Deshpande, A; Wu, L; Kedishvili, N; Smith, CD; Krontiras, H; Bland, KI; Grubbs, CJ; Brouillette, WJ; Muccio, DD J Med Chem 58: 7763-74 (2015)
- Cowley, PM; Baker, J; Buchanan, KI; Carlyle, I; Clark, JK; Clarkson, TR; Deehan, M; Edwards, D; Kiyoi, Y; Martin, I; Osbourn, D; Walker, G; Ward, N; Wishart, G Bioorg Med Chem Lett 21: 2034-9 (2011)
- Cha, MY; Choi, BC; Kang, KH; Pae, AN; Choi, KI; Cho, YS; Koh, HY; Lee, HY; Jung, D; Kong, JY Bioorg Med Chem Lett 12: 1327-30 (2002)
- Neustadt, BR; Hao, J; Lindo, N; Greenlee, WJ; Stamford, AW; Tulshian, D; Ongini, E; Hunter, J; Monopoli, A; Bertorelli, R; Foster, C; Arik, L; Lachowicz, J; Ng, K; Feng, KI Bioorg Med Chem Lett 17: 1376-80 (2007)
- Collado, I; Pedregal, C; Bueno, AB; Marcos, A; González, R; Blanco-Urgoiti, J; Pérez-Castells, J; Schoepp, DD; Wright, RA; Johnson, BG; Kingston, AE; Moher, ED; Hoard, DW; Griffey, KI; Tizzano, JP J Med Chem 47: 456-66 (2004)
- Sakamoto, J; Koyama, T; Miyamoto, D; Yingsakmongkon, S; Hidari, KI; Jampangern, W; Suzuki, T; Suzuki, Y; Esumi, Y; Nakamura, T; Hatano, K; Terunuma, D; Matsuoka, K Bioorg Med Chem 17: 5451-64 (2009)
- Lee, JW; Hirota, T; Ono, D; Honma, S; Honma, KI; Park, K; Kay, SA J Med Chem 62: 1989-1998 (2019)
- Woods, KW; McCroskey, RW; Michaelides, MR; Wada, CK; Hulkower, KI; Bell, RL Bioorg Med Chem Lett 11: 1325-8 (2001)
- Urakami, Y; Okuda, M; Masuda, S; Saito, H; Inui, KI J Pharmacol Exp Ther 287: 800-5 (1998)
- Wada, Y; Nakano, S; Morimoto, A; Kasahara, KI; Hayashi, T; Takada, Y; Suzuki, H; Niwa-Sakai, M; Ohashi, S; Mori, M; Hirokawa, T; Shuto, S J Med Chem 60: 3252-3265 (2017)
- Blough, BE; Keverline, KI; Nie, Z; Navarro, H; Kuhar, MJ; Carroll, FI J Med Chem 45: 4029-37 (2002)
- Cho, EH; Shin, HJ; Ki, MH; Kwon, HS; Lee, JW; Joo, JH; Lee, KK; Kim, JM; Park, YB; Kang, SH; Cho, HM; Kim, HT; Ahn, SK; Hong, SP; Kim, SH US Patent US10844062 (2020)
- Park, J; Kim, SC; Ki, SY; Shim, Y US Patent US12180185 (2024)
- Kim, Y; Kim, J; Kim, S; Ki, Y; Seo, SH; Tae, J; Ko, MK; Jang, HS; Lim, EJ; Song, C; Cho, Y; Koh, HY; Chong, Y; Choo, IH; Keum, G; Min, SJ; Choo, H Eur J Med Chem 85: 629-37 (2014)
- Choo, H; Min, SJ; Seo, SH; Kim, JY; Ki, YR; Kim, MJ; Kim, S; Kim, Y US Patent US9260448 (2016)
- Lee, E; An, Y; Kwon, J; Kim, KI; Jeon, R Bioorg Med Chem 25: 3614-3622 (2017)
- Kusakabe, K; Honmura, Y; Uesugi, S; Tonouchi, A; Maeda, H; Kimura, KI; Koshino, H; Hashimoto, M J Nat Prod 80: 1484-1492 (2017)
- Majamaa, K; Günzler, V; Hanauske-Abel, HM; Myllylä, R; Kivirikko, KI J Biol Chem 261: 7819-23 (1986)
- Banno, Y; Sasaki, S; Kamata, M; Kunitomo, J; Miyamoto, Y; Abe, H; Taya, N; Oi, S; Watanabe, M; Urushibara, T; Hazama, M; Niwa, SI; Miyamoto, S; Horinouchi, A; Kuroshima, KI; Amano, N; Matsumoto, SI; Matsunaga, S Bioorg Med Chem 25: 5995-6006 (2017)
- Rombouts, FJR; Kusakabe, KI; Alexander, R; Austin, N; Borghys, H; De Cleyn, M; Dhuyvetter, D; Gijsen, HJM; Hrupka, B; Jacobs, T; Jerhaoui, S; Lammens, L; Leclercq, L; Tsubone, K; Ueno, T; Morimoto, K; Einaru, S; Sumiyoshi, H; Van den Bergh, A; Vos, A; Surkyn, M; Teisman, A; Moechars, D J Med Chem 64: 14175-14191 (2021)
- Lee, KI; Park, Y; Park, SJ; Hwang, JH; Lee, SJ; Kim, GD; Park, WK; Lee, S; Jeong, D; Kong, JY; Kang, HK; Cho, H Bioorg Med Chem Lett 16: 737-42 (2005)
- Kato, T; Ohara, T; Suzuki, N; Muto, S; Tokuyama, R; Mizutani, M; Fukasawa, H; Matsumura, KI; Itai, A Bioorg Med Chem Lett 59: (2022)
- Abdel-Maksoud, MS; El-Gamal, MI; Lee, BS; Gamal El-Din, MM; Jeon, HR; Kwon, D; Ammar, UM; Mersal, KI; Ali, EMH; Lee, KT; Yoo, KH; Han, DK; Lee, JK; Kim, G; Choi, HS; Kwon, YJ; Lee, KH; Oh, CH J Med Chem 64: 6877-6901 (2021)
- McFadden, JM; Medghalchi, SM; Thupari, JN; Pinn, ML; Vadlamudi, A; Miller, KI; Kuhajda, FP; Townsend, CA J Med Chem 48: 946-61 (2005)
- Ishioka, W; Oonuki, S; Iwadate, T; Nihei, KI Bioorg Med Chem Lett 29: 313-316 (2019)
- Kurata, H; Kusumi, K; Otsuki, K; Suzuki, R; Kurono, M; Komiya, T; Hagiya, H; Mizuno, H; Shioya, H; Ono, T; Takada, Y; Maeda, T; Matsunaga, N; Kondo, T; Tominaga, S; Nunoya, KI; Kiyoshi, H; Komeno, M; Nakade, S; Habashita, H J Med Chem 60: 9508-9530 (2017)
- Han Jeong, G; Cho, JH; Park, KI; Kim, K; Hoon Kim, T Bioorg Med Chem Lett 88: (2023)
- Yagupolskii, LM; Antepohl, W; Artunc, F; Handrock, R; Klebanov, BM; Maletina, II; Marxen, B; Petko, KI; Quast, U; Vogt, A; Weiss, C; Zibold, J; Herzig, S J Med Chem 42: 5266-71 (1999)
- Popov KI
- Renuka, J; Reddy, KI; Srihari, K; Jeankumar, VU; Shravan, M; Sridevi, JP; Yogeeswari, P; Babu, KS; Sriram, D Bioorg Med Chem 22: 4924-34 (2014)
- Xu, YZ; Smith, JL; Semko, CM; Rossiter, KI; Fukuda, JY; Dappen, MS; Quincy, DA; Konradi, AW; Mao, W; Welch, B; Dreyer, ML; Samant, B; Zhang, H; Lugar, J; Liao, Z; Henschel, C; Petersen, E; Vandevert, C; Shoemaker, M; Wehner, N; Mutter, L; Shopp, G; Krimm, M; Chen, L; Wipke, B; Dofiles, L; Gallager, I; Sauer, JM; Messersmith, EK; Pleiss, MA; Bard, F; Yednock, TA Bioorg Med Chem Lett 23: 4370-3 (2013)
- Usui, Y; Uehara, F; Hiki, S; Watanabe, K; Tanaka, H; Shouda, A; Yokoshima, S; Aritomo, K; Adachi, T; Fukunaga, K; Sunada, S; Nabeno, M; Saito, KI; Eguchi, JI; Yamagami, K; Asano, S; Tanaka, S; Yuki, S; Yoshii, N; Fujimura, M; Horikawa, T Bioorg Med Chem Lett 27: 3726-3732 (2017)
- Solingapuram Sai, KK; Kil, KE; Tu, Z; Chu, W; Finck, BN; Rothfuss, JM; Shoghi, KI; Welch, MJ; Gropler, RJ; Mach, RH Bioorg Med Chem Lett 22: 6233-6 (2012)
- Kalindjian, SB; Buck, IM; Davies, JM; Dunstone, DJ; Hudson, ML; Low, CM; McDonald, IM; Pether, MJ; Steel, KI; Tozer, MJ; Vinter, JG J Med Chem 39: 1806-15 (1996)
- Chu, XY; Kato, Y; Niinuma, K; Sudo, KI; Hakusui, H; Sugiyama, Y J Pharmacol Exp Ther 281: 304-14 (1997)
- Misawa, T; Tsuji, G; Takahashi, T; Ochiai, E; Takagi, KI; Horie, K; Kakuda, S; Takimoto-Kamimura, M; Kurihara, M; Demizu, Y Bioorg Med Chem 26: 6146-6152 (2018)
- Yamashita, Y; Tanaka, KI; Yamakawa, N; Asano, T; Kanda, Y; Takafuji, A; Kawahara, M; Takenaga, M; Fukunishi, Y; Mizushima, T Bioorg Med Chem 27: 3339-3346 (2019)
- Tahara, A; Tomura, Y; Wada, KI; Kusayama, T; Tsukada, J; Takanashi, M; Yatsu, T; Uchida, W; Tanaka, A J Pharmacol Exp Ther 282: 301-8 (1997)
- Armbrust, K; Romanov Michailidis, F; Worm, KI; Ellis, JM US Patent US11168093 (2021)
- Arichi, N; Fujiwara, S; Ishizawa, M; Makishima, M; Hua, DH; Yamada, KI; Yamaoka, Y; Takasu, K Bioorg Med Chem Lett 27: 3408-3411 (2017)
- Keverline-Frantz, KI; Boja, JW; Kuhar, MJ; Abraham, P; Burgess, JP; Lewin, AH; Carroll, FI J Med Chem 41: 247-57 (1998)
- Rassias, G; Zogali, V; Swarbrick, CMD; Ki Chan, KW; Chan, SA; Gwee, CP; Wang, S; Kaplanai, E; Canko, A; Kiousis, D; Lescar, J; Luo, D; Matsoukas, MT; Vasudevan, SG Eur J Med Chem 180: 536-545 (2019)
- Reum Han, A; Hee Jeon, E; Woo Kim, K; Ki Lee, S; Ohn, CY; Jean Park, S; Sook Kang, N; Koo, TS; Bum Hong, K; Choi, S Bioorg Med Chem 53: (2022)
- Sundaram, A; Chen, C; Isik Reed, N; Liu, S; Ki Yeon, S; McIntosh, J; Tang, YZ; Yang, H; Adler, M; Beresis, R; Seiple, IB; Sheppard, D; DeGrado, WF; Jo, H Bioorg Med Chem Lett 30: (2020)
- Pälvimäki, EP; Roth, BL; Majasuo, H; Laakso, A; Kuoppamäki, M; Syvälahti, E; Hietala, J Psychopharmacology (Berl) 126: 234-40 (1996)
- Käpylä, J; Pentikäinen, OT; Nyrönen, T; Nissinen, L; Lassander, S; Jokinen, J; Lahti, M; Marjamäki, A; Johnson, MS; Heino, J J Med Chem 50: 2742-6 (2007)
- Myllymäki, MJ; Käsnänen, H; Kataja, AO; Lahtela-Kakkonen, M; Saario, SM; Poso, A; Koskinen, AM Eur J Med Chem 44: 4179-91 (2009)
- Wágner, G; Wéber, C; Nyéki, O; Nógrádi, K; Bielik, A; Molnár, L; Bobok, A; Horváth, A; Kiss, B; Kolok, S; Nagy, J; Kurkó, D; Gál, K; Greiner, I; Szombathelyi, Z; Keseru, GM; Domány, G Bioorg Med Chem Lett 20: 3737-41 (2010)
- Pälvimäki, EP; Roth, BL; Majasuo, H; Laakso, A; Kuoppamäki, M; Syvälahti, E; Hietala, J Psychopharmacology (Berl) 126: 234-40 (1996)
- Riihimäki-Lampén, LH; Vainio, MJ; Vahermo, M; Pohjala, LL; Heikura, JM; Valkonen, KH; Virtanen, VT; Yli-Kauhaluoma, JT; Vuorela, PM J Med Chem 53: 514-8 (2010)
- Abbott uPA__Urokinase Human - Ki(uM) Abbott uPA__Urokinase Human - Ki(uM)
- ChEMBL_879209 (CHEMBL2208522) Inhibition of Ki-Ras
- ChEBML_158078 Apparent binding constant Ki=Kon/Koff
- ChEBML_209778 Inhibition of human Thymidylate synthase (Ki)
- ChEBML_212901 Inhibition constant (Ki) against trypsin enzyme.
- ChEBML_210404 Inhibitory activity against thermolysin expressed as Ki
- ChEBML_51195 Inhibitory constant (Ki) for Cytochrome P450 19A1
- ChEMBL_158078 (CHEMBL764907) Apparent binding constant Ki=Kon/Koff
- ChEMBL_212901 (CHEMBL822094) Inhibition constant (Ki) against trypsin enzyme.
- ChEMBL_302371 (CHEMBL830340) Ki value against carbonic anhydrase I
- ChEMBL_302511 (CHEMBL828226) Ki for human Neurokinin 2 receptor
- ChEMBL_63831 (CHEMBL878397) Apparent binding constant Ki=Kon/Koff
- ChEMBL_440178 (CHEMBL890492) Ratio of Ki for mouse wild type C1b domain of PKCdelta to Ki for mouse PKCdelta C1b Q27E mutant
- ChEBML_143633 The apparent Ki value against NS3-4Apep protease
- ChEBML_143634 The apparent Ki value against NS3-4Apep protease
- ChEBML_208949 Inhibition of Thymidylate synthase of Escherichia coli (Ki)
- ChEBML_30803 Inhibition constant (Ki) against calf intestine adenosine deaminase
- ChEBML_30977 Inhibition constant (Ki) against Human erythrocyte adenosine deaminase
- ChEBML_40718 Inhibition constant (Ki) for TEM-1 beta-lactamase
- ChEBML_96762 Apparent Ki for rat Lanosterol 14-alpha demethylase
- ChEMBL_162229 (CHEMBL770293) Binding affinity (Ki) towards Protein kinase C
- ChEMBL_210404 (CHEMBL814133) Inhibitory activity against thermolysin expressed as Ki
- ChEMBL_212556 (CHEMBL815775) log1/Ki value was calculated against Trypsin
- ChEMBL_302337 (CHEMBL875195) Ki value against bovine alpha-L-fucosidase
- ChEMBL_302341 (CHEMBL828925) Ki value against human carbonic anhydrase I
- ChEMBL_302349 (CHEMBL828932) Ki value against human carbonic anhydrase II
- ChEMBL_302350 (CHEMBL828071) Ki value against human carbonic anhydrase VII
- ChEMBL_302395 (CHEMBL840830) Ki value against murine carbonic anhydrase XIII
- ChEMBL_302396 (CHEMBL829641) Ki value against murine carbonic anhydrase XIII
- ChEMBL_302408 (CHEMBL828813) Ki value against human carbonic anhydrase III
- ChEMBL_302409 (CHEMBL828814) Ki value against human carbonic anhydrase VII
- ChEMBL_302420 (CHEMBL828824) Ki value against mouse carbonic anhydrase VII
- ChEMBL_302434 (CHEMBL827132) Ki value against mouse carbonic anhydrase XIII
- ChEBML_51028 Inactivation rate (Ki) of human placental Cytochrome P450 19A1
- ChEMBL_106844 (CHEMBL713185) Binding constant (Ki) at mouse Melanocortin-3 receptor
- ChEMBL_152907 (CHEMBL758630) Binding affinity (Ki) against human phosphatidylinositol 4-kinase
- ChEMBL_196044 (CHEMBL802221) Binding affinity against HIV reverse transcriptase (Estimated Ki)
- ChEMBL_208359 (CHEMBL813669) In vitro inhibition constant (Ki) against human thrombin
- ChEMBL_208890 (CHEMBL814947) Competitive kinetic for thrombin inhibition Ki was determined
- ChEMBL_222780 (CHEMBL847109) Inhibitory constant (Ki) was determined against human plasmin
- ChEMBL_225570 (CHEMBL847040) Inhibitory constant (Ki) was determined against human thrombin
- ChEMBL_225793 (CHEMBL845143) Inhibitory constant (Ki) was determined against human trypsin
- ChEMBL_302296 (CHEMBL827057) Ki value for rat Muscarinic acetylcholine receptor M3
- ChEMBL_30784 (CHEMBL645061) Binding affinity (Ki) at calf intestinal Adenosine deaminase
- ChEMBL_30785 (CHEMBL645062) Binding affinity (Ki) at calf intestinal adenosine deaminase.
- ChEMBL_41561 (CHEMBL655898) -Log (Ki) value for butyrylcholinesterase by inhibiting DFP
- ChEMBL_51039 (CHEMBL857512) Apparent inhibition constant (Ki) for cytochrome P450 19A1
- ChEMBL_89213 (CHEMBL699705) Inhibition constant (Ki) for human intestinal peptide carrier
- ChEBML_71843 Inhibition towards glutamate racemase was determined and expressed as KI
- ChEBML_85641 Evaluated for the inhibition constant Ki against Hexokinase, type II
- ChEMBL_302370 (CHEMBL830339) Ki value against human carbonic anhydrase I (hCA I)
- ChEMBL_302394 (CHEMBL829640) Ki value against human carbonic anhydrase II (hCA II)
- ChEMBL_302410 (CHEMBL828815) Ki value against human carbonic anhydrase XII (hCA XII)
- ChEMBL_51028 (CHEMBL664585) Inactivation rate (Ki) of human placental Cytochrome P450 19A1
- ChEBML_152660 Kinetic parameter (Ki mM) was evaluated for the inactivation of papain
- ChEBML_200166 Inhibition constant (KI) for inactivation of semicarbazide-sensitive amine oxidase (SSAO)
- ChEBML_218507 Ki value was evaluated for the inhibition of human leukocyte elastase
- ChEBML_54731 Apparent inhibitory (log 1/Ki) activity against Escherichia coli dihydrofolate reductase
- ChEMBL_104809 (CHEMBL709694) Competitive inhibition of rat methionine adenosyltransferase, activity expressed as Ki
- ChEMBL_122768 (CHEMBL730877) Evaluated for (Ki value) in competition with oxidation of benzylamine.
- ChEMBL_122769 (CHEMBL730878) Evaluated for (Ki value) inactivation of Monoamine oxidase at saturation.
- ChEMBL_155397 (CHEMBL765938) In vitro inhibition constant (Ki) against human plasmin was determined
- ChEMBL_160973 (CHEMBL766364) Competitive kinetic for human alpha thrombin inhibition Ki was determined
- ChEMBL_212564 (CHEMBL814922) In vitro inhibition constant (Ki) against human trypsin was determined
- ChEMBL_213296 (CHEMBL814351) log1/Ki value was calculated against Urokinase-type plasminogen activator
- ChEMBL_2315354 Binding affinity to human HDAC11 assessed as inhibition constant (ki,1)
- ChEMBL_27855 (CHEMBL642280) Inhibitory constant (Ki) was determined against human Activated protein C
- ChEMBL_35266 (CHEMBL648572) Ki value was evaluated against Angiotensin II receptor, type 1
- ChEMBL_35424 (CHEMBL643598) Ki value was evaluated against Angiotensin II receptor, type 2
- ChEMBL_51030 (CHEMBL662243) Inactivation rate (Ki) for human placental aromatase Cytochrome P450 19A1
- ChEMBL_51040 (CHEMBL662252) Apparent inhibition constant (Ki) for cytochrome P450 19A1 with androstenedione
- ChEMBL_69685 (CHEMBL682021) Inhibitory activity against factor Xa, activity expressed as Ki nM
- ChEMBL_71843 (CHEMBL681701) Inhibition towards glutamate racemase was determined and expressed as KI
- ChEBML_35365 Effect of inhibitor structure on the slow binding inhibition of aminopeptidase M was determined and Ki* was reported which is obtained by the equation Ki[k4/(k3 + k4)]
- Papain Inhibition Assay Enzyme activities were calculated from kinetic measurements performed by spectrophotometric detection of the product p-nitroaniline (pNA) at wavelength of 405 nm. Progress curves were monitored over 10 min. Rate was determined for 7 different inhibitor concentrations in duplicate. The apparent inhibition constant, Ki (app) was determined by fitting equation to the experimental data. The true inhibition constant, Ki values were calculated by correction of Ki (app) according to the equation: Ki = Ki(app) /(1 + [S]/Km).
- ChEBML_104983 Inhibitory constant against rat liver Methionine adenosyltransferase I, activity expressed as Ki
- ChEBML_142789 The inhibitory constant(Ki) value for Norepinephrine N-methyl-transferase was calculated
- ChEBML_47631 Kinetic parameter (Ki mM) was evaluated for the inactivation of cathepsin B
- ChEMBL_152334 (CHEMBL758716) Ki value was evaluated for the inhibition of porcine pancreatic elastase
- ChEMBL_196794 (CHEMBL799737) Ability to inhibit simian virus reverse transcriptase, expressed as log Ki.
- ChEMBL_212513 (CHEMBL817578) In vitro inhibition constant (Ki) against human bovine trypsin was determined
- ChEMBL_2315300 Binding affinity to HDAC3 (unknown origin) assessed as inhibition constant(ki,1)
- ChEMBL_2315301 Binding affinity to HDAC8 (unknown origin) assessed as inhibition constant(ki,1)
- ChEMBL_2315309 Binding affinity to HDAC2 (unknown origin) assessed as inhibition constant(ki,1)
- ChEMBL_2315310 Binding affinity to HDAC1 (unknown origin) assessed as inhibition constant(ki,1)
- ChEMBL_49311 (CHEMBL663410) Inhibitory constant (Ki) was determined against human Coagulation factor Xa (fXa)
- ChEMBL_54544 (CHEMBL872482) Binding constant(Ki) to dihydrofolate reductase (DHFR) Phe -31 was determined
- ChEMBL_54546 (CHEMBL664862) Binding constant(Ki) to dihydrofolate reductase (DHFR) Val -31 was determined
- ChEMBL_54731 (CHEMBL668771) Apparent inhibitory (log 1/Ki) activity against Escherichia coli dihydrofolate reductase
- ChEMBL_62090 (CHEMBL674970) Affinity at dopamine D2 receptor, (For haloperidol Ki(nM)= 1.5+/-1.2)
- ChEMBL_70570 (CHEMBL682097) Inhibition of [3H]FPP incorporation into human Ki-Ras by farnesyltransferase
- ChEMBL_96636 (CHEMBL705708) Ki value was evaluated for the inhibition of human leukocyte elastase
- ChEMBL_98524 (CHEMBL706544) Inhibition of leucine aminopeptidase; Ki value reporting the slope effect(Kis)
- ChEMBL_35361 (CHEMBL647943) Effect of inhibitor structure on the slow binding inhibition of aminopeptidase M was determined and Ki* was reported which is obtained by the equation Ki[k4/(k3 + k4)]
- ChEMBL_35365 (CHEMBL647946) Effect of inhibitor structure on the slow binding inhibition of aminopeptidase M was determined and Ki* was reported which is obtained by the equation Ki[k4/(k3 + k4)]
- ChEMBL_98518 (CHEMBL706539) Effect of inhibitor structure on the slow binding inhibition of Leucine aminopeptidase was determined and Ki* was reported which is obtained by the equation Ki[k4/(k3 + k4)]
- ChEMBL_98522 (CHEMBL706542) Effect of inhibitor structure on the slow binding inhibition of Leucine aminopeptidase was determined and Ki* was reported which is obtained by the equation Ki[k4/(k3 + k4)]
- ChEBML_31100 Compound was evaluated for competitive inhibition of adenosine deaminase and expressed as Ki
- ChEMBL_105120 (CHEMBL713238) Inhibitory constant against rat kidney Methionine adenosyltransferase II, activity expressed as Ki
- ChEMBL_123023 (CHEMBL729208) Apparent inhibitory constant (Ki) for Bufuralol 1'-hydroxylation by human liver microsomes
- ChEMBL_138494 (CHEMBL749723) Inhibition constant (Ki mut) against A16V+S108T Mutant DHFRs of Plasmodium falciparum
- ChEMBL_152587 (CHEMBL759765) Dissociation constant(Ki) of compound was determined to measure PNMT-inhibitory potency
- ChEMBL_152588 (CHEMBL759766) Dissociation constant(Ki) of compound was determined to measure PNMT-inhibitory potency
- ChEMBL_152659 (CHEMBL761585) Kinetic parameter (Ki 1/min) was evaluated for the inactivation of papain
- ChEMBL_1623 (CHEMBL616509) Affinity at 5-hydroxytryptamine 1D receptor (For sumatriptan = Ki (nM)-12+/-1.9)
- ChEMBL_202133 (CHEMBL808122) Ratio of Ki value towards Serotonin transporter to that of dopamine transporter
- ChEMBL_2205 (CHEMBL617030) Affinity at 5-hydroxytryptamine 2 receptor (For ketanserin = Ki(nM)= 0.7+/-0.09)
- ChEMBL_3141 (CHEMBL617983) Affinity at 5-hydroxytryptamine 3 receptor (For granisetron = Ki (nM)=0.3+/-0.01)
- ChEMBL_33042 (CHEMBL858268) Compound was evaluated for log 1/Ki at alpha-2 adrenergic receptor
- ChEMBL_33103 (CHEMBL645956) Compound was evaluated for log 1/Ki at alpha-1 adrenergic receptor
- ChEMBL_33963 (CHEMBL649588) Inhibitory activity against alpha-L-Fucosidase of bovine epididymis expressed as Ki
- ChEMBL_33964 (CHEMBL649589) Inhibitory activity against alpha-L-fucosidase of bovine epididymis expressed as Ki
- ChEMBL_34090 (CHEMBL647982) Inhibitory activity against alpha-L-Fucosidase of human placenta expressed as Ki
- ChEMBL_34109 (CHEMBL649738) Compound was evaluated for inactivation of bovine alpha-Chymotrypsin Kinetic constant(Ki)
- ChEMBL_39198 (CHEMBL654493) Inhibitory activity against Beta-D-galactosidase of Aspergillus niger expressed as Ki
- ChEMBL_47625 (CHEMBL659834) Compound is evaluated for inhibition kinetic constant Ki for the cathepsin B
- ChEMBL_48804 (CHEMBL662829) In vitro inhibition constant (Ki) against human Coagulation factor X was determined
- ChEMBL_52535 (CHEMBL665307) Apparent Ki (binding affinity) was calculated for the compound against cytidine deaminase.
- ChEMBL_769057 (CHEMBL1832520) Competitive inhibition of HDAC1 using KI-104 as substrate by fluorescence assay
- ChEMBL_769058 (CHEMBL1832521) Competitive inhibition of HDAC2 using KI-104 as substrate by fluorescence assay
- ChEMBL_769059 (CHEMBL1832522) Competitive inhibition of HDAC3 using KI-104 as substrate by fluorescence assay
- ChEMBL_769060 (CHEMBL1832523) Competitive inhibition of HDAC4 using KI-104 as substrate by fluorescence assay
- ChEMBL_769061 (CHEMBL1832524) Competitive inhibition of HDAC5 using KI-104 as substrate by fluorescence assay
- ChEMBL_769062 (CHEMBL1832525) Competitive inhibition of HDAC6 using KI-104 as substrate by fluorescence assay
- ChEMBL_769063 (CHEMBL1832526) Competitive inhibition of HDAC7 using KI-104 as substrate by fluorescence assay
- ChEMBL_769064 (CHEMBL1832527) Competitive inhibition of HDAC8 using KI-104 as substrate by fluorescence assay
- ChEMBL_769065 (CHEMBL1832528) Competitive inhibition of HDAC9 using KI-104 as substrate by fluorescence assay
- ChEMBL_769066 (CHEMBL1832529) Competitive inhibition of HDAC10 using KI-104 as substrate by fluorescence assay
- ChEMBL_769067 (CHEMBL1832530) Competitive inhibition of HDAC11 using KI-104 as substrate by fluorescence assay
- ChEMBL_98523 (CHEMBL706543) Competitive inhibition of leucine aminopeptidase; Ki value reporting the slope effect(Kis)
- ChEMBL_98525 (CHEMBL706545) Competitive inhibition of leucine aminopeptidase; Ki value reporting the slope effect(Kis)
- ChEBML_154778 Dissociation constant (KI) for the Pancreatic cholesterol esterase-catalyzed hydrolysis of 4-nitrophenyl butyrate
- ChEBML_210261 Displacement of [3H]-U-46,619 from human TP-receptor expressed in CHO-KI cells
- ChEBML_210303 Inactivation of thymidylate synthetase measured as Ki at 6.8 pH 30 degrees Celsius temp
- ChEBML_28133 Inhibition constant (Ki) against electric eel Acetylcholinesterase as Km/Vmax versus inhibitor concentration replot
- ChEBML_54602 Inhibition of Dihydrofolate reductase (DHFR) enzyme derived from L1210 cells expressed as Ki (pM)
- ChEBML_59304 Kinetic constant for inhibition (KI) of Dopamine beta-Hydroxylase (DBH) from bovine adrenal medulla
- ChEBML_64658 Rate constant for the compound was determined (k2/ki) against human leukocyte elastase (HLE)
- ChEBML_83827 Evaluated for antagonist activity against histamine H3 receptor and is represented as -log Ki.
- ChEMBL_1265864 (CHEMBL3039490) Ki values for sodium fluorescein (10 uM) uptake in OATP1B1-transfected CHO cells
- ChEMBL_1265867 (CHEMBL3039493) Ki values for sodium fluorescein (10 uM) uptake in OATP1B3-transfected CHO cells
- ChEMBL_207890 (CHEMBL808466) Inhibitory constant (Ki) was determined against human Tissue plasminogen activator (tissue plasminogen activator)
- ChEMBL_208070 (CHEMBL814420) In vitro inhibition constant (Ki) against human Tissue type plasminogen activator was determined
- ChEMBL_208199 (CHEMBL819102) Affinity towards cytoplasmic Thymidine kinase relative ot TdR; expressed as KM (TdR)/Ki
- ChEMBL_33942 (CHEMBL649568) Inhibitory activity against alpha-L-fucosidase of bacillus species (K40T) expressed as Ki
- ChEMBL_47630 (CHEMBL659839) Kinetic parameter (Ki 1/min) was evaluated for the inactivation of cathepsin B
- ChEMBL_50738 (CHEMBL660770) KI value was determined from plots of 1/kinact(observed) vs 1/[inhibitor]
- ChEMBL_54734 (CHEMBL667185) Negative logarithm of inhibition constant (-log Ki) against Dihydrofolate reductase in Escherichia coli
- ChEMBL_635632 (CHEMBL1119082) Displacement of [3H]niacin from human niacin receptor expressed in CHO-KI cells
- ChEMBL_70272 (CHEMBL681411) In vitro inhibition of farnesylation of v-Ki-Ras by bovine farnesyl transferase
- ChEMBL_70438 (CHEMBL681295) In vitro inhibition of Ha-ras farnesylation in Ki-ras-transformed NIH3T3 cells
- ChEMBL_71842 (CHEMBL681700) Inhibition towards glutamate racemase from Lactobacillus fermenti was determined and expressed as KI
- ChEMBL_99762 (CHEMBL715302) Kinetic constant (KI) was calculated by inhibition of monoamino oxidase B (MAO B)
- ChEMBL_99763 (CHEMBL857621) Kinetic constant (KI) was calculated by inhibition of monoamino oxidase B (MAO B)
- Radioligand Binding Assay The D2 binding Ki values were determined using a radioligand binding assay.
- Enzyme Inhibition Assay Enzymes were incubated with inhibitors at eight inhibitor concentrations bracketing the Ki, prepared by serial dilution along with control lacking the inhibitor. Substrate was added, and initial rate of substrate hydrolysis were determined using a UV/MAX Kinetic Microplate Reader. Ki values were determined with BatchKi or true Ki values with DYNAFIT.
- ChEBML_152576 Dissociation constant(Ki) of compound was determined to measure Phenylethanolamine N-methyl-transferase inhibitory potency
- ChEBML_154779 Bimolecular rate constant (ki) for the Pancreatic cholesterol esterase-catalyzed hydrolysis of 4-nitrophenyl butyrate
- ChEBML_196865 Activity determined in mouse liver S-adenosyl-L-homocysteine hydrolase and expressed as KI values.
- ChEBML_29103 Displacement of [3H]CHA from Adenosine A1 receptor in bovine cortical membrane expressed as Ki
- ChEBML_45615 Compound was evaluated for binding affinity against carboxypeptidase A (CPA), expressed as inhibitory constant (Ki)
- ChEBML_70678 KI for pyridoxal 5'-phosphate (PLP)-dependent Gamma-amino-N-butyrate transaminase at pH 7.4
- ChEMBL_105851 (CHEMBL717321) Binding affinity towards Melanocortin 1 receptor, expressed as negative log of the Ki value
- ChEMBL_106029 (CHEMBL718201) Binding affinity towards Melanocortin 3 receptor, expressed as negative log of the Ki value
- ChEMBL_106493 (CHEMBL717597) Binding affinity towards Melanocortin 4 receptor, expressed as negative log of the Ki value
- ChEMBL_106664 (CHEMBL714017) Binding affinity towards Melanocortin 5 receptor, expressed as negative log of the Ki value
- ChEMBL_106665 (CHEMBL714018) Binding affinity towards Melanocortin 5 receptor, expressed as negative log of the Ki value
- ChEMBL_123021 (CHEMBL729206) Inhibitory effect on Bufuralol 1'-hydroxylation by human liver microsomes (Ki = apparent inhibition constant)
- ChEMBL_123828 (CHEMBL734266) Evaluated for the competitive inhibition constant Ki against ATP varied rat mitochondrial thymidine kinase
- ChEMBL_124551 (CHEMBL857623) Inactivation of monoamine oxidase measured as kinetic constant, KI at 0.2-10 conc range
- ChEMBL_124553 (CHEMBL734347) Inactivation of monoamine oxidase measured as kinetic constant, KI at 0.8-4 conc range
- ChEMBL_124554 (CHEMBL734348) Inactivation of monoamine oxidase measured as kinetic constant, KI at 1-10 conc range
- ChEMBL_124555 (CHEMBL734349) Inactivation of monoamine oxidase measured as kinetic constant, KI at 1-5 conc range
- ChEMBL_154778 (CHEMBL761498) Dissociation constant (KI) for the Pancreatic cholesterol esterase-catalyzed hydrolysis of 4-nitrophenyl butyrate
- ChEMBL_157958 (CHEMBL766820) Displacement of [3H]PGF-2 from human FP-receptor expressed in CHO-KI cells
- ChEMBL_157959 (CHEMBL766821) Displacement of [3H]PGF2-alpha from human FP-receptor expressed in CHO-KI cells
- ChEMBL_2068107 (CHEMBL4723360) Inhibition of wild-type FGFR4 (unknown origin) assessed as ratio of Kinact to Ki
- ChEMBL_210303 (CHEMBL808548) Inactivation of thymidylate synthetase measured as Ki at 6.8 pH 30 degrees Celsius temp
- ChEMBL_213566 (CHEMBL816123) Evaluated for competitive inhibition against Vesicular glutamate transporter (VGLUT), and Ki value was reported.
- ChEMBL_216586 (CHEMBL821378) Evaluated for inhibition constant (Ki wt) against Wild-type dihydrofolate reductase of Plasmodium falciparum
- ChEMBL_32047 (CHEMBL644147) Competitive binding inhibition constant (Ki) of rat adenylate kinase (AK II) isozymes was determined
- ChEMBL_32048 (CHEMBL644148) Competitive binding inhibition constant(Ki) of rat adenylate kinase (AK II) isozymes was determined
- ChEMBL_64658 (CHEMBL674810) Rate constant for the compound was determined (k2/ki) against human leukocyte elastase (HLE)
- ChEMBL_700673 (CHEMBL1645712) Ratio of Ki for EP4 receptor to EP4 receptor in presence of 10% HSA
- ChEMBL_83827 (CHEMBL691844) Evaluated for antagonist activity against histamine H3 receptor and is represented as -log Ki.
- ChEBML_139845 Binding affinity towards human muscarinic M1 receptor in CHO-KI cells using [3H]- QNB as radioligand
- ChEBML_140092 Binding affinity towards human muscarinic M2 receptor in CHO-KI cells using [3H]- QNB as radioligand
- ChEBML_196404 Ki value was determined by accumulation of c-AMP in S-49 mouse lymphoma cells (Beta2).
- ChEBML_208402 Apparent Ki value was measured by competitive inhibition of Thymidylate Synthases from L1210 cells of mouse
- ChEBML_27376 Compound was evaluated for reversible inhibition of hydrolysis acetylcholine by acetylcholinesterase and represented as KI(competitive)
- ChEBML_41572 Compound was evaluated for the protection of butyrylcholinesterase against DFT in mice and expressed as Ki.
- ChEBML_45064 Compound was tested in vitro for binding affinity against human carbonic anhydrase II; (ki*10e-9)
- ChEMBL_138604 (CHEMBL748154) Evaluated for inhibition constant (Ki mut) against A16V+S108T Mutant dihydrofolate reductase of Plasmodium falciparum
- ChEMBL_152576 (CHEMBL759754) Dissociation constant(Ki) of compound was determined to measure Phenylethanolamine N-methyl-transferase inhibitory potency
- ChEMBL_152589 (CHEMBL759767) Dissociation constant(Ki) of compound was determined to measure Phenylethanolamine N-methyl-transferase inhibitory potency
- ChEMBL_154779 (CHEMBL873410) Bimolecular rate constant (ki) for the Pancreatic cholesterol esterase-catalyzed hydrolysis of 4-nitrophenyl butyrate
- ChEMBL_157805 (CHEMBL766784) Displacement of [3H]PGE-2 from Prostaglandin E receptor EP1 expressed in CHO-KI cells
- ChEMBL_210407 (CHEMBL814136) pKi value expresses binding affinity against thermolysin pKi = -logKi (where Ki is in mol/L)
- ChEMBL_2304704 Inhibition of human carbonic anhydrase 2 assessed as Ki by stopped-flow carbon dioxide hydration assay
- ChEMBL_2304705 Inhibition of human carbonic anhydrase 9 assessed as Ki by stopped-flow carbon dioxide hydration assay
- ChEMBL_32062 (CHEMBL644160) Non competitive binding inhibition constant (Ki) of rat adenylate kinase (AK II) isozymes was determined
- ChEMBL_32063 (CHEMBL644161) Non competitive binding inhibition constant(Ki) of rat adenylate kinase (AK III) isozymes was determined
- ChEMBL_35371 (CHEMBL647952) Inhibition of aminopeptidase M or membrane leucine aminopeptidase; Ki value reporting the slope effect(Kis)
- ChEMBL_35485 (CHEMBL644596) Inhibition of aminopeptidase M or membrane leucine aminopeptidase; Ki value reporting the slope effect(Kis)
- ChEMBL_90978 (CHEMBL696525) Inhibition of IL-1 beta converting enzyme (ICE) in human blood monocytes expressed as Ki
- Fluorometric Assay The Ki value were determine by a fluorometric assay with the fluorogenic and chromogenic substrate.
- CB Receptor Radioligand Binding Assay (Ki) IC50 values for test compounds were determined from nonlinear regression analysis of data collected from ligand displacement experiments. The inhibition constant (Ki) was calculated from IC50 value by the Cheng and Prusoff equation.
- ChEBML_103126 The inhibitory constant(Ki) for MTA phosphorylase activity was determined by using a mouse liver enzyme preparation
- ChEBML_209133 Ability to inhibit the thymidylate synthase from Lactobacillus casei was determined and expressed as inhibition constant(Ki)
- ChEBML_35486 Non-competitive inhibition of aminopeptidase M or membrane leucine aminopeptidase; Ki value reporting the intercept effect(Kii)
- ChEBML_49250 Inhibition constant (KI) for the mmf chitin synthetase assay performed at constant inhibitor and varying substrate concentrations
- ChEMBL_157813 (CHEMBL769418) Displacement of [3H]PGE-2 from human Prostaglandin E receptor EP3 expressed in CHO-KI cells
- ChEMBL_1827374 (CHEMBL4327248) Inhibition of FTase (unknown origin) assessed as reduction in transfer of [3H]FPP to Ki-Ras
- ChEMBL_199536 (CHEMBL801405) The inhibitory activity (Ki) of the deprotonated compound was measured against scytalone dehydratase at pH 9.8
- ChEMBL_199537 (CHEMBL801406) The inhibitory activity (Ki) of the protonated compound was measured against scytalone dehydratase at pH 7.0
- ChEMBL_200332 (CHEMBL804825) Evaluated for the Non-competitive inhibition constant Ki against TdR varied rat cytoplasmic soluble thymidine kinase
- ChEMBL_2068108 (CHEMBL4723361) Inhibition of wild-type FGFR4 C477A mutant (unknown origin) assessed as ratio of Kinact to Ki
- ChEMBL_208400 (CHEMBL815509) Apparent Ki value was measured by competitive inhibition of Thymidylate Synthase from L1210 cells of mouse
- ChEMBL_208402 (CHEMBL815511) Apparent Ki value was measured by competitive inhibition of Thymidylate Synthases from L1210 cells of mouse
- ChEMBL_213564 (CHEMBL816121) Compound was evaluated for competitive inhibition against Vesicular glutamate transporter (VGLUT), and Ki value was reported.
- ChEMBL_27375 (CHEMBL642521) Compound was evaluated for reversible inhibition of hydrolysis acetylcholine by acetylcholinesterase and represented as KI(com)
- ChEMBL_27376 (CHEMBL642409) Compound was evaluated for reversible inhibition of hydrolysis acetylcholine by acetylcholinesterase and represented as KI(competitive)
- ChEMBL_27377 (CHEMBL642410) Compound was evaluated for reversible inhibition of hydrolysis acetylcholine by acetylcholinesterase and represented as KI(noncompetitive)
- ChEMBL_35372 (CHEMBL647953) Competitive inhibition of aminopeptidase M or membrane leucine aminopeptidase; Ki value reporting the slope effect(Kis)
- ChEMBL_36194 (CHEMBL649363) Dissociation constant (KI) was evaluated as inhibitor of murine liver aromatic L-amino acid decarboxylase (AADC)
- ChEMBL_41572 (CHEMBL654866) Compound was evaluated for the protection of butyrylcholinesterase against DFT in mice and expressed as Ki.
- ChEMBL_45064 (CHEMBL659847) Compound was tested in vitro for binding affinity against human carbonic anhydrase II; (ki*10e-9)
- ChEMBL_635633 (CHEMBL1119525) Agonist activity at human niacin receptor expressed in CHO-KI cells by [35S]GTPgammaS binding assay
- ChEMBL_89 (CHEMBL615209) Evaluated for its activity to inhibit rat liver 2,3-oxidosqualene-lanosterol cyclase, activity expressed as Ki
- Determination of Inhibitor Ki The reaction was started by addition of pNPP substrate, and reaction progress was monitored at 405 nm. The initial rate data collected was used for determination of Ki values. For Ki determination, the kinetic values were obtained directly from nonlinear regression of substrate-velocity curves in the presence of various concentrations of inhibitor. Each inhibitor Ki value was determined using at least 6 independent measurements and at least two enzyme concentrations (final concentration of enzyme: 25 nM and 12.5 nM).
- Enzyme Assay and Determination of the Inhibition Constants Each enzyme was assayed with a set of different concentrations of each inhibitor. After addition of the appropriate substrate, the rate of hydrolysis was measured by monitoring the increase in absorbance at 405 nM for 5 minutes. Ki(apparent) values were calculated from enzyme velocity curves using the software package BatchKi (BioKin Ltd, Madison, WI). These apparent inhibition constants were then converted to Ki values by assuming competitive inhibition and using the formula Ki = Ki(apparent)/(1 + S/Km).
- ChEBML_59141 Compound was determined for the kinetic constant against Dopamine beta hydroxylase purified from beef adrenals, inhibitory constant (Ki)
- ChEMBL_123829 (CHEMBL734267) Evaluated for the mixed objective Non-competitive inhibition constant Ki against TdR varied rat mitochondrial thymidine kinase
- ChEMBL_146344 (CHEMBL753793) Ki value determined against Opioid receptor delta 1 using [3H]DPDPE at the Kd concentration 2.1 nM
- ChEMBL_148518 (CHEMBL758128) Ki value determined against Opioid receptor mu 1 using [3H]DAMGO at the Kd concentration 0.57 nM
- ChEMBL_201561 (CHEMBL804716) Ki value determined against Sigma opioid receptor type 1 using [(+)-[3H]pentazocine at the Kd concentration 2nM
- ChEMBL_202760 (CHEMBL807845) Evaluated for the mixed objective Non-competitive inhibition constant Ki against ATP varied cytoplasmic soluble thymidine kinase
- ChEMBL_208399 (CHEMBL815508) Apparent Ki value was measured by competitive inhibition of Thymidylate Synthase from Ehrlich Carcinoma cells of mouse
- ChEMBL_209133 (CHEMBL814651) Ability to inhibit the thymidylate synthase from Lactobacillus casei was determined and expressed as inhibition constant(Ki)
- ChEMBL_209297 (CHEMBL811753) Ability to inhibit the thymidylate synthase from Lactobacillus casei was determined and expressed as inhibition constant (Ki)
- ChEMBL_210333 (CHEMBL814752) Competitive inhibition of the human thymidylate synthase at 28 uM as Ki(slope) of 5,10-CH2-H4PteGlu
- ChEMBL_210334 (CHEMBL814753) Competitive inhibition of the human thymidylate synthase at 600 uM as Ki(slope) of 5,10-CH2-H4PteGlu
- ChEMBL_2315293 Binding affinity to HDAC1 (unknown origin) using Ac-LGKac-AMC as substrate assessed as inhibition constant(ki,1)
- ChEMBL_2315294 Binding affinity to HDAC2 (unknown origin) using Ac-LGKac-AMC as substrate assessed as inhibition constant(ki,1)
- ChEMBL_2315295 Binding affinity to HDAC3 (unknown origin) using Ac-LGKac-AMC as substrate assessed as inhibition constant(ki,1)
- ChEMBL_27378 (CHEMBL642411) Compound was evaluated for reversible inhibition of hydrolysis of acetylcholine by acetylcholinesterase and represented as KI(competitive)
- ChEMBL_30291 (CHEMBL639461) Effective concentration for cAMP production in CHO-KI cells stably transfected with human adenosine A2B receptor cDNA
- ChEMBL_31698 (CHEMBL645779) Displacement of [125I]AB-MECA from human Adenosine A3 receptor expressed in CHO cells expressed as Ki
- ChEMBL_35486 (CHEMBL644597) Non-competitive inhibition of aminopeptidase M or membrane leucine aminopeptidase; Ki value reporting the intercept effect(Kii)
- ChEMBL_35487 (CHEMBL875008) Non-competitive inhibition of aminopeptidase M or membrane leucine aminopeptidase; Ki value reporting the slope effect(Kis)
- ChEMBL_49250 (CHEMBL660670) Inhibition constant (KI) for the mmf chitin synthetase assay performed at constant inhibitor and varying substrate concentrations
- ChEMBL_86764 (CHEMBL698664) Evaluated for antagonistic activity at histamine H3 receptor in rat cerebral cortex and is represented as Ki
- ChEMBL_86895 (CHEMBL698405) Evaluated for antagonistic activity at histamine H3 receptor in rat cerebral cortex and is represented as Ki.
- Radioligand Binding Assay IC50 values were obtained by fitting the competition binding curves according to a 4-parameter logistic model. Inhibition constants Ki were derived from the Cheng-Prusoff equation, Ki = IC50 / (1+ [L]/Kd), where the ratio [L]/Kd is approximately 1.
- Enzyme Inhibition Assay and Ki Values Determination To determine the Ki values of active compounds, 25 nM Mpro was mixed with increasing concentrations of compounds (from 4 nM to 4,000 nM with twofold dilutions) and hydrolysis of 15 µM fluorescent peptide was monitored. Initial hydrolysis rates of fluorescent peptide were plotted as a function of compound concentrations and Ki values were obtained by fitting the data into the Morrison equation (42) with SE from triplicates. The Michealis Menten constant of enzyme (Km) value used for Ki calculations is 17 µM.
- ChEBML_209970 Ability to inhibit the thymidylate synthase from murine leukemia L1210 cells was determined and expressed as inhibition constant(Ki)
- ChEBML_90989 Compound was tested for inhibition of IL-1 beta converting enzyme (ICE) in human blood monocytes expressed as Ki
- ChEMBL_1335247 (CHEMBL3238600) Inhibition of HDAC2 in human HeLa cells using KI-104 as substrate after 40 mins by fluorescence analysis
- ChEMBL_138503 (CHEMBL749876) Receptor binding affinity (Ki) for Muscarinic acetylcholine receptor (heart)was determined by competition radioligand -[3H]- QNB binding assay
- ChEMBL_145429 (CHEMBL748774) The opioid receptor affinity(Ki) was evaluated by competition with [3H]DAMGO (mu) on guinea pig brain membranes
- ChEMBL_145566 (CHEMBL749570) Ki value determined against Opioid receptor kappa 1 using [3H]U69, 593 at the Kd concentration 0.95 nM
- ChEMBL_153000 (CHEMBL759483) Inhibition constant(Ki) for inhibition of PPIase activity of Escherichia coli parvulin (Conc=4 nM) of Parvulins sfamily
- ChEMBL_1828851 (CHEMBL4328725) Displacement of (6-FAM)KI(pY)VV from PKMYT1 kinase domain (unknown origin) by fluorescence polarization binding assay
- ChEMBL_1828853 (CHEMBL4328727) Displacement of (6-FAM)KI(pY)VV from full length PKMYT1 (unknown origin) by fluorescence polarization immuno assay
- ChEMBL_201571 (CHEMBL872706) Ki value determined against Sigma opioid receptor type 1 using [(+)-[3H]pentazocine at the Kd concentration 2 nM.
- ChEMBL_202761 (CHEMBL807846) Evaluated for the mixed objective Non-competitive inhibition constant Ki against TdR varied rat cytoplasmic soluble thymidine kinase
- ChEMBL_35353 (CHEMBL647935) Non-competitive inhibition of aminopeptidase B or arginyl aminopeptidase purified from rat liver; Ki value reporting the Kid
- GCase Ki Assay To determine inhibition constant (Ki), substrate (7.5µL, various concentrations in Mcllvaine buffer, pH 5.2) and enzyme (12.5µL, 0.1mg/mL) with or without inhibitor (final volume 50µL) were incubated at 37°C for 10 min.
- ChEBML_1800 Binding affinity (Ki) to rat cortical membranes at 5-HT1B binding site by using [125 I] ICYP as a radioligand.
- ChEBML_29531 Reversible binding Ki was measured by the inhibition of the carbon-carbon bond cleavage activity against rat ATP-Citrate Lyase
- ChEBML_35354 Non-competitive inhibition of aminopeptidase B or arginyl aminopeptidase purified from rat liver; Ki value reporting the intercept effect(Kii)
- ChEMBL_138501 (CHEMBL878557) Receptor binding affinity (Ki) for Muscarinic acetylcholine receptor (parotid glands) was determined by competition radioligand -[3H]- QNB binding assay
- ChEMBL_138502 (CHEMBL749875) Receptor binding affinity (Ki) against Muscarinic acetylcholine receptor (cerebral cortex) was determined by competition radioligand -[3H]- QNB binding assay
- ChEMBL_138504 (CHEMBL748410) Receptor binding affinity (Ki) for Muscarinic acetylcholine receptor (urinary bladder) was determined by competition radioligand -[3H]- QNB binding assay
- ChEMBL_141299 (CHEMBL748914) The Compound was tested for the inhibition potency against Candida albicans N-myristoyltransferase (NMT) and reported as apparent Ki
- ChEMBL_145075 (CHEMBL754635) The opioid receptor affinity(Ki) was evaluated by competition with [3H]DSLET (delta 2) on guinea pig brain membranes
- ChEMBL_147294 (CHEMBL756033) The opioid receptor affinity(Ki) was evaluated by competition with [3H]-DPDPE (delta 1) on guinea pig brain membranes
- ChEMBL_197350 (CHEMBL800529) Inhibitory constant for S-adenosyl-homocysteine hydrolase, was determined using Kitz and Wilson equation {Kobs = Kinact. [I]/(Ki + [I])}.
- ChEMBL_209970 (CHEMBL820626) Ability to inhibit the thymidylate synthase from murine leukemia L1210 cells was determined and expressed as inhibition constant(Ki)
- ChEMBL_2320564 Binding affinity to N terminal hexa histidine tagged DENV2 NS2B-NS3 protease assessed as apparent Ki by Dixon plot analysis
- ChEMBL_62089 (CHEMBL670518) Affinity at dopamine D2 receptor from rat striatum using [3H]spiroperidol as radioligand (For haloperidol Ki(nM)= 1.5+/-1.2)
- ChEMBL_827842 (CHEMBL2051251) Inhibition of HDAC1 in human HeLa cell lysate using KI-104 as substrate after 40 mins by fluorescence analysis
- ChEMBL_827843 (CHEMBL2051252) Inhibition of HDAC2 in human HeLa cell lysate using KI-104 as substrate after 40 mins by fluorescence analysis
- Pharmacological Activity Ki determinations were generously provided by the National Institute of Mental Health's Psychoactive Drug Screening Program (PDSP).
- Protease Inhibition Assay The inhibition constant, Ki was determined by monitoring the competitive inhibition of the hydrolysis of the chromogenic substrate.
- Radioligand Binding Assay The Ki values were calculated based on an experimentally determined appropriate Kd value according to Cheng and Prusoff.
- ChEBML_217699 The apparent association constant (Ki) with dTMP synthetase enzyme from chick embryo in the absence of CH2-H4 folate was evaluated
- ChEBML_50739 KI value was determined from plots of 1/kinact(observed) vs 1/[inhibitor]; Apparent values at pH 5.0, 0.24 mM O2
- ChEBML_50810 Compound was tested for its inhibitory activity against HeLa DNA polymerase alpha, Ki values were obtained in the absence of dGTP
- ChEMBL_138405 (CHEMBL744767) Binding affinity (Ki) against binding of [3H]NMS using membranes from CHO cells expressing cloned human Muscarinic acetylcholine receptor M1
- ChEMBL_138703 (CHEMBL747818) Binding affinity (Ki) against binding of [3H]NMS using membranes from CHO cells expressing cloned human Muscarinic acetylcholine receptor M3
- ChEMBL_139122 (CHEMBL749860) Binding affinity (Ki) against binding of [3H]NMS using membranes from CHO cells expressing cloned human Muscarinic acetylcholine receptor M4
- ChEMBL_139392 (CHEMBL747005) Binding affinity (Ki) against binding of [3H]NMS using membranes from CHO cells expressing cloned human Muscarinic acetylcholine receptor M5
- ChEMBL_139755 (CHEMBL745196) Binding affinity (Ki) against binding of [3H]NMS to membranes from CHO cells expressing cloned human Muscarinic acetylcholine receptor M2
- ChEMBL_146800 (CHEMBL756055) The opioid receptor affinity(Ki) was evaluated by competition with 9 (Opioid receptor kappa 1) on guinea pig brain membranes
- ChEMBL_1800 (CHEMBL616773) Binding affinity (Ki) to rat cortical membranes at 5-HT1B binding site by using [125 I] ICYP as a radioligand.
- ChEMBL_213565 (CHEMBL816122) Compound was evaluated for competitive inhibition against Vesicular glutamate transporter (VGLUT), and Ki value was reported,.using Cheng-Prushoff equation
- ChEMBL_29531 (CHEMBL643518) Reversible binding Ki was measured by the inhibition of the carbon-carbon bond cleavage activity against rat ATP-Citrate Lyase
- ChEMBL_320961 (CHEMBL885368) Binding affinity towards adenosine A1 receptor of rat cerebral cortex using [3H]DPCPX compared to SCH-58261 (Ki=390 nM)
- ChEMBL_35354 (CHEMBL647936) Non-competitive inhibition of aminopeptidase B or arginyl aminopeptidase purified from rat liver; Ki value reporting the intercept effect(Kii)
- ChEMBL_35355 (CHEMBL647937) Non-competitive inhibition of aminopeptidase B or arginyl aminopeptidase purified from rat liver; Ki value reporting the slope effect(Kis)
- ChEMBL_46814 (CHEMBL657058) The compound was tested for Ki value against rat whole brain P2 membrane preparation in absence of enzyme inhibitor PMSF
- ChEMBL_46816 (CHEMBL657060) The compound was tested for Ki value against rat whole brain P2 membrane preparation in presence of enzyme inhibitor PMSF.
- ChEMBL_62439 (CHEMBL858764) Competitive inhibition of [3H]spiperone binding to the human dopamine receptor D3 expressed in CHO cells, expressed as 10log Ki
- ChEMBL_63981 (CHEMBL677607) In vitro inhibition constant (Ki) against human leukocyte elastase (HLE-catalyzed hydrolysis of MeO-Suc-Ala-Ala-Pro-Ala-pNA)
- ChEMBL_66274 (CHEMBL678144) Inhibition constant(Ki) for inhibition of PPIase activity of human FK506 binding protein 12 (Conc=14 nM) of FKBPs family
- ChEMBL_66430 (CHEMBL682338) Inhibition constant(Ki) for inhibition of PPIase activity of rabbit FK506 binding protein 52 (Conc=52 nM) of FKBPs family
- ChEBML_58487 In vitro ability to displace Dopamine D2 receptor binding to rat striatal membranes in competition experiments against 3H-spiperone, expressed as Ki
- ChEMBL_1624 (CHEMBL616510) Affinity at 5-hydroxytryptamine 1D receptor from calf caudate using [3H]5-HT as radioligand (For sumatriptan = Ki(nM)-12+/-1.9)
- ChEMBL_201713 (CHEMBL803750) Ki value determined against Sigma opioid receptor type 2 using [3H]DTG(5 nM) with 1uM dextrallorphan to mask sigma1 binding
- ChEMBL_212952 (CHEMBL816766) The compound was tested for inhibition of uridine phosphorylase (UrdPase) from murine liver Value refers to activity for apparent Ki value
- ChEMBL_2206 (CHEMBL617031) Affinity at 5-hydroxytryptamine 2 receptor from rat frontal cortex using [3H]ketanserin as radioligand (For ketanserin = Ki(nM)=0.7+/-0.09)
- ChEMBL_3140 (CHEMBL617982) Affinity at 5-hydroxytryptamine 3 receptor from rat frontal cortex using [3H]granisetron as radioligand (For granisetron = Ki(nM)=0.3+/-0.01)
- ChEMBL_320973 (CHEMBL885380) Binding affinity towards adenosine A2a receptor of rat brain homogenates using [3H]ZM-241385 compared to SCH-58261 (Ki=37 nM)
- ChEMBL_3337 (CHEMBL619037) Binding affinity (Ki+/-SEM) against 5-hydroxytryptamine 4 receptor from cheng Prusoff equation by using [3H]GR-113808 in rat striatum
- ChEMBL_50810 (CHEMBL658011) Compound was tested for its inhibitory activity against HeLa DNA polymerase alpha, Ki values were obtained in the absence of dGTP
- ChEMBL_66427 (CHEMBL682335) Inhibition constant(Ki) for inhibition of PPIase activity of Photobacterium sp. FK506 binding protein 22 (Conc=41 nM) of FKBPs family
- ChEMBL_66428 (CHEMBL682336) Inhibition constant(Ki) for inhibition of PPIase activity of Legionella pneumophilia FK506 binding protein 25 (Conc=40 nM) of FKBPs family
- Protease Inhibition Assay Inhibition constants were determined by a fluorometric assay. Ki values were calculated from either Dixon plots or Henderson plots in cases where the Ki value was found to approach the concentration of the enzyme. Under these assay conditions, the cyclic compounds were confirmed to be competitive inhibitors.
- alpha-Adrenoceptor Radioligand Binding Assay The binding affinity of compound was evaluated using [3H] Clonidine as ligand in competition binding experiments. Nonspecific binding was determined as the concentration of ligand bound in the presence of 2 uM phentolamine. Ki values were determined by the equation: Ki = IC50/(1 + [clonidine]/KD).
- ChEBML_38612 Beta-2 adrenergic receptor binding affinity by measuring the displacement of [3H]DHA binding in rat lung; Not Active means Ki >1000 nM
- ChEMBL_149052 (CHEMBL761407) The inhibition constant (Ki(nM)) by displacement of [125I]- HO-LVA radiolabeled ligand using membranes of CHO cells of human Oxytocin receptor
- ChEMBL_152658 (CHEMBL761584) Kinetic constant Apparent binding constant (Ki`) for the inhibition of papain conducted in 0.1 M phosphate, pH 6.8, at 30 degree C
- ChEMBL_157799 (CHEMBL768936) Compound was evaluated for its ability to displace [3H]-PGE-2 from human Prostaglandin E receptor EP3 isolated from CHO-KI cells
- Competitive Radioligand Displacement Assay The Ki values were determined by the application of the Cheng-Prusoff equation: Ki = (IC50 x Kd)/(Kd+[L]) where [L] is the concentration of [3H]MIB (1 nM ) and Kd is the dissociation constant of the [3H]MIB determined in the saturation analysis (Kd=0.19 nM for MIB).
- Kinetic Competitive Displacement Assay The method was a competitive displacement assay used to determine binding affinities of other inhibitors relative to that of GW0385. The inhibitor of unknown affinity was used to displace [3H]GW0385 from enzyme-bound [3H]GW0385 (E[3H]GW0385). From the concentration of E[3H]GW0385 at equilibrium, the concentrations of enzyme-bound and free inhibitors were calculated, and the ratio of the Ki value of the unknown to that of GW0385 was determined (Ki,unknown/Ki,GW0385).
- ChEMBL_212902 (CHEMBL822095) Inhibition constant (Ki) when mixed with p-nitroanilide against trypsin enzyme for the conversion of water-soluble compound to fluorescent oil-soluble compound
- ChEMBL_214689 (CHEMBL817652) The inhibition constant (Ki(nM)) by displacement of [125I]- HO-LVA radiolabeled ligand using membranes of CHO cells of human Vasopressin V1b receptor
- ChEMBL_214856 (CHEMBL818334) The inhibition constant (Ki(nM)) by displacement of [125I]- HO-LVA radiolabeled ligand using membranes of CHO cells of human Vasopressin V2 receptor
- ChEMBL_34600 (CHEMBL645559) Alpha-1 adrenergic receptor binding affinity by measuring the displacement of [3H]-prazosin binding in rat brain; Not Active means Ki >1000 nM
- ChEMBL_35362 (CHEMBL647944) Effect of inhibitor structure on the slow binding inhibition of aminopeptidase M was determined and the Ki was reported which is = k2/k1
- ChEMBL_37544 (CHEMBL647626) Beta-1 adrenergic receptor binding affinity by measuring the displacement of [3H]dihydroalprenolol binding in rat heart; Not Active means Ki >1000 nM
- ChEMBL_71972 (CHEMBL684165) Inhibition of human Geranylgeranyl transferase type I incorporation of [3H]GGPP into biotinylated peptide corresponding to the C-terminus of human Ki-Ras.
- ChEMBL_98519 (CHEMBL706540) Effect of inhibitor structure on the slow binding inhibition of Leucine aminopeptidase was determined and the Ki was reported which is = k2/k1
- Ray2010 Assay 74 Table S2 shows raw Ki data for the current study combined with data collected from the literature for the ten additional compounds.
- Kinase Selectivity Assay Ser/Thr-kinase selectivity assays were performed using a radioactive FlashPlate-based assay platform. Substrate incorporated radioactivity was counted using a TopCount microplate reader (Perkin-Elmer). IC50 values were determined from six compound titration curves, and corresponding Ki values were calculated using the Cheng-Prusoff equation Ki = IC50/(1 + ([ATP]/Km)).
- Determination of the Inhibition Type and Constant (Ki) The Km and Kappm for the amino acid substrate were first calculated from Lineweaver-Burk plots. The Ki values were calculated from the Kappm vs [I] plot. The Ki values for the inhibitors with respect for the amino acid substrates were determined by measuring the apparent Km for the amino acid in the presence of saturating concentrations of both ATP and tRNA, and of various fixed concentrations of the inhibitor. Curve-fitting of these data using the theoretical functions for vi/v0 for various types of inhibition was made with the software Kaleidagraph (version 4.0) and was used to identify the types of inhibition and the Ki values.
- Enzyme Assay and Determination of the Inhibition Constants. Ki values were obtained from human purified enzyme. All assays were run in microtiter plates. Plates were read for 30 min at 405 nm. Rates were determined for the controls (no inhibitor) and for the inhibitors. Percent enzyme activity was determined from these rates and used in the following formula to determine Ki: Ki=(1000)(inhibitor concentration)/{[(Km + S) - (S)(ACT)]/[(ACT)(Km)] -1}, where S is the substrate concentration and ACT is the % enzyme activity for inhibitor.
- Enzyme Assay and Determination of the Inhibition Constants. Ki values were obtained from purified enzyme. All assays were run in microtiter plates. Plates were read for 30 min at 405 nm. Rates were determined for the controls (no inhibitor) and for the inhibitors. Percent enzyme activity was determined from these rates and used in the following formula to determine Ki: Ki=(1000)(inhibitor concentration)/{[(Km + S) - (S)(ACT)]/[(ACT)(Km)] -1}, where S is the substrate concentration and ACT is the % enzyme activity for inhibitor.
- ChEBML_68138 Tested by protection experiments to demonstrate the inactivation of estradiol dehydrogenase and the kinetic parameter Ki app was reported at a concentration of 20 uM
- ChEMBL_154348 (CHEMBL759110) Inhibition constant(Ki) for inhibition of PPIase activity of human Peptidyl-prolyl cis-trans isomerase NIMA-interacting 1 (Conc=4 nM) of Parvulins family
- ChEMBL_2184820 (CHEMBL5096902) Inhibition of recombinant human HDAC1 expressed in baculovirus expression system using KI-104 as substrate incubated for 3 hrs by by fluorescence-based assay
- ChEMBL_2184821 (CHEMBL5096903) Inhibition of recombinant human HDAC2 expressed in baculovirus expression system using KI-104 as substrate incubated for 3 hrs by by fluorescence-based assay
- ChEMBL_2184822 (CHEMBL5096904) Inhibition of recombinant human HDAC3 expressed in baculovirus expression system using KI-104 as substrate incubated for 3 hrs by by fluorescence-based assay
- ChEMBL_2184823 (CHEMBL5096905) Inhibition of recombinant human HDAC4 expressed in baculovirus expression system using KI-104 as substrate incubated for 3 hrs by by fluorescence-based assay
- ChEMBL_2184824 (CHEMBL5096906) Inhibition of recombinant human HDAC6 expressed in baculovirus expression system using KI-104 as substrate incubated for 3 hrs by by fluorescence-based assay
- ChEMBL_2184825 (CHEMBL5096907) Inhibition of recombinant human HDAC7 expressed in baculovirus expression system using KI-104 as substrate incubated for 3 hrs by by fluorescence-based assay
- ChEMBL_2184826 (CHEMBL5096908) Inhibition of recombinant human HDAC9 expressed in baculovirus expression system using KI-104 as substrate incubated for 3 hrs by by fluorescence-based assay
- ChEMBL_2517384 Inhibition of human FAAH assessed as kinact/Ki ratio incubated for 1 min in presence of glutamate dehydrogenase by 384-well format microplate reader assay
- ChEMBL_2517385 Inhibition of human FAAH assessed as kinact/Ki ratio incubated for 15 min in presence of glutamate dehydrogenase by 384-well format microplate reader assay
- ChEMBL_2517386 Inhibition of human FAAH assessed as kinact/Ki ratio incubated for 30 min in presence of glutamate dehydrogenase by 384-well format microplate reader assay
- ChEMBL_2517387 Inhibition of human FAAH assessed as kinact/Ki ratio incubated for 60 min in presence of glutamate dehydrogenase by 384-well format microplate reader assay
- ChEMBL_2517388 Inhibition of rat FAAH assessed as kinact/Ki ratio incubated for 1 min in presence of glutamate dehydrogenase by 384-well format microplate reader assay
- ChEMBL_2517389 Inhibition of rat FAAH assessed as kinact/Ki ratio incubated for 15 min in presence of glutamate dehydrogenase by 384-well format microplate reader assay
- ChEMBL_2517390 Inhibition of rat FAAH assessed as kinact/Ki ratio incubated for 30 min in presence of glutamate dehydrogenase by 384-well format microplate reader assay
- ChEMBL_2517391 Inhibition of rat FAAH assessed as kinact/Ki ratio incubated for 60 min in presence of glutamate dehydrogenase by 384-well format microplate reader assay
- ChEMBL_34379 (CHEMBL648471) Alpha-2 adrenergic receptor binding affinity by measuring the displacement of [3H]clonidine binding in rat cerebral cortex; Not Active means Ki >1000 nM
- ChEMBL_766013 (CHEMBL1828142) Inhibition of HDAC1 using KI-177 as substrate incubated 30 mins before substrate addition measured after 30 mins post substrate addition by fluorescence assay
- Determination of Inhibitor Potency and Selectivity Ki values for compounds were calculated by incubation of each enzyme with its substrate and various compound concentrations. Absorbance was read at 405 nM following preincubation (background, time zero measurement) and following the 30 min incubation with substrate using a microplate reader. Background values were subtracted from the final absorbance values. Percentage inhibition was calculated and plotted against compound concentration to generate IC50 values. The enzymatic Ki was calculated from the known Km of each substrate, using the equation: Ki = IC50 / ((1 + ([S]/Km)).
- Enzyme Inhibition Assay The production of NADPH from NADP+ and benzyl alcohol and xylitol was monitored by an increase in NADPH fluorescence (ex: 340 nm; em: 460 nm) using an SLM-Aminco 4800C fluorometer. For each inhibitor, at least three different inhibitor concentrations that bracketed Ki from 0.5- to 4-fold were used to determine Ki. For any one inhibitor concentration, the initial velocities were measured in duplicated or triplicate for at least five different substrate concentrations bracketing the apparent Km. Ki was determined by initial velocities to a competitive form of Michaelis-Menton equation.
- NOS Enzyme Inhibition Assay Nitric oxide formation from NOS was monitored by the hemoglobin capture assay. The assay was initiated by addition of enzyme and was monitored at 401 nm on a Perkin-Elmer Lambda 10 UV-vis spectrophotometer. The apparent Ki values were obtained by measuring percent inhibition in the presence of 10 uM L-arginine with at least four different concentrations of inhibitor. The IC50 values were determined by linear regression analysis of the percent inhibition data. Inhibition constants Ki were derived from the equation, Ki = IC50 / (1+ [S]/Km).
- NOS Enzyme Inhibition Assay Nitric oxide formation from NOS was monitored by the hemoglobin capture assay. The assay was initiated by addition of enzyme and was monitored at 401 nm on a Perkin-Elmer Lambda 10 UV-vis spectrophotometer. The apparent Ki values were obtained by measuring percent inhibition in the presence of 10 uM L-arginine with at least four different concentrations of inhibitor. The IC50 values were determined by linear regression analysis of the percent inhibition data. Inhibition constants Ki were derived from the equation, Ki = IC50 / (1+ [S]/Km).
- ChEMBL_68137 (CHEMBL680713) Tested for time-dependent inactivation of the enzyme that followed pseudo- first- order kinetics in the absence of NAD+ and the Ki values were reported
- Protease Inhibition Assay The Ki values were obtained from the IC50 values estimated from an inhibitor dose-response curve with the spectroscopic assay and the chromogenic substrate.
- Radioligand Binding Assay The inhibition constant (Ki) is determined using a radioligand binding assay (described in Bergman et. al. Bioorg. Med. Chem. Lett. 2008, 18, 1425-1430).
- Biological Assay For exemplary compounds of the disclosure, Ki for inhibition of MALT1 was measured (Table E11). A concentration of 100 nM MALT1 was used for the assay.
- ChEMBL_2454383 Agonist activity at STING in human THP1-Dual KI-hSTING-R232 cells assessed as IRF activation incubated for 24 hrs by QUANTI-Luc reagent based luminescence assay
- ChEMBL_32407 (CHEMBL872271) In vitro ability to displace Alpha-1 adrenergic receptor binding to rat cerebral cortex in competition experiments against [3H]prazosin at 15mg/kg, expressed as Ki.
- ChEMBL_35360 (CHEMBL647942) Effect of inhibitor structure on the slow binding inhibition of Aminopeptidase M from porcine kidney was determined and the Ki was reported which is = k2/k1
- ChEMBL_62095 (CHEMBL674975) Binding affinity (Ki) at Dopamine receptor D2 using rat caudate cells with nemonapride (0.075 nM) as a radioligand and 10 M haloperidol as a blank agent
- ChEMBL_71952 (CHEMBL685883) Inhibition of rate of incorporation of [3H]GGPP into a biotinylated peptide corresponding to C-terminus of human Ki-Ras by human geranylgeranyl-transferase type I.
- [32P] S1P Binding Assay Ki Values were determined by competition of [32P]-S1P binding to stably transfected CHO (S1P1,2,4) or RH7777 (S1P3,5) cells expressing the indicated S1P receptors.
- Competitive Radioligand Displacement Assay The Ki values were determined by the application of the Cheng-Prusoff equation: Ki = (IC50 x Kd)/(Kd+[L]) where [L] is the concentration of [3H]MIB (1 nM ) and Kd is the dissociation constant of the [3H]MIB determined in the saturation analysis, IC50 is determined by computer fitting data for the competitive binding of each AR ligand.
- Competitive Radioligand Displacement Assay The Ki values were determined by the application of the Cheng-Prusoff equation: Ki = (IC50 x Kd)/(Kd+[L]) where [L] is the concentration of [3H]MIB (1 nM ) and Kd is the dissociation constant of the [3H]MIB determined in the saturation analysis, IC50 is determined by computer fitting data for the competitive binding of each AR ligand.
- MAO A Activity Measurement MAO A activities were determined spectrophotometrically at 316 nm using kynuramine as substrate. Competitive Ki values were determined by measuring initial rates of substrate oxidation in the presence of varying concentrations of inhibitor. Apparent Km values for each inhibitor concentration (slopes of double reciprocal plots) were plotted as a function of inhibitor concentration, and the Ki values were determined.
- MAO B Activity Measurement MAO B activities were determined spectrophotometrically at 250 nm using benzylamine as substrate. Competitive Ki values were determined by measuring initial rates of substrate oxidation in the presence of varying concentrations of inhibitor. Apparent Km values for each inhibitor concentration (slopes of double reciprocal plots) were plotted as a function of inhibitor concentration, and the Ki values were determined.
- MAO Inhibition Assay MAO A and MAO B activities were determined spectrophotometrically. Competitive Ki values for both enzymes were determined by measuring initial rates of substrate oxidation in the presence of varying concentrations of inhibitor. Apparent Km values for each inhibitor concentration (slopes of double reciprocal plots) were plotted as a function of inhibitor concentration, and the Ki values were determined.
- ChEBML_37545 Compound was evaluated for its Beta-1 adrenergic receptor binding affinity by measuring the displacement of [3H]dihydroalprenolol binding in rat heart; Not Active means Ki >1000 nM
- ChEMBL_32408 (CHEMBL648043) In vitro ability to displace Alpha-1 adrenergic receptor binding to rat cerebral cortex in competition experiments against [3H]-prazosin at 1 mg/kg, expressed as Ki.
- ChEMBL_48344 (CHEMBL663333) Eq. constant (Ki) for inhibition of Cathepsin K was determined by progress curves, following hydrolysis of Z-Phe-Arg- Amc in the absence and presence of compound
- In Vitro Assay All of the compounds of Examples 1 to 16 and Tables 1 to 19 were tested in one or more of the assays described above. In the following tables, for the JAK1, JAK 2, JAK3, and TYK2 enzyme assays, A represents a pKi value≥10 (Ki≤0.1 nM), B represents a pKi value between 9 and 10 (Ki between 1 nM and 0.1 nM), C represents a pKi value between 9 and 9.5 (Ki between 1 nM and 0.32 nM), and D represents a pKi value between 8.5 and 9 (Ki between 32 nM and 1 nM). For the BEAS-2B cell potency assay, A represents a pIC50 value≥8 (IC50≤10 nM) and B represents a pIC50 value between 7.4 and 8 (IC50 between 40 nM and 10 nM).
- TACE Inhibition Assay Enzyme activity was determined by a kinetic assay measuring the rate of increase in fluorescent intensity generated by the cleavage of an internally quenched peptide substrate. The reaction was started by the addition of the substrate. The fluorescent intensity (excitation at 320 nm, emission at 405 nm) was measured every 45 s for 30 min using a fluorospectrometer (GEMINI XS, Molecular Devices). Values of Ki were calculated by the PRISM program based on one-site competitive inhibition mode. Each Ki value was an average of three determinations, and the standard errors for all Ki determinations were less than 10%.
- ChEBML_157807 Compound was evaluated for its ability to displace [3H]PGE-2 from human Prostaglandin E receptor EP1 isolated from CHO-KI cells (% of control ligand, 17-phi-PGE2=80%)
- ChEMBL_1919956 (CHEMBL4422801) Inhibition of HDAC8 (unknown origin) expressed in Escherichia coli using BML-KI-178 as substrate preincubated up to 3 hrs and measured after 35 mins by fluorescence assay
- ChEMBL_2315344 Binding affinity to recombinant human HDAC6 using Ac-Leu-Gly-Lys(Ac)-AMC as substrate measured after 60 mins assessed as inhibition constant (ki,1) by fluorescence based assay
- ChEMBL_37545 (CHEMBL647627) Compound was evaluated for its Beta-1 adrenergic receptor binding affinity by measuring the displacement of [3H]dihydroalprenolol binding in rat heart; Not Active means Ki >1000 nM
- CB1 Radioligand Binding Assay (Ki) and GTP-gamma-[35S] Binding Assay (EC50) IC50 values for test compounds were determined from nonlinear regression analysis of data collected from ligand binding experiments. The inhibition constant (Ki) was calculated from IC50 value by the Cheng and Prusoff equation. EC50 values were obtained from GTP-gamma-[35S] binding assay using CHO-K1 cells stably transfected with the human CB1 receptor cDNA.
- CDK Inhibition Assay In vitro kinase assay using purified enzyme, was incubated at 30 °C with substrate, and test compounds in the presence of 100 uM ATP/ [gamma-32P] ATP. 32P incorporation was measured with a Top Count (Packard). IC50 values were calculated from dose-response curves; from these calculated apparent inhibition constants (Ki) were obtained using the Cheng-Prusoff equation: Ki = IC50/ (1 + ([ATP]/Km)).
- DPPIV Inhibition Assay The progress of DPPIV inhibition by compounds was measured by recording the liberation of free pNA at 405 nm. IC50 was determined from the slope of regression lines of modified Dixon plots of uninhibited velocity/inhibited velocity versus inhibitor concentration. Ki was calculated using substrate concentration [S], substrate Km, and IC50 with Ki = IC50 x (1/(1 + [S]/Km)). Compounds were assayed in duplicate.
- In Vitro DPP-IV Inhibition Assays Inhibition of human DPP-IV activity was measured under steady-state conditions by following the absorbance increase at 405 nm upon the substrate cleavage. Inhibitor potency was evaluated by fitting inhibition data to the binding isotherm, and IC50 for each compound was calculated. IC50 values were further converted to Ki values using the equation: Ki = IC50/[1 + (S/Km)].
- Kinase Inhibition Assay In vitro kinase assay using purified enzyme, was incubated at room temperature with substrate, and test compounds in the presence of 100 uM ATP/ [gamma-33P] ATP. 33P incorporation was measured with scintillation counter. IC50 values were calculated from dose-response curves; from these calculated apparent inhibition constants (Ki) were obtained using the Cheng-Prusoff equation: Ki = IC50/ (1 + ([ATP]/Km)).
- Radioligand Displacement Assay (CP55940) Further characterization of select compounds was performed using radioligand displacement of [3H]1 and equilibrium dissociation constant (Ki) values were determined. Selectivity of these compounds at CB1 versus CB2 was also determined by obtaining Ki values at either receptor using displacement of [3H]CP55940 in membranes of CHO-K1 cells over-expressing either receptor. Data reported are average values from 3-6 measurements.
- ChEMBL_157807 (CHEMBL768755) Compound was evaluated for its ability to displace [3H]PGE-2 from human Prostaglandin E receptor EP1 isolated from CHO-KI cells (% of control ligand, 17-phi-PGE2=80%)
- ChEMBL_2379857 Inhibition of STING in human THP1-Dual KI-hSTING-R232 cells assessed as cGAMP-induced IRF luciferase expression incubated for 2 hrs by QUANTI-Luc reagent based luciferase reporter assay
- ChEMBL_71953 (CHEMBL685884) In vitro inhibition against human Geranylgeranyl transferase type I catalyzed by incorporation of [3H]- GGPP (geranylgeranyl pyrophosphate) into biotinylated peptide corresponding to the c-terminus of human Ki-Ras
- Binding of PEG-Nalbuphine assays Specific binding is determined by subtraction of the cpm bound in the presence of 50-100× excess of cold ligand. Binding data assays were analyzed using GraphPad Prism 4.0 and IC50 is generated by non-linear regression from dose-response curves. Ki values were calculated using the Cheng Prusoff equation using the Kd values from saturation isotherms as follows: Ki=IC50/(1+[Ligand]/Kd).
- CDK Kinase Inhibition Assay In vitro kinase assay using purified enzyme, was incubated at 30 °C with substrate, and test compounds in the presence of 100 uM ATP/ [gamma-32P] ATP. 32P incorporation was measured with a Top Count (Packard). IC50 values were calculated from dose-response curves; from these calculated apparent inhibition constants (Ki) were obtained using the Cheng-Prusoff equation: Ki = IC50/ (1 + ([ATP]/Km)).
- Fluorescence Polarization (FP) Binding Assay Ki values were determined from a competition experiment in which serial dilutions of inhibitor were added to compete against a fixed concentration (1 or 10 nM) of the fluorescent ligand for binding to a fixed concentration of the protein. Ki value was determined by nonlinear regression fitting of the competition curve using a set of custom equations and an Excel curve fitting tool.
- Ki Determination A coupled spectrophotometric assay was used in which ADP generated by kinase was converted to ATP with the concomitant production of pyruvate from PEP. LDH reduces pyruvate to lactate with the oxidation of NADH. NADH depletion was monitored at 340 nm using a microplate reader. The IC50 was evaluated from the data as a function of inhibitor concentration. The Ki value was calculated according to the Cheng-Prusoff approximation.
- Radioligand Displacement Assay (SR141716) Further characterization of select compounds was performed using radioligand displacement of [3H]1 and equilibrium dissociation constant (Ki) values were determined. Selectivity of these compounds at CB1 versus CB2 was also determined by obtaining Ki values at either receptor using displacement of SR141716 ([3H]1 in membranes of CHO-K1 cells over-expressing either receptor. Data reported are average values from 3-6 measurements.
- Antimalarial Testing In Vitro (IC50) and Measurement of Inhibition Constant (Ki) The concentration of inhibitor that inhibited 50% of the parasite growth (IC50) was determined from the sigmoidal curve obtained by plotting the percentages of [3H]-hypoxanthine incorporation against drug concentrations. The activity of pfDHFR-TS was determined spectrophotometrically using a UV-Vis spectrophotometer. The Ki values of the inhibitors for the wild-type and mutant enzymes were determined by fitting to the equation IC50 = Ki(1 + ([S]/Km)), where IC50 is the concentration of inhibitor that inhibits 50% of the enzyme activity under the standard assay condition and Km is the Michaelis constant for the substrate H2folate.
- ChEMBL_1478287 (CHEMBL3428527) Positive allosteric modulation of human delta opioid receptor expressed in CHO cell membranes assessed as SNC80 Ki at 10 uM after 90 mins by [3H]-diprenorphine displacement assay (Rvb = 71 nM)
- ChEMBL_1478288 (CHEMBL3428528) Positive allosteric modulation of human delta opioid receptor expressed in CHO cell membranes assessed as TAN67 Ki at 10 uM after 90 mins by [3H]-diprenorphine displacement assay (Rvb = 10 nM)
- ChEMBL_1810456 (CHEMBL4309916) Positive allosteric modulation of 5-HT2C receptor (unknown origin) assessed as increase in 5-HT-induced displacement of [3H]mesulergine by measuring 5-HT Ki at 20 uM (Rvb = 159 nM)
- Protease Inhibition Assay The inhibition constants Ki were determined by monitoring the inhibition of hydrolysis of the chromogenic substrate using a Hewlett-Packard 8452A spectrophotometer equipped with a 7-cell sample handling system.
- Radioligand Binding Assay Compounds were characterized in an in vitro binding assay to determine their Ki or ability to antagonized binding of a peptide agonist to the human melanin concentration hormone receptor (MCHR1).
- ChEMBL_1478286 (CHEMBL3428526) Positive allosteric modulation of human delta opioid receptor expressed in CHO cell membranes assessed as leu-enkephalin Ki at 10 uM after 90 mins by [3H]-diprenorphine displacement assay (Rvb = 221 nM)
- Inhibition Assay The inhibition tests and the evaluation of the inhibition constants (Ki) on the various MMPs were carried out as described by Devel et al. (Devel et al. 2006 J. Biol. Chem. (7)).
- Inhibition Assay The rate of hydrolysis catalyzed by drosophila golgi alpha-mannosidase II (dGMII)and in the presence of different concentration of inhibitor was measured fluorometrically and Ki values were determined from Dixon plots.
- Determination of Inhibition Constants The measurements were carried out on a microplate reader. Two concentrations of the substrate and five concentrations of the inhibitor were used. After the addition of the enzyme to reaction mixtures containing chromogenic substrate and test compound, the optical density was monitored at 405 nm. The Ki-values were calculated according to Dixon using a linear regression program. The Ki-values reported are means from at least three determinations.
- Protease Inhibition Assay All proteases were assayed by monitoring the cleavage of peptide substrate with fluorescent reporter at room temperature with a microtiter plate spectrofluorometer. Three different concentrations of inhibitors were used for calculating Ki values. Kinetic data were measured with an excitation wavelength of 390nm and emission wavelength of 460nm. From the initial velocities of the reactions Ki values were calculated by nonlinear regression method using the program EZ-fit (Perella Scientific).
- Protease Inhibition Assay The inhibition assays were performed in microtiter plate wells by mixing enzyme and fluorescent peptide substrate in the presence of inhibitor compounds. The increase of fluorescence was detected using fluorimeter-luminometer. Ki values were calculated from the IC50 values estimated from a dose-response curve with the fluorescent assay using the equation Ki = (IC50 - [E]/2)/ (1 +[S]/Km), where [E] and [S] are the protease and substrate concentrations.
- In Vitro Assay Inhibition of LIMK1 and LIMK2. Inhibition of LIMK1 and LIMK2 was measured with Lanthascreen Eu binding assay (Life Technologies). This TR-FRET assay is based on the competition between a fluorescent tracer and the inhibitor to be tested, allowing the determination of an inhibition constant, Ki. 133 compounds have been tested. A dozen of these compounds have their Ki below 10 nM, and about fifty below 50 nM. These results are very promising, as Ki values of the reference compounds LIMKi3 and LX7101 are 8 and 3.9 nM, respectively, and the Pyr1 compound tested on breast cancer tumors has an IC50 of 50 nM on LIMK1 and 75 nM on LIMK2.
- In Vitro Enzyme Assay The proteolytic cleavage of N-acyl aminocoumarins by cathepsins was conducted in Dynatech Microfluor fluorescence 96-well microtiter plates, and readings were taken on a Molecular Devices Spectra Max Gemini XS instrument. The excitation wavelength was 355 nm and the emission wavelength was 450 nm for peptidyl-AMC substrates. Generation of AMC was monitored over 5 min. The dissociation constants (Ki) were determined from the IC50 values taken from plots of Vi/Vo versus inhibitor concentration, where Vo is the velocity in the absence of the inhibitor and Vi is the velocity with the inhibitor. The IC50 values were converted to Ki by the equation Ki = IC50 - Et/2, where Et is the enzyme concentration.
- Measurement of Inhibition Constants Inhibition constants (Ki) were calculated by determining the kcat and Km (DDCoA) values at several fixed inhibitor concentrations. The inhibition data were analyzed using the standard equation for uncompetitive inhibition. For compounds with Ki values in the low nanomolar range, initial velocities were determined at a fixed substrate concentration and the data were fit to the equation: vi/v0 = (Km + S)/(Km + S[1 + I/ Ki]). Where vi and v0 are the initial velocities in the presence and absence of inhibitor. The substrate concentration was fixed at 15 uM, and the inhibitor concentration was varied from 3.5 to 1200 nM. Data fitting was performed using Grafit 4.0 (Erithacus Software Ltd.).
- ChEMBL_48121 (CHEMBL661440) Compound was tested in vitro for its ability to displace [125I]Bolton-Hunter CCK-8 from membrane preparation isolated from CHO-KI cells stably transfected with cDNA of human Cholecystokinin type B receptor
- ChEMBL_49893 (CHEMBL661735) Compound was tested in vitro for its ability to displace [125I]Bolton-Hunter CCK-8 from membrane preparation isolated from CHO-KI cells stably transfected with cDNA of human Cholecystokinin type A receptor
- ChEMBL_863131 (CHEMBL2175629) Non competitive inhibition of histidine tagged recombinant PRMT1 expressed in Escherichia coli BL21 (DE3) cells assessed as Ki slope using SAM preincubated for 5 mins measured after 8 mins by liquid scintillation counting
- Enzyme Inhibition Assay Spectrophotometric assays were performed by monitoring hydrolysis of chromogenic substrate. The release of para-nitroaniline at 405 nm was measured to determine initial velocities. Ki values were determined using a Dixon plot.
- Enzyme Inhibition Assay The enzyme inhibitory activity (Ki) was determined according to an assay protocol reported by Toth and Marshall (Toth, M. V.; Marshall, G. R. Int. J. Pep. Protein Res. 1990, 36, 544-550).
- TBDTR-FRET (Time-Resolved Fluorescence-Resonance-Energy-Transfer) Assay The inhibition constant (Ki) for binding of representative compounds to Bcl-2 protein, as determined by a TR-FRET (Time-Resolved Fluorescence-Resonance-Energy-Transfer) assay.
- ChEMBL_1728272 (CHEMBL4143550) Inhibition of full length recombinant human HDAC2 expressed in baculovirus infected Sf9 insect cells using KI 177 as substrate preincubated for 5 mins followed by substrate addition measured after 30 mins by fluorescence assay
- ChEMBL_2273115 Irreversible inhibition of human recombinant tissue transglutaminase expressed in Escherichia coli using Cbz-Glu-(gamma-p-nitrophenylester)Gly (AL5) as substrate assessed as substrate hydrolysis by measuring KI incubated for 20 mins by colorimetric analysis
- ChEMBL_2273116 Reversible inhibition of human recombinant tissue transglutaminase expressed in Escherichia coli using Cbz-Glu-(gamma-p-nitrophenylester)Gly (AL5) as substrate assessed as substrate hydrolysis by measuring Ki incubated for 20 mins by colorimetric analysis
- Radioligand Binding Assay IC50 values for test compounds were determined from nonlinear regression analysis of data collected from ligand binding experiments. The inhibition constant (Ki) was calculated from IC50 value by the Cheng and Prusoff equation.
- Enzymatic Assay The enzymatic assay was carried out at room temperature in 96-well plates. The initial rate of PTPase-catalyzed hydrolysis of p-nitrophenol phosphate (pNPP) was measured by following the absorbance change at 405 nm. IC50 value was determined under fixed pNPP concentration of 1 mM. All the assays were carried out in duplicate or triplicate and the average results are presented. Ki is derived from IC50 based on competitive inhibition Ki = IC50 x Km/ (Km + [substrate]).
- MAO A and MAO B Activity Measurements MAO A and MAO B activities were determined spectrophotometrically at 316 nm and 250 nm using kynuramine and benzylamine as substrates, respectively. Competitive Ki values for both enzymes were determined by measuring initial rates of substrate oxidation in the presence of varying concentrations of inhibitor. Apparent Km values for each inhibitor concentration (slopes of double reciprocal plots) were plotted as a function of inhibitor concentration, and the Ki values were determined.
- Protease Inhibition Assay The inhibition assays were performed by mixing enzyme and fluorogenic substrate in the presence of inhibitor compounds. The hydrolysis of the substrate was recorded as an increase of the fluorescence intensity. Ki values were calculated from the IC50 values taken from a dose-response curve with the fluorescent assay using the equation Ki = (IC50 - [E]/2)/ (1 +[S]/Km), where [E] and [S] are the protease and substrate concentrations, Km is the Michaelis-Menten constant.
- CB Receptor Binding Assay IC50 values for test compounds were determined from nonlinear regression analysis of data collected from ligand binding experiments. The inhibition constant (Ki) was calculated from IC50 value by the Cheng and Prusoff equation.
- ChEMBL_1894670 (CHEMBL4396591) Mixed type inhibition of equine serum BChE assessed as Ki using butyrylthiocholine as substrate preincubated for 20 mins followed by substrate addition and measured upto 5 mins by Ellman's method based Lineweaver-Burk plot analysis
- Spectrophotometric Assay The Ki values were determined using a spectrophotometric assay at 25° C., 0.1 M Tris-HCl, 10 mM MgCl2, pH 7.4 (Keough, D. T.; Ng, A. L.; Winzor, D. J.; Emmerson, B. T.; de Jersey, J. Purification and characterization of Plasmodium falciparum hypoxanthine-guanine-xanthine phosphoribosyltransferase and comparison with the human enzyme. Mol. Biochem. Parasitol. 1999, 98, 29-41; Plasmodium vivaxhypoxanthine-guanine phosphoribosyltransferase: a target for anti-malarial chemotherapy. Kerough, D. T. Hockova. D, Krecmerova, M., Naesens, L., Brereton, I. M., de Jersey, J and Guddat, L, W, Mol. Biochem. Parasitol (2010) 173: 165-169). The Ki values are Ki(app) as they were measured at a single concentration of the second substrate. The concentration of the second substrate (guanine) was saturating: 60 μM.
- ChEMBL_2215800 (CHEMBL5128932) Inhibition of full length C-terminal FLAG-tagged HDAC2 (unknown origin) assessed as inhibition constant (Ki) using (Ac-Leu-Gly-Lys(Ac)-AMC as substrate measured every 30 sec for 60 mins by fluorescence based assay
- ChEMBL_2215801 (CHEMBL5128933) Inhibition of full length C-terminal His-tagged HDAC1 (unknown origin) assessed as inhibition constant (Ki) using (Ac-Leu-Gly-Lys(Ac)-AMC as substrate measured every 30 sec for 60 mins by fluorescence based assay
- ChEMBL_863132 (CHEMBL2175630) Competitive inhibition of histidine tagged recombinant PRMT1 expressed in Escherichia coli BL21 (DE3) cells assessed as Ki intercept using Histone H4(1-20) substrate preincubated for 5 mins measured after 8 mins by liquid scintillation counting
- Radioligand Labeled Binding Assay IC50 values for each test compound were determined from nonlinear regression analysis of data collected from ligand binding experiments. The inhibition constant (Ki) was calculated from IC50 value by the Cheng and Prusoff equation.
- Determination of Dissociation Constant (Kd) Values of Ki were determined from the dependence of the observed rate constant (kobs) on inhibitor concentration. With subsaturing APS, the inhibition constant is equal to the dissociation constant (Ki = Kd). A range of inhibitor concentrations was employed from at least 5-fold below to 10-fold above the inhibition constant. Nonlinear least-squares fits of the equation for competitive inhibition gave excellent fits in all cases, and the standard error was typically less than 15%.
- Enzyme Inhibition Measurements Enzyme activities were assayed by monitoring the hydrolysis of substrate in the presence or absence of inhibitor compounds. The hydrolysis was recorded as the increase in fluorescence intensity over a 10 min time period. IC50 values were obtained by assuming competitive inhibition and fitting the dose response data to the equation (Vi/V0) =1/ (1 + [I]/IC50)). The Ki was calculated by using Ki = IC50/ (1 + [S]/Km), and a Km value determined according to Michaelis-Menten.
- In-Vitro Binding Assay In-vitro binding assays performed at Eurofins Panlabs Taiwan, Ltd. Specific ligand binding was determined in the presence of an excess of unlabelled ligand. Inhibition constants (Ki) were calculated from in vitro binding assays using the Cheng Prusoff equation (Cheng and Prusoff 1973). Source: Johnston et al, 2019 (Johnston et al. 2019) and NC20-PHARM-2. Thus, both Compound 1 and Compound 4 have high affinity to the S1R and no affinity (Ki>100) to the S2R.
- Inhibition Assay The Ki values for the inhibition of [3H]epibatidine binding at the α4β2 nAChR in male rat cerebral cortex for compounds are listed in Table A. The binding assays were conducted and the Ki values calculated as described in Carroll, F. I. et al., "Synthesis, nicotinic acetylcholine receptor binding, and antinociceptive properties of 2-exo-2-(2',3'-disubstituted 5'-pyridinyl)-7- azabicyclo[2.2.1]heptanes: epibatidine analogues." J. Med. Chem. 2002, 45, 4755-4761.
- Radioligand Binding Assay (Ki) Competition experiments were performed in the presence radioligand with membrane protein and test compounds. After incubation, the reaction stopped by rapid filtration onto a 96-well GF/B filter. Radioactivity retained on the filters was measured by liquid scintillation counting (Beckman LS 6500 apparatus). IC50 values for test compounds were determined from nonlinear regression analysis of data collected from ligand binding experiments. The inhibition constant (Ki) was calculated from IC50 value by the Cheng and Prusoff equation.
- CO2 Hydration Assay The inhibition constants (Ki) of FEC to four human CA isoenzymes I, II, IX and XII were determined by CA catalyzed CO2 hydration assays following previously published procedures [Carta et al., Bioorg. Med. Chem., 20:2266-73].
- ChEMBL_1728271 (CHEMBL4143549) Inhibition of C-terminal FLAG/His-tagged full length recombinant human HDAC1 expressed in baculovirus infected Sf9 insect cells using KI 177 as substrate preincubated for 5 mins followed by substrate addition measured after 30 mins by fluorescence assay
- ChEMBL_2215803 (CHEMBL5128935) Inhibition of full length C-terminal FLAG-tagged HDAC2 (unknown origin) assessed as equilibrium inhibition constant (Ki,1) using (Ac-Leu-Gly-Lys(Ac)-AMC as substrate measured every 30 sec for 60 mins by fluorescence based assay
- ChEMBL_2215804 (CHEMBL5128936) Inhibition of full length C-terminal His-tagged HDAC1 (unknown origin) assessed as equilibrium inhibition constant (Ki,1) using (Ac-Leu-Gly-Lys(Ac)-AMC as substrate measured every 30 sec for 60 mins by fluorescence based assay
- Cholinesterase Inhibition Assay The cholinesterase assays were performed using colorimetric method reported by Ellman. Estimates of the competitive inhibition constants (Ki) were obtained from replots of the slopes of reciprocal plots of initial velocity and substrate concentrations vs inhibitor concentration.
- Fluorogenic Assay DPAP1 inhibtion was measured using DPAP1-specific fluorogenic assay. IC50 DPAP1 were determined after 30 min incubation of parasite lysates with 5 nM to 100 mM inhibitor. ki values were obtained by fitting the data to Equation 1.
- In Vitro BRAF Kinase Assay BRAF kinase activity was quantified using an ELISA-based MEK phosphorylation assay. IC50 values were derived from the sigmoidal dose-response curve fitting by GraphPad Prism 4.0. Ki was calculated from the Cheng-Prusoff equation.
- Inhibitory Assay Determination of the Ki values for inhibitors was performed by creation of both type 1 and type 2 Dixon plots. The format included 100 μL/10 mM in DMSO. For comparison, a non-inhibitory compound was also examined.
- Competitive Radioligand Displacement Assay and AR-Mediated Transcription Activation Assay The Ki values were determined by the application of the Cheng-Prusoff equation: Ki = (IC50 x Kd)/(Kd+[L]) where [L] is the concentration of [3H]MIB (1 nM ) and Kd is the dissociation constant of the [3H]MIB determined in the saturation analysis, IC50 is determined by computer fitting data for the competitive binding of each AR ligand. EC50 is the lowest concentration of the ligand capable of maximally stimulating AR-mediated transcription during transfection experiments.
- FP Assay The inhibitory constants (Ki) of the synthesized inhibitors were first determined using a fluorescence polarization (FP)-based competition assay with the previously developed probe II138 as previously reported (Iyamu et al., Anal. Biochem. 2020, 604). Surprisingly, the replacement of the aspartic acid with an acetyl group resulted in a potent bisubstrate inhibitor II399, which displayed a comparable Ki value of 77 nM as our lead compound LL320 (FIG. 2A), whereas II542 containing ethylamine resulted in about a 20-fold reduction in inhibition.
- PLK3 Kinase Inhibition Assay The mode of human PLK3 inhibition by LFM-A13 was examined in titration experiments using increasing concentrations of [gamma-32P]ATP and purified N-terminal His6-tagged recombinant human PLK3. The Ki of PLK3 by LFM-A13 was calculated from the reciprocal plots of the intensity of phosphorylation of the substrate versus the concentration of the inhibitor. From this Dixon plot, the Ki represents the dissociation constants of the EI complex, which is determined by the point of linear intersection.
- Receptor Binding Assay (Ki) and Transactivation Assay (EC50) Binding assays were conducted by incubating test compound at various concentrations with [3H]DHT with human cancer epithelial breast cell lines MDAMB-45. IC50 value was obtained from dose-response displacement curves. The inhibition constant (Ki) was calculated from IC50 value by the Cheng and Prusoff equation. EC50 value was obtained from functional transactivation assay, which was conducted to assess the potency and efficacy of agonist/antagonist in stably transfected mouse myoblast C2C12 cell line utilizing a luciferase reporter.
- Chk1 Ki determination For Ki determinations a matrix of inhibitor and substrate concentrations were tested. Inhibitor concentrations were tested from four times IC50 with 0.6-fold dilutions over 7 concentrations, as well as a final reaction with no inhibitor present. Substrate concentrations ranged from 0.5Km to 8Km. An estimate of the Vmax and Km of Chk1 was obtained in the absence of inhibitor, using the Michaelis-Menten steady state equation. For each inhibitor, an initial suggested competitive or non-competitive mode was inferred from analysis of double reciprocal Lineweaver-Burk plots. Then the experimental data were fitted alternatively to a competitive and a non-competitive equation using a 3D non-linear regression. To confirm which model fitted the data best, several statistical parameters were checked. Ki values were then obtained from the relevant model.
- Enzyme Assay JAK1 (KI): For the determination of Ki, different amounts of compound are mixed with the enzyme and the enzymatic reaction is followed as a function of ATP concentration. The Ki is determined by means of double reciprocal plotting of Km vs compound concentration (Lineweaver-Burk plot). 1 ng of JAK1 (Invitrogen, PV4774) is used in the assay. The substrate is 50 nM Ulight-JAK-1 (Tyr1023) Peptide (Perkin Elmer, TRF0121) The reaction is performed in 25 mM MOPS pH 6.8, 0.01%, 2 mM DTT, 5 mM MgCl2 Brij-35 with varying concentrations of ATP and compound. Phosphorylated substrate is measured using an Eu-labeled anti-phosphotyrosine antibody PT66 (Perkin Elmer, AD0068). Readout is performed on the envision (Perkin Elmer) with excitation at 320 nm and emission followed at 615 nm and 665 nm.
- Radioligand Binding Assay The radioligand binding assays were carried out at four different test concentrations and the test concentrations were 1 nM, 10 nM, 0.1 μM, and 1 μM.The assays were carried out in duplicates and the quantitative data are reported as IC50, Ki, and nH. Where presented, IC50 values were determined by a non-linear, least squares regression analysis using MathIQ (ID Business Solutions Ltd. UK). Where inhibition constants (Ki) are presented, the Ki values were calculated using the equation of Cheng and Prusoff (Cheng, Y., Prusoff, W. H., Biochem. Pharmacol. 1973, 22:3099-3108) using the observed IC50 of the tested compound, the concentration of radioligand employed in the assay and the historical values for the KD of the ligand (obtained experimentally at MDS Pharma Services).
- Binding Assay The affinities of selected Purine Derivatives for the adenosine A1 receptor were determined by measuring the displacement of specific [3H] 2-chloro-N6-cyclopentyl adenosine binding in CHO cells stably transfected with human recombinant A1 adenosine receptor expressed as Ki (nM).
- DNA Polymerase Activity Assay Reaction velocities were determined at each dGTP concentration and used to create double reciprocal plots of velocity versus dGTP concentration. The plots were used to assess the mechanism of inhibition and calculate the apparent Ki value for the inhibitor.
- Enzyme Inhibition Assay Accordingly Ki is for uninhibited AChE. The higher the number, the less the native enzyme is inhibited by the reactivator compound, which is what one desires to achieve: reactivation of the inhibited AChE but little inhibition of native enzyme activity.
- H3R Radioligand Binding Assay Ligand displacement assays were performed on The SK-N-MC/hH3R cell homogenates. Retained radioactivity was determined by liquid scintillation counting. The Ki values were calculated based on an experimentally determined appropriate Kd value according to Cheng and Prusoff.
- H4R Radioligand Binding Assay Ligand displacement assays were performed on The SK-N-MC/hH4R cell homogenates. Retained radioactivity was determined by liquid scintillation counting. The Ki values were calculated based on an experimentally determined appropriate Kd value according to Cheng and Prusoff.
- In Vitro Binding Assay In vitro binding assay performed at Eurofins Panlabs Taiwan, ltd. Specific ligand binding was determined in the presence of an excess of unlabelled ligand. Inhibition constants (Ki) were calculated from in vitro binding assays using the Cheng Prusoff equation.
- mu-Calpain Inhibition Assay Assays were initiated by addition of CaCl2, and the increase in fluorescence (ex @370 nm, em @440 nm) was monitored. MDL28170 and buffer with 2% DMSO were used as controls. Ki values were determined according to Dixon methods.
- Competition Binding Assay The inhibition constant (Ki) from a GPR6 competition binding assay and the IC50 values from a hERG functional assay for the compound of Formula 1 (Example 1) and for Compound A. As described above, Ki for each compound was obtained using a competition binding assay which employed a filtration-based format utilizing membranes prepared from CHO-K1 cells expressing human GPR6 cDNA; IC50 for each compound was obtained using a hERG functional assay which employed an automated whole cell patch-clamp system utilizing CHO-K1 cells transfected with human hERG cDNA.
- Determination of Inhibition Constants The measurements were carried out on a microplate reader. Two concentrations of the substrate and five concentrations of the inhibitor were used in the assay. Three minutes after the addition of the enzyme to the reaction solution containing substrate and test compound, acetic acid (50%) was added to quench the reaction, and the optical density was measured at 405 nm. The Ki-values were calculated according to Dixon using a linear regression program. The Ki-values reported are means from at least three determinations.
- Determination of kinetic parameters and the Ki of effective compounds using the FRET peptide Kinetic parameters were obtained using various concentrations of FRET peptide in the fluorescent assay. The maximal velocity (Vmax) and Michaelis Menten constant (Km) were calculated from the Eadie Hofstee plot. If the type of inhibitionwas found to be competitive using a Lineweaver Burk double reciprocal plot, then the inhibitory constant (Ki) for 3CLpro was estimated using the equation:Ki = IC50/(1+[substrate]/Km).Plots were performed, and kinetic parameters were calculated, using Prism software (Graphpad Software, San Diego, CA).
- Enzyme Assay and Determination of the Inhibition Constants. The enzyme reactions were initiated by the addition of substrate, and the color developed from the release of p-nitroanilide from each chromogenic substrate was monitored continuously for 5 min at 405 nm on a microtiter plate reader. The initial velocities measured were used to determine the amount of inhibitor required to diminish 50% of the control velocity; this concentration was defined as the IC50 of the inhibitor. The apparent Ki values were then calculated according to the Cheng-Prusoff equation: Ki = IC50/1 + [S]/Km.
- Enzyme Inhibition Assay (Ki) and Antiviral Activity Assay (EC50/IC50) The Ki values were determined by substrate cleavage assay using fluorogenic substrate, 2-(aminobenzoyl)-Thr-Ile-Nle-Phe(p-NO2)-Gln-Arg-NH2. A standard curve relating changes in fluorescent intensity to changes in concentration of product was used to convert fluorescent changes into molar velocities. The amount of cleavage was determined by HPLC. IC50 values were determined by using the MTT assay. The IC50 values of saquinavir (SQV) and amprenavir (APV) tested as reference agents were 16 and 27 nM
- Enzyme Inhibition Assay Inhibition constants were calculated by assessment of the reduction in the formation of o-nitrophenol, as monitored by a spectrophotometric assay at 420 nm. The data was recorded at 15 s intervals for 5 min. All reactions were performed in duplicate, and at least 8 concentrations of inhibitor were used to determine Ki. Examination of curve fits to identify the best model for enzyme inhibition. Ki values were calculated from sigmoid curve fits using GraphPad Prism to be the best fit for the experimental data.
- Enzyme Inhibition Assay The enzyme reactions were initiated by the addition of substrate, and the color developed from the release of p-nitroanilide from each chromogenic substrate was monitored at 405 nm using a Thermomax kinetic plate reader (Molecular Devices). The initial velocities measured were used to determine the amount of inhibitor required to diminish 50% of the control velocity; this concentration was defined as the IC50 of the inhibitor. The apparent Ki values were then calculated according to the Cheng-Prusoff equation: Ki = IC50/1 + [S]/Km.
- Serine Protease Inhibition Assay The enzyme reactions were initiated by the addition of substrate, and the color developed from the release of p-nitroanilide from each chromogenic substrate was monitored continuously for 5 min at 405 nm on a microtiter plate reader. The initial velocities measured were used to determine the amount of inhibitor required to diminish 50% of the control velocity; this concentration was defined as the IC50 of the inhibitor. The apparent Ki values were then calculated according to the Cheng-Prusoff equation: Ki = IC50/1 + [S]/Km.
- ChEMBL_1728273 (CHEMBL4143551) Inhibition of C-terminal His-tagged/N-terminal GST-tagged full length recombinant human HDAC3/NcoR2 expressed in baculovirus infected Sf9 insect cells using KI 177 as substrate preincubated for 5 mins followed by substrate addition measured after 30 mins by fluorescence assay
- ChEMBL_2215799 (CHEMBL5128931) Inhibition of full length C-terminal His-tagged HDAC3 (unknown origin)/N-terminal GST-tagged NCoR2 (unknown origin) assessed as inhibition constant (Ki) using (Ac-Leu-Gly-Lys(Ac)-AMC as substrate measured every 30 sec for 60 mins by fluorescence based assay
- Determination of the Inhibition Constant KI The oxidation of NADPH was monitored at 340 nm using a Molecular Devices SpectraMax Plus 96-well microtiter plate reading spectrophotometer. Plots were generated using SigmaPlot version 8.0 software and fit to the Michaelis-Menten equation for competitive inhibition.
- ChEMBL_2215802 (CHEMBL5128934) Inhibition of full length C-terminal His-tagged HDAC3 (unknown origin)/N-terminal GST-tagged NCoR2 (unknown origin) assessed as equilibrium inhibition constant (Ki,1) using (Ac-Leu-Gly-Lys(Ac)-AMC as substrate measured every 30 sec for 60 mins by fluorescence based assay
- Estrogen Receptor Binding Assay. The binding affinities were determined by a competitive radiometric binding assay using [3H]estradiol as tracer. The Kd for 3H-estradiol was determined by saturation binding to ER receptors. The IC50 values for compounds were converted to Ki using Cheng-Prusoff equation.
- Fluoresence-based Assay The initial screen was performed in a 96-well plate using the fluoresence-based assay previously described. An enzyme-coupled absorbance-based assay developed in house was used to determine the inhibitor-enzyme kinetic parameters of Mtb-AnPRT, including ki values for the inhibitors.
- Human A1 Adenosine Receptor Binding Assay The membranes prepared from CHO cells transfected with human adenosine A1 receptors were used in binding assays. Nonspecific binding was determined in the presence of 50 uM RPIA. Ki values were calculated from IC50 values using the Cheng-Prusoff equation.
- In-Vitro Binding Assay In-vitro binding assays performed at Eurofins Panlabs Taiwan, Ltd. Specific ligand binding was determined in the presence of an excess of unlabelled ligand. Inhibition constants (Ki) were calculated from in vitro binding assays using the Cheng Prusoff equation (Cheng and Prusoff 1973).
- Receptor Binding and Transactivation Assay Receptor Binding Assay (Ki)-Binding determined through direct displacement of ligand with [3H]-DHT in the MDA-453 cell line. Transactivation Assay (EC50, IC50) - Functional agonist/antagonist activities determined through a stably transfected mouse myoblast C2C12 cell line utilizing a luciferase reporter.
- Fluorescence Polarization Competitive Binding Assay A quantitative in vitro binding assay using the fluorescence polarization (FP) based method was developed and used to determine the binding affinity of Smac mimetics to XIAP protein. The polarization values were measured after 3 hrs of incubation when the binding reached equilibrium. IC50 values, the inhibitor concentration at which 50% of bound peptide is displaced, were determined from a plot using nonlinear least-squares analysis. Curve fitting was performed using Prism (GRAPHPAD). The binding affinity (Ki) of tested compound was calculated using the equation developed for computing the Ki value in FP-based binding assays.
- Fluorometric Assay The effectiveness of compounds against the activity of human recombinant caspase-1-8 was measured using fluorometric assays. Assays were carried out in a 96-well flat bottom, polystyrene plates. Caspase activity was monitored using a Microplate Spectrofluorometer Gemini XS with an excitation wavelength of 365 nm and an emission wavelength of 495 nm. Kinetic data were collected over a 15 min assay run at room temperature. IC50 values were calculated through a four parameter fit curve using the computer application SOFTmax PRO. Ki(apparent) values were calculated using the following equation: Ki(app) = IC50/(1 + [substrate]/Km).
- Fluorometric Assay The effectiveness of compounds against the activity of human recombinant caspase-1-8 was measured using fluorometric assays. Assays were carried out in a 96-well flat bottom, polystyrene plates. Caspase activity was monitored using a Microplate Spectrofluorometer Gemini XS with an excitation wavelength of 365 nm and an emission wavelength of 495 nm. Kinetic data were collected over a 15 min assay run at room temperature. IC50 values were calculated through a four parameter fit curve using the computer application SOFTmax PRO. Ki(apparent) values were calculated using the following equation: Ki(app) = IC50/(1 + [substrate]/Km).
- Ki Estimation Ligand binding was measured by fluorescence polarization of a fluorescein isothiocyanate (FITC) labeled probe (as described by Bollini, et al 2002) in conjunction with recombinant full-length FKBP12 and FKBP52. Binding saturation experiments were performed to determine the probe Kd for FKBP12 or FKBP52 using GraphPad software. Ligand displacement from FKBP12 or FKBP52 was measured by fluorescence polarization in the presence of various compound concentrations. IC50 for each compound was determined using GraphPad software. The IC50 value for each compound was used to estimate the Ki using the equations described by Nikolovska-Coleska, et al 2004.
- Radioligand Binding Assay (Ki) Competition experiments were performed in the presence radioligand with membrane protein (obtained from cells expressing the receptor) and test compounds. The mixture was incubated at room temperature for 60 min and the reaction stopped by rapid filtration onto a 96-well GF/B filter using a Packard Filtermate harvester. Radioactivity retained on the filters was measured by liquid scintillation in a Packard TopCount. IC50 values for test compounds were determined from nonlinear regression analysis of data collected from ligand binding experiments. The inhibition constant (Ki) was calculated from IC50 value by the Cheng and Prusoff equation.
- IMPCH Activity Assay The human ATIC enzyme was used for the inhibition assay using the spectrophotometric method monitoring the appearance of IMP by measuring absorbance at 248 nm. Double reciprocal plots were used to determine the Ki values. Each value was determined using data from two independent experiments.
- Fluorescence Polarization Anisotropy (FPA) Assay A fluorescence polarization anisotropy (FPA) assay that measures the displacement of either a FITC-labeled MLL-derived peptide or a more potent 10mer-Thr-FAM probe in response to compound treatmen. The assay is run in 384-well format and is read on a BioTek Cytation. Compounds are run as 2 replicates on the left and right sides of the plate; therefore a plate can accommodate 16 compounds in a 10-point, 3-fold dilution scheme, plus positive and negative controls. Replicate values are fit to a 4-parameter fit in XLFit to generate a single IC50 value for each compound that is then converted to a Ki value. Experiments are repeated to generate a 2nd, independent Ki value; values from the two experiments are averaged to produce the reported Ki value for the compound. The assay performs with an average Z′ value of 0.7, and is tolerant of up to 5% DMSO.
- QC Inhibition Assay An inhibition activity assay of QC inhibitors was conducted. See Huang et al., J. Biol. Chem. 2011, 286, 12439-12449. A reaction mixture containing 300 μM of Gln-βNA and 0.2 units of human PAP I was prepared. QC was first incubated with an inhibitor at 25° C. for 30 minutes and the enzyme-inhibitor mixture was then added to the reaction mixture to initiate the cyclization reaction. An IC50 value was obtained by fitting an initial reaction rate versus an inhibitor concentration using KaleidaGraph. A Ki value of the inhibitor was calculated according to an equation IC50=Ki(1+[S]/Km). See Segel, Enzyme Kinetics: Behavior and Analysis of Rapid Equilibrium and Steady-State Enzyme Systems, pp. 100-118. New York: John Wiley & Sons, 1993. In this equation, [S] is a substrate (i.e., Gln-βNA) concentration and Km is a Michaelis-Menten constant. The lower the Ki value, the higher the inhibitor's QC inhibition rate.
- Human Coagulation Factor Xa Assay The inhibitory activity on coagulation factor Xa activity in human was measured by using Tris-HCl buffer (50 mM, pH 8.3, 150 mM NaCl). A buffer of 50 mL human coagulation factor Xa (Enzyme Research Laboratories, Inc; final concentration 8.36 nM) or a buffer of 50 μL rat coagulation factor Xa (Enzyme Research Laboratories, Inc; final concentration 57.5 nM) was added dropwise to the appropriate wells of the Greiner 384 microtiter plate to determine IC50. The buffer containing 2 μL 2% (V/V) DMSO (control group which was free of inhibition) or various concentrations of the compounds to be tested were diluted in the buffer containing 2% (V/V) DMSO, and 48 μL buffer of the supporting base S-2222 (Chromogenix; chemical formula: Bz-IIe-Glu(γ-OR)-Gly-Arg-pNA.HCl R═H (50%), wherein R═CH3 (50%)) was added, the final concentration was 0.172 mM. In this experiment, the compounds to be tested and the enzyme were incubated for 10 minutes, and then the substrate S-2222 was added to give a final volume of 100 μL to start the assay.The compounds to be tested were regarded as being active when Ki<10 μM. The compounds whose Ki<1 μM were preferred in the present invention, more preferably Ki<0.1 μM, further more preferably Ki<0.01 μM, and further preferably Ki<0.001 μM. Determined by the above method, some compounds of the present invention were of K1<0.1 μM, thus, the compounds of the present invention can be used as effective factor Xa inhibitors.
- Rat Coagulation Factor Xa Assay The inhibitory activity on coagulation factor Xa activity in rats was measured by using Tris-HCl buffer (50 mM, pH 8.3, 150 mM NaCl). A buffer of 50 mL human coagulation factor Xa (Enzyme Research Laboratories, Inc; final concentration 8.36 nM) or a buffer of 50 μL rat coagulation factor Xa (Enzyme Research Laboratories, Inc; final concentration 57.5 nM) was added dropwise to the appropriate wells of the Greiner 384 microtiter plate to determine IC50. The buffer containing 2 μL 2% (V/V) DMSO (control group which was free of inhibition) or various concentrations of the compounds to be tested were diluted in the buffer containing 2% (V/V) DMSO, and 48 μL buffer of the supporting base S-2222 (Chromogenix; chemical formula: Bz-IIe-Glu(γ-OR)-Gly-Arg-pNA.HCl R═H (50%), wherein R═CH3 (50%)) was added, the final concentration was 0.172 mM. In this experiment, the compounds to be tested and the enzyme were incubated for 10 minutes, and then the substrate S-2222 was added to give a final volume of 100 μL to start the assay.The compounds to be tested were regarded as being active when Ki<10 μM. The compounds whose Ki<1 μM were preferred in the present invention, more preferably Ki<0.1 μM, further more preferably Ki<0.01 μM, and further preferably Ki<0.001 μM. Determined by the above method, some compounds of the present invention were of K1<0.1 μM, thus, the compounds of the present invention can be used as effective factor Xa inhibitors.
- Cathepsin S Ki Determination The assay uses baculovirus-expressed human cathepsin S and the boc-Val-Leu-Lys-AMC fluorescent substrate available from Bachem in a 384 well plate format, in which 7 test compounds can be tested in parallel with a positive control comprising a known cathepsin S inhibitor comparator.
- Inhibition Assay Inhibition of human C1s was determined by the method described in [0092]-[0098] using native human activated C1s complement component from Calbiochem at 29 nM and Val-Ser-Arg-pNA (S2314) at 8 mM, 6 mM, and 4 mM as substrate; results are reported as Ki values (nanomolar).
- Inhibition Assay Inhibition of human C1r was determined by the method described in [0092]-[0098] using native human activated C1r complement component from Calbiochem at 100 nM and Val-Ser-Arg-pNA (S2314) at 16 mM, 12 mM, and 8 mM as substrate; results are reported as Ki values (nanomolar).
- Protease Inhibition Assay The inhibitory activities of the compounds toward HIV-1 PR were determined by sodium dodecyl sulfate-polyacrylamide gel electrophoresis (SDS-PAGE) assay. The Ki values of active compounds were determined using the partially purified protease and the synthetic substrate Ac-Ser-Gln-AsnTyr-Pro-Ile-Val-NH2.
- Radioligand Binding Assay Compound potency can be assessed by a radioligand binding assay (described in Bergman et. al. Bioorg. Med. Chem. Lett. 2008, 18, 1425-1430) in which the inhibition constant (Ki) is determined in membranes prepared from CHO cells expressing either the orexin-1 (OX1) or orexin-2 (OX2) receptor.
- Receptor Binding Assay Nonspecific binding was determined in the presence of 1 uM Bv8. Displacement curves were determined in triplicate. The inhibition constant (Ki) of the three compounds was calculated from IC50, Kd values of labelled MIT for PKR1 and PKR2 being 4 pM and 1.24 pM (PerkinElmer, Membrane Target Systems).
- CK2α Inhibition Assay The activity of CK2α was tested using P81 filter isotopic assay, as it was described earlier [Łukowska-Chojnacka et al., Bioorg. Med. Chem., 24:735-741]. IC50 values for studied compounds were determined with minimum 7 concentrations of each tested inhibitor ranging from 0.064 to 1000 mM (in the presence of 4% DMSO) and calculated by fitting the data to sigmoidal doseresponse (variable slope) Y = Bottom + (Top-Bottom)/(1 + 10^((LogIC50-X) * HillSlope) equation in GraphPad Prism. Ki values were calculated using Cheng and Prusoff [29] equation: Ki = IC50/(1 + [S]/Km), [S] = 10 mM ATP, Km = 11 mM.
- Determination of Inhibition Constants For determination of the inhibition constants (Ki), enzyme inhibition was studied at three different substrate concentrations and seven different concentrations of the inhibitors. The inhibitor was first mixed with the enzyme and incubated 10 min before the reaction was started by addition of the respective substrate solution. The absorbance was monitored for 150 s at 30 s intervals in a spectrophotometer (Spectra Max Molecular Devices, Sunnyvale, CA). After subtraction of the background (measured at 620 nm) from the signal (measured at 405 nm), the steady-state reaction rates were used for construction of Dixon plots and the Ki value was calculated.
- Enzyme Inhibition Assay Recombinant NOS isozymes over-expressed in E. coli were utilized. (Ji, H., et al., Discovery of highly potent and selective inhibitors of neuronal nitric oxide synthase by fragment hopping. J. Med. Chem., 2009. 52(3): p. 779-97; Ji, H., et al., Exploration of the active site of neuronal nitric oxide synthase by the design and synthesis of pyrrolidinomethyl 2-aminopyridine derivatives. J. Med. Chem., 2010. 53(21): p. 7804-24.). Relative enzyme inhibition activity [%] vs. Log (inhibitor concentration [M]) correlation was analyzed by Prism using nonlinear regression method to generate IC50 value. The Ki value was calculated by IC50=Ki(1+[S]/Km).
- Inhibition Assay The term selective inhibitor as used in reference to MMPs refers to an inhibitor that inhibits the enzymatic activity of one MMP in the presence of one or more other MMPs, typically by at least one order of magnitude, for example, with respect to the Ki. The methods used to obtain Ki data are known in the art and are described, for example, by Brown et al., J. Amer. Chem. Soc. 2000, 122(28), 6799-6800, and the references cited therein. Additional useful assays and techniques are described in U.S. Patent Publication No. 2009/0209615 (Lipton et al.), which is incorporated herein by reference in its entirety.
- Inhibition Study on the Interconversion of Testosterone to Androstenedione (4-dione) A radioactive assay was used for the enzyme kinetics in the presence of EM1404 at different concentrations for its Ki determination. Reactions were initiated by the addition of enzyme to the reaction mixture containing substrate and test compounds. After the reaction, the steroids were extracted, separated by TLC migration, and analyzed by phosphorimaging. The Km for testosterone oxidation in the absence of EM-1404, and four apparent Km values in the presence of 1, 3, 10, and 25 nM EM-1404, were determined. Ki value was further determined by a plot of Km vs. the inhibitor concentration.
- Kallikrein Assay Activity assays were performed by diluting a stock solution of substrate at least tenfold to a final concentration ≤0.2 Km into a solution containing enzyme or enzyme equilibrated with inhibitor. Times required to achieve equilibration between enzyme and inhibitor were determined in control experiments. The reactions were performed under linear progress curve conditions and fluorescence increase measured at 405 Ex/510 Em nm. Values were converted to percent inhibition of the control reaction (after subtracting 100% Inhibition value). IC50 was determined by inflection point from a four parameter logistic curve fit. Ki was calculated using the Cheng Prusoff equation, Ki=IC50/(1+([S]/Km)).
- Radioligand Binding Assay (Ki) Compounds were evaluated the inhibition of [3H] nisoxetine binding to MDCK-Net6 cells, stably transfected with the human norepinephrine transporter (hNET). Data from wells containing 1 uM desipramine were used to define non-specific hNET binding. Total radioligand bound is defined by addition of binding buffer alone in the presence of [3H]nisoxetine (Perkin-Elmer). The radioligand binding reaction was initiated by addition of [3H]nisoxetine, and incubated for 2 h at 37 deg C. The KD value estimated for [3H]nisoxetine was 10 nM using intact whole cells. The inhibition constant (Ki) was calculated by the Cheng and Prusoff equation.
- Scintillation Proximity Assay (Ki) and Cell-Based Transcription Assay (EC50) The human PPARalpha ligand binding was directly measured using a scintillation proximity assay. Plates were read on a Packard TopCount. IC50 values for test compounds were determined from nonlinear regression analysis of data collected from ligand displacement binding experiments. The inhibition constant (Ki) was calculated from IC50 value by the Cheng and Prusoff equation. EC50 is the concentration of test compounds needed to induce 50% of the maximum luciferase activity in CV-1 cells transfected with hPPARalpha ligand binding domain and a GAL4 reporter construct. Four hours post-transfection, test compounds were added, and luciferase activity was measured 20 h later.
- 3CL Protease Enzyme Assays The effects of compound on enzyme activity were measured by using peptide cleavage assay. Cleavage products were resolved and analyzed with a reverse-phase HPLC. Quantification of peak areas was used to determine the extent of substrate conversion. Ki was calculated using the equation of Cheng and Prusoff.
- H3R Radioligand Binding Assay Ligand displacement assays were performed on CHO cells membranes expressing hH3R. Retained radioactivity was determined by liquid scintillation counting. Nonspecific binding was determined in the presence of 1 uM thioperamide. The Ki values were calculated based on an experimentally determined appropriate Kd value according to Cheng and Prusoff.
- H4R Radioligand Binding Assay Ligand displacement assays were performed on CHO cells membranes expressing hH4R. Retained radioactivity was determined by liquid scintillation counting. Nonspecific binding was determined in the presence of 10 uM histamine. The Ki values were calculated based on an experimentally determined appropriate Kd value according to Cheng and Prusoff.
- In Vitro Binding Assay Cytosols from rabbit liver were incubated with [3H]-TCDD and 12 concentrations of unlabeled test ligands. IC50 values were determined using the iterative curve-fitting program GraphPad Prism (version 4.0). IC50 values were converted into the apparent Ki using the Cheng-Prussoff equation and Kd values of 0.01 nM.
- Protease Inhibition Assay The Ki values were determined using fluorogenic substrate, 2-(aminobenzoyl)-Thr-Ile-Nle-Phe(p-NO2)-Gln-ArgNH2. A standard curve relating changes in fluorescent intensity to changes in concentration of product was used to convert fluorescent changes into molar velocities. The amount of cleavage was determined by HPLC.
- Protease Inhibition Assay he Ki values were determined using fluorogenic substrate, 2-(aminobenzoyl)-Thr-Ile-Nle-Phe(p-NO2)-Gln-ArgNH2. A standard curve relating changes in fluorescent intensity to changes in concentration of product was used to convert fluorescent changes into molar velocities. The amount of cleavage was determined by HPLC.
- Selectivity Screening (AMPK) Candidates for inhibitor selectivity characterization were chosen based on an initial single-timepoint commercial kinome profiling screen performed with inhibitor 17 (MELK-In-7) (KinomeScan, DiscoveRx, San Diego, Calif.), primary sequence relation to MELK, and laboratory availability. CHK1 and NUAK1 were purchased from SignalChem (Vancouver, BC). The NUAK2, CHK, and SAMS peptides were purchased from BioSyn (Lewisville, Tex.). The sequence of CHK and NUAK2 peptides are described elsewhere (Sanchez Y, et al. Science (New York, N.Y.). 1997; 277(5331):1497-1501; Scott J W, et al. Sci Rep. 2015; 5:14436). ERK2, AMPK, CAMKK2, and Ets1 were produced in house as previously described (Waas W F, Dalby K N. The Journal of biological chemistry. 2002; 277(15):12532-12540; Neumann D, et al. Protein Expr Purif. 2003; 30(2):230-237; Waas W F, Dalby K N. Protein Expr Purif. 2001; 23(1):191-197). Apparent KM values for ATP under specific assay conditions were determined using respective experimental conditions in Table 8 with varied ATP (0-1.28 mM). All selectivity dose-response assays were performed in kinase assay buffer (see Inhibitor Library Screen) with 2 mM DTT and 100 μM γ-32P-ATP with additional conditions listed in Table 8. IC50 and KM ATP values were subsequently used to calculate Ki (Equation 4). Relative selectivity was determined by comparing Ki Enzyme/Ki MELK (termed φ in Table 7). All IC50 and/or Ki data were fit using Prism (GraphPad) using equations 2, 3, and 4, as appropriate. Standard error from linear regression data was propagated internally in Prism and taken into account in nonlinear regression to determine IC50 or Ki. 10 nM AMPK, 100 μM SAMS, 50 μM AMP 0.25-2 min 98 ± 8.4.
- Selectivity Screening (CAMKK2) Candidates for inhibitor selectivity characterization were chosen based on an initial single-timepoint commercial kinome profiling screen performed with inhibitor 17 (MELK-In-7) (KinomeScan, DiscoveRx, San Diego, Calif.), primary sequence relation to MELK, and laboratory availability. CHK1 and NUAK1 were purchased from SignalChem (Vancouver, BC). The NUAK2, CHK, and SAMS peptides were purchased from BioSyn (Lewisville, Tex.). The sequence of CHK and NUAK2 peptides are described elsewhere (Sanchez Y, et al. Science (New York, N.Y.). 1997; 277(5331):1497-1501; Scott J W, et al. Sci Rep. 2015; 5:14436). ERK2, AMPK, CAMKK2, and Ets1 were produced in house as previously described (Waas W F, Dalby K N. The Journal of biological chemistry. 2002; 277(15):12532-12540; Neumann D, et al. Protein Expr Purif. 2003; 30(2):230-237; Waas W F, Dalby K N. Protein Expr Purif. 2001; 23(1):191-197). Apparent KM values for ATP under specific assay conditions were determined using respective experimental conditions in Table 8 with varied ATP (0-1.28 mM). All selectivity dose-response assays were performed in kinase assay buffer (see Inhibitor Library Screen) with 2 mM DTT and 100 μM γ-32P-ATP with additional conditions listed in Table 8. IC50 and KM ATP values were subsequently used to calculate Ki (Equation 4). Relative selectivity was determined by comparing Ki Enzyme/Ki MELK (termed φ in Table 7). All IC50 and/or Ki data were fit using Prism (GraphPad) using equations 2, 3, and 4, as appropriate. Standard error from linear regression data was propagated internally in Prism and taken into account in nonlinear regression to determine IC50 or Ki. 50 nM CAMKK2, 200 μM, NUAK2 peptide, 150 μM total Ca2+, 1 μM calmodulin 0.5-6 min 265 ± 25.
- Selectivity Screening (CHK1) Candidates for inhibitor selectivity characterization were chosen based on an initial single-timepoint commercial kinome profiling screen performed with inhibitor 17 (MELK-In-7) (KinomeScan, DiscoveRx, San Diego, Calif.), primary sequence relation to MELK, and laboratory availability. CHK1 and NUAK1 were purchased from SignalChem (Vancouver, BC). The NUAK2, CHK, and SAMS peptides were purchased from BioSyn (Lewisville, Tex.). The sequence of CHK and NUAK2 peptides are described elsewhere (Sanchez Y, et al. Science (New York, N.Y.). 1997; 277(5331):1497-1501; Scott J W, et al. Sci Rep. 2015; 5:14436). ERK2, AMPK, CAMKK2, and Ets1 were produced in house as previously described (Waas W F, Dalby K N. The Journal of biological chemistry. 2002; 277(15):12532-12540; Neumann D, et al. Protein Expr Purif. 2003; 30(2):230-237; Waas W F, Dalby K N. Protein Expr Purif. 2001; 23(1):191-197). Apparent KM values for ATP under specific assay conditions were determined using respective experimental conditions in Table 8 with varied ATP (0-1.28 mM). All selectivity dose-response assays were performed in kinase assay buffer (see Inhibitor Library Screen) with 2 mM DTT and 100 μM γ-32P-ATP with additional conditions listed in Table 8. IC50 and KM ATP values were subsequently used to calculate Ki (Equation 4). Relative selectivity was determined by comparing Ki Enzyme/Ki MELK (termed φ in Table 7). All IC50 and/or Ki data were fit using Prism (GraphPad) using equations 2, 3, and 4, as appropriate. Standard error from linear regression data was propagated internally in Prism and taken into account in nonlinear regression to determine IC50 or Ki. 5 nM CHK1, 100 μM CHK peptide 0.25-4 min 125 ± 2.5.
- Selectivity Screening (ERK2) Candidates for inhibitor selectivity characterization were chosen based on an initial single-timepoint commercial kinome profiling screen performed with inhibitor 17 (MELK-In-7) (KinomeScan, DiscoveRx, San Diego, Calif.), primary sequence relation to MELK, and laboratory availability. CHK1 and NUAK1 were purchased from SignalChem (Vancouver, BC). The NUAK2, CHK, and SAMS peptides were purchased from BioSyn (Lewisville, Tex.). The sequence of CHK and NUAK2 peptides are described elsewhere (Sanchez Y, et al. Science (New York, N.Y.). 1997; 277(5331):1497-1501; Scott J W, et al. Sci Rep. 2015; 5:14436). ERK2, AMPK, CAMKK2, and Ets1 were produced in house as previously described (Waas W F, Dalby K N. The Journal of biological chemistry. 2002; 277(15):12532-12540; Neumann D, et al. Protein Expr Purif. 2003; 30(2):230-237; Waas W F, Dalby K N. Protein Expr Purif. 2001; 23(1):191-197). Apparent KM values for ATP under specific assay conditions were determined using respective experimental conditions in Table 8 with varied ATP (0-1.28 mM). All selectivity dose-response assays were performed in kinase assay buffer (see Inhibitor Library Screen) with 2 mM DTT and 100 μM γ-32P-ATP with additional conditions listed in Table 8. IC50 and KM ATP values were subsequently used to calculate Ki (Equation 4). Relative selectivity was determined by comparing Ki Enzyme/Ki MELK (termed φ in Table 7). All IC50 and/or Ki data were fit using Prism (GraphPad) using equations 2, 3, and 4, as appropriate. Standard error from linear regression data was propagated internally in Prism and taken into account in nonlinear regression to determine IC50 or Ki. 1 nM ERK2, 20 μM Ets-1 0.25-4 min 98 ± 14
- Selectivity Screening (NUAK1) Candidates for inhibitor selectivity characterization were chosen based on an initial single-timepoint commercial kinome profiling screen performed with inhibitor 17 (MELK-In-7) (KinomeScan, DiscoveRx, San Diego, Calif.), primary sequence relation to MELK, and laboratory availability. CHK1 and NUAK1 were purchased from SignalChem (Vancouver, BC). The NUAK2, CHK, and SAMS peptides were purchased from BioSyn (Lewisville, Tex.). The sequence of CHK and NUAK2 peptides are described elsewhere (Sanchez Y, et al. Science (New York, N.Y.). 1997; 277(5331):1497-1501; Scott J W, et al. Sci Rep. 2015; 5:14436). ERK2, AMPK, CAMKK2, and Ets1 were produced in house as previously described (Waas W F, Dalby K N. The Journal of biological chemistry. 2002; 277(15):12532-12540; Neumann D, et al. Protein Expr Purif. 2003; 30(2):230-237; Waas W F, Dalby K N. Protein Expr Purif. 2001; 23(1):191-197). Apparent KM values for ATP under specific assay conditions were determined using respective experimental conditions in Table 8 with varied ATP (0-1.28 mM). All selectivity dose-response assays were performed in kinase assay buffer (see Inhibitor Library Screen) with 2 mM DTT and 100 μM γ-32P-ATP with additional conditions listed in Table 8. IC50 and KM ATP values were subsequently used to calculate Ki (Equation 4). Relative selectivity was determined by comparing Ki Enzyme/Ki MELK (termed φ in Table 7). All IC50 and/or Ki data were fit using Prism (GraphPad) using equations 2, 3, and 4, as appropriate. Standard error from linear regression data was propagated internally in Prism and taken into account in nonlinear regression to determine IC50 or Ki. 10 nM NUAK1, 100 μM CHK peptide 0.25-4 min 60 ± 3.6.
- In Vitro Biological Assay 50 uM of substrate peptide (acetylated AMC-labeled peptide from p53 residues 379-382, RHKKAc, BioMol. Cat. #KI-177), 91 nM of human SIRT1 (full length human Sirtuin 1 expressed in E. coli, BioMol. Cat. #SE-239) and 500 uM NAD+ in the assay buffer (50 mM Tris-HCl, pH 8.0, 137 mM NaCl, 2.7 mM KCl, 1 mM MgCl2 supplemented with 1 mg/ml BSA for dilution, BioMol. Cat. #KI-143) and 1% final concentration of DMSO were incubated in the presence of gradient concentrations of test compounds (10-dose with 3-fold serial dilution) at 30 C. for 2 h. The reactions were carried out in a 96-well microplate for fluorometry in a 50 ul reaction volume. After the deacetylation reaction, Fluor-de-Lys-Developer II (BioMol. Cat. #KI-176) was added to each well to digest the deacetylated substrate, thus producing the fluorescent signal. The reaction was allowed to develop for 45 minutes at 30 C. with 5% CO2; then the fluorescent signal was measured with an excitation wavelength at 360 nm.
- Inhibition Assay The NOSs isoform assays involved subjecting 3-8 to an oxyhemoglobin NO capture assay using a Biotek Gen5 microplate reader. IC50 values for each compound were determined in duplicate or triplicate using dose-response curves with nine concentration points (1 pM-3 mM). The standard deviation of the assays were less than 15% with nNOS or iNOS, and less than 25% with eNOS. The inhibition constants (Ki) of these compounds were determined from the IC50 and Km values (rat nNOS=1.3 μM; murine iNOS=8.2 μM; bovine eNOS=1.7 μM) for all three NOS isoforms using the following relationship: Ki=IC50/(1+[S]/KM).The selectivity of antagonism of nNOS relative to iNOS or eNOS was determined by calculating the ratios of the Ki values with iNOS or eNOS to those with nNOS. Compounds 3-8, having various amino functional groups, were found to have moderate to excellent selectivity (50-2822 of e/n, 36-273 of i/n) and moderate to good binding affinity (24-4370 nM) to nNOS.
- P2X7 Radioligand Binding Assay human or rat P2X7-1321N1 cells were collected and frozen @ −80° C. On the day of the experiment, cell membrane preparations were made according to standard published methods. The total assay volume was 100 μl:10 μl compound (10×)+(b) 40 μl tracer (2.5×)+50 μl membrane (2×). The tracer used for the assay was tritiated A-804598. The compound can be prepared as described in the literature. (Donnelly-Roberts, D. Neuropharmacology 2008, 56 (1), 223-229.) Compounds, tracer and membranes were incubated for 1 hour @ 4° C. The assay was terminated by filtration (GF/B filters pre-soaked with 0.3% PEI) and washed with washing buffer (Tris-HCl 50 mM). The IC50 generated in the binding assay was corrected for tracer concentration and affinity of the tracer to derive at the affinity (Ki) of the test compounds. The data are presented in Tables 1 and 2 under the headings: P2X7 human Ki (μM) and P2X7 rat Ki (μM). Data are analyzed and graphed on Graphpad Prism 5.
- Time Resolved-Fluorescence Resonance Energy Transfer (TR-FRET) Assay The inhibition constant (Ki) is the dissociation constant of an enzyme-inhibitor complex or a protein/small molecule complex, wherein the small molecule is inhibiting binding of one protein to another protein or peptide. Where the Ki for a compound is represented as > (greater than) a certain numerical value, it is intended to mean that the binding affinity value (e.g., for Bcl-XL) is greater than the limits of detection of the assay used. Where the binding selectivity ratio for a compound is represented as > (greater than) a certain numerical value, it is intended to mean that the selectivity of a particular compound for Bcl-2 over Bcl-XL is at least as great as the number indicated. Where the Ki for a compound is represented as < (less than) a certain numerical value, it is intended to mean that the binding affinity value (e.g., for Bcl-2) is lower than the limit of detection of the assay used. Inhibition constants were determined using Wang's equation (Wang Z-X).
- Inhibition Assay Inhibition of human FIIa was determined by the method described in [0092]-[0098] using human alpha-thrombin from Enzyme Research Laboratories at 0.1 NIH U/mL and Mes-d-Cha-Gly-Arg-pNA (Pefachrome tPA) at 2 mM, 1 mM, and 0.5 mM as substrate; results are reported as Ki values (nanomolar).
- Inhibition Assay Inhibition of human FXIa was determined by the method described in [0092]-[0098] using activated human Factor XI from Enzyme Research Laboratories at 96 ng/mL and H-D-Lys(Cbo)-Pro-Arg-pNA (Pefachrome PCa) at 5 mM, 4 mM, and 2 mM as substrate; results are reported as Ki values (nanomolar).
- Inhibition Assay Inhibition of human FXa was determined by the method described in [0092]-[0098] using activated human Factor X from Enzyme Research Laboratories at 5 mIU/mL and MeOCO-d-Cha-Gly-Arg-pNA (Pefachrome FXa) at 2 mM, 1 mM, and 0.5 mM as substrate; results are reported as Ki values (nanomolar).
- Inhibition Assay Inhibition of human aPC was determined by the method described in [0092]-[0098] using human activated protein C from Enzyme Research Laboratories at 2.2 nM and H-D-Lys(Cbo)-Pro-Arg-pNA (Pefachrome PCa) at 2 mM, 1 mM, and 0.5 mM as substrate; results are reported as Ki values (nanomolar).
- Inhibition Assay Inhibition of human alpha-FXIIa was determined by the method described in [0092]-[0098] using activated human alpha-Factor XII (activated Hageman Factor) from Enzyme Research Laboratories at 50 mPEU/mL and CHA-Gly-Arg-pNA at 2 mM, 1 mM, and 0.5 mM as substrate; results are reported as Ki values (nanomolar).
- Kinase Inhibition Assay The enzyme was assayed with substrate histone H1 in the presence of 12.5 uM ATP/[gamma-32P] ATP. IC50 is the inhibitor concentration, which inhibits 50% of enzyme activity that catalyzes the transfer of the terminal phosphate from [gamma-32P] labeled ATP to histone H1. Ki is the associated inhibition constant.
- MAO Activity Assay MAO A and MAO B activities were determined spectrophotometrically using kinuramine as substrates. Fluorimetric measurements were recorded with a Perkin-Elmer LS 50B spectrofluorimeter. Dixon plots were used to estimate the inhibition constant (Ki) of the inhibitors. The data are the mean values of three or more experiments performed in duplicate.
- MAO Inhibition Assay MAO A and MAO B activities were determined spectrophotometrically using kynuramine as substrates. Fluorimetric measurements were recorded with a Perkin-Elmer LS 50B spectrofluorimeter. Dixon plots were used to estimate the inhibition constant (Ki) of the inhibitors. The data are the mean values of three or more experiments performed in duplicate.
- MMP Enzyme Inhibition Assay Initial rates for the hydrolysis of the thioester substrate were used for assessing the catalytic activity and inhibition of the MMPs by the spectrophotometric method. The change of absorbance at 405 nm was monitored. The inhibition constant Ki was then determined by using Easson-Stedman plots and a linear regression program.
- PTR1 Activity Assay TbPTR1 activity was measured in 96-well microtiter plates via reduction of cytochrome c (cytc) as a result of the enzymatic production of tetrahydrobiopterin (H4B). Enzyme activity was monitored by reading absorbance at 550 nm within the linear phase of reaction. Ki (app) values were calculated using a modified Morrison equation.
- Protease Inhibition Assay Ki values were determined with recombinant single-chain dimeric HIV protease and a fluorescent substrate. The use of single-chain dimeric protease allows the enzyme concentrations as low as 0.0625 nM to be used. Reaction products were separated by HPLC and anion-exchange column, and the product was quantified by fluorescence.
- SARS-CoV 3CL Protease Inhibition Assay The effects of compound on enzyme activity were measured by using a fluorogenic peptide cleavage assay. Enhanced fluorescence caused by cleavage of the substrate peptide was monitored at 538 nm with excitation at 355 nm. The Ki measurements were performed at two fixed inhibitor concentrations and various substrate concentrations.
- DHODH Inhibition Assay The assays were carried out by using a colorimetric DCIP method, which uses the colorimetric reagent 2, 6-dichlorophenolindophenol as the final electron acceptor. DCIP reduction is stoichiometrically equivalent to oxidation of dihydroorotate. Changes in absorbance were quantified in triplicate on a plate reader and data were analyzed to measure the reduction of DCIP as a decrease in absorbance at 600 nm. The data were then processed with Graphpad Prism to determine the IC50 and the apparent enzyme inhibition constant (Ki) for each inhibitor. Ki values were calculated using the Cheng-Prusoff equation with the Km for CoQD of 13 uM and 15 uM for PfDHODH and HsDHODH respectively.
- DHODH Inhibition Assay The assays were carried out by using a colorimetric DCIP method, which uses the colorimetric reagent 2, 6-dichlorophenolindophenol as the final electron acceptor. DCIP reduction is stoichiometrically equivalent to oxidation of dihydroorotate. Changes in absorbance were quantified in triplicate on a plate reader and data were analyzed to measure the reduction of DCIP as a decrease in absorbance at 600 nm. The data were then processed with Graphpad Prism to determine the IC50 and the apparent enzyme inhibition constant (Ki) for each inhibitor. Ki values were calculated using the Cheng-Prusoff equation with the Km for CoQD of 13.4 uM and 14.0 uM for PfDHODH and HsDHODH respectively.
- Enzyme Inhibition Assay Enzyme assay was performed at room temperature on a microplate reader (Safire2TM) using black 96-well microtiter plates purchased from Nunc. Inhibitors and substrates were previously dissolved in 4% DMSO. The hydrolysis of the substrates was recorded as increase in fluorescence intensity. IC50 values were generated by nonlinear regression analysis from plots of vi/v0 versus inhibitor concentration, in which vi is the velocity in presence, and v0 the velocity in the absence of an inhibitor. The kinetic constants were determined by the method of Lineweaver and Burk, and Ki values were consecutively calculated from the following equation: Ki = IC50/[1 + (S/Km)]. The overall error of the assays is estimated to be +/-40%.
- Oatp1d1 Transport Assay In the inhibition experiments, the cells were preincubated for 20 s with test compounds, followed by a 5-min incubation with [3H]E3S (5 nM) or 30-min incubation with LY (5 μM). For the interactors that showed uptake inhibition above 50%, Ki values were determined. For the purpose of distinguishing the type of interaction with chosen compounds, the shift in Km and Vmax values for LY was determined in the presence of a target compound (at a concentration equal to the Ki value of a compound), at varying LY concentrations (8 points) and after 15 min of incubation, which was within the linear range of the LY transport rate.
- Radioligand Binding Assay The procedure for the cross reactivity receptor binding assays was using baculovirus-expressed receptors. After correcting for nonspecific binding, IC50 values were determined. The IC50 value is defined as the concentration of competing ligand required to decrease specific binding by 50%. The IC50 value was determined with the aid of the log-logit (Hill) method, which linearized the concentration response curve. Linear regression was then used to determine the IC50 value. The Ki values were determined by the application of the Cheng-Prusoff equation: Ki=IC50/(1+[L]/Kd] where [L] is the concentration of labeled ligand and Kd is the dissociation constant of the labeled ligand determined in the saturation analysis.
- Radioligand Binding Assay and Agonist Ca2+ Influx Functional Assay The hTRPV1-expressing CHO cell membranes were incubated with [3H]A-778317 and test compounds to establish equilibrium. After incubation was terminated, bound tritium radioactivity (dpm) was counted in a scintillation counter. The Ki values were determined by the application of the Cheng-Prusoff equation: Ki = (IC50 x Kd)/(Kd+[L]) where [L] is the concentration of [3H]A-778317 (2 nM ) and Kd is the dissociation constant of the [3H]A-778317 determined in the saturation analysis (Kd=6.2 nM for A-778317). EC/IC50 is the functional potencies of TRPV1 agonist at the hTRPV1 receptor, as determined in a Ca2+ influx assay.
- Radioligand Binding Assay and Antagonist Ca2+ Influx Functional Assay The hTRPV1-expressing CHO cell membranes were incubated with [3H]A-778317 and test compounds to establish equilibrium. After incubation was terminated, bound tritium radioactivity (dpm) was counted in a scintillation counter. The Ki values were determined by the application of the Cheng-Prusoff equation: Ki = (IC50 x Kd)/(Kd+[L]) where [L] is the concentration of [3H]A-778317 (2 nM ) and Kd is the dissociation constant of the [3H]A-778317 determined in the saturation analysis (Kd=6.2 nM for A-778317). EC/IC50 is the functional potencies of TRPV1 antagonists against 50 nM CAP at the hTRPV1 receptor, as determined in a Ca2+ influx assay.
- JAK Enzyme Assay The activity of the isolated recombinant JAK1 and JAK2 kinase domain was measured by monitoring phosphorylation of a peptide derived from JAK3 (Val-Ala-Leu-Val-Asp-Gly-Tyr-Phe-Arg-Leu-Thr-Thr, fluorescently labeled on the N-terminus with 5-carboxyfluorescein) using the Caliper LabChip technology (Caliper Life Sciences, Hopkinton, Mass.). To determine inhibition constants (Ki) compounds were diluted serially in DMSO and added to 50 μL kinase reactions containing purified enzyme (1.5 nM JAK1, or 0.2 nM JAK2), 100 mM HEPES buffer (pH 7.2), 0.015% Brij-35, 1.5 μM peptide substrate, ATP (25 μM), 10 mM MgCl2, 4 mM DTT at a final DMSO concentration of 2%. Reactions were incubated at 22° C. in 384-well polypropylene microtiter plates for 30 minutes and then stopped by addition of 25 μL of an EDTA containing solution (100 mM HEPES buffer (pH 7.2), 0.015% Brij-35, 150 mM EDTA), resulting in a final EDTA concentration of 50 mM. After termination of the kinase reaction, the proportion of phosphorylated product was determined as a fraction of total peptide substrate using the Caliper LabChip 3000 according to the manufacturer's specifications. Ki values were then determined using the Morrison tight binding model (Morrison, J. F., Biochim. Biophys. Acta. 185:269-296 (1969); William, J. W. and Morrison, J. F., Meth. Enzymol., 63:437-467 (1979)) modified for ATP-competitive inhibition [Ki=Ki,app/(1+[ATP]/Km,app)].
- JAK Enzyme Assays The activity of the isolated recombinant JAK1 and JAK2 kinase domain was measured by monitoring phosphorylation of a peptide derived from JAK3 (Val-Ala-Leu-Val-Asp-Gly-Tyr-Phe-Arg-Leu-Thr-Thr, fluorescently labeled on the N-terminus with 5-carboxyfluorescein) using the Caliper LabChip technology (Caliper Life Sciences, Hopkinton, Mass.). To determine inhibition constants (Ki), compounds were diluted serially in DMSO and added to 50 μL kinase reactions containing purified enzyme (1.5 nM JAK1, or 0.2 nM JAK2), 100 mM HEPES buffer (pH 7.2), 0.015% Brij-35, 1.5 μM peptide substrate, ATP (25 μM), 10 mM MgCl2, 4 mM DTT at a final DMSO concentration of 2%. Reactions were incubated at 22° C. in 384-well polypropylene microtiter plates for 30 minutes and then stopped by addition of 25 μL of an EDTA containing solution (100 mM HEPES buffer (pH 7.2), 0.015% Brij-35, 150 mM EDTA), resulting in a final EDTA concentration of 50 mM. After termination of the kinase reaction, the proportion of phosphorylated product was determined as a fraction of total peptide substrate using the Caliper LabChip 3000 according to the manufacturer's specifications. Ki values were then determined using the Morrison tight binding model (Morrison, J. F., Biochim. Biophys. Acta. 185:269-296 (1969); William, J. W. and Morrison, J. F., Meth. Enzymol., 63:437-467 (1979)) modified for ATP-competitive inhibition [Ki=Ki,app/(1+[ATP]/Km,app)].
- ChC Enzyme Inhibition Assay The rate of hydrolysis was determined from the change in absorbance at 324 nm using an extinction coefficient, 24700 M-1 cm-1 for FALGPA. Initial velocities were thus estimated using the direct linear plot-based procedure. The inhibition constant Ki was then determined by using Easson-Stedman plots and a linear regression program.
- Fluorometric Activity Assay Enzymatic activity was determined with fluorogenic substrate in the presence and absence of inhibitor. The fluorescence increase due to hydrolysis of the substrate was monitored with an excitation filter of wavelength 340 nm and an emission filter of wavelength 420. Values for the inhibition constants (Ki) were determined by conventional steady-state kinetic techniques.
- Inhibition Assay Inhibition of human t-PA was determined by the method described in [0092]-[0098] using recombinant human tissue-type plasminogen activator (Actilyse®) from Boehringer Ingelheim at 290 U/mL and Mes-d-Cha-Gly-Arg-pNA (Pefachrome tPA) at 4 mM, 2 mM, and 1 mM as substrate; results are reported as Ki values (nanomolar).
- Protease Inhibition Assay HIV-1 protease activity was measured by a continuous fluorometric assay. The proteolytic activity can be monitored by the increase in fluorescence intensity, and the protease products were analyzed by HPLC. IC50 values were determined from a dose-response curve, whereas Ki values were obtained by fitting initial rates to a tight-binding inhibition equation.
- Protease Inhibition Assay The Ki values were determined by substrate cleavage assay using fluorogenic substrate, 2-(aminobenzoyl)-Thr-Ile-Nle-Phe(p-NO2)-Gln-Arg-NH2. A standard curve relating changes in fluorescent intensity to changes in concentration of product was used to convert fluorescent changes into molar velocities. The amount of cleavage was determined by HPLC.
- Radioligand Labeled Binding Assay Log IC50 values for each test compound were determined from nonlinear regression analysis of data collected from two independent experiments performed in duplicates (40 independent experimental values) using GraphPad Prizm 4 software (GraphPad, San Diego, California). The inhibition constant (Ki) was calculated from the antilogarithmic IC50 value by the Cheng and Prusoff equation.
- Competition Binding Assay (Ki) The scintillation proximity assay was performed in 96-well plates containing polylysine-coated yttrium silicate beads, His-PPARgamma-LBD, and [3H]rosiglitazone. Test compounds were tested in 10-point concentration-response curves starting at the indicated concentration. All components were added simultaneously and incubated with gentle shaking for 1 h at room temperature. Scintillation counts were determined in a Microbeta 1450 Wallac Trilux counter (PerkinElmer Life Sciences), reading each well for 1 min. Wells devoid of competitor represented 100% binding. Nonspecific binding was measured by leaving PPARgamma protein out of the scintillation proximity assay reaction. Experiments were repeated three times. Ki values of the ligands were calculated using Graph-Pad Prism version 4.0c for Macintosh (GraphPad Software).
- Competitive Ligand Binding Assay, GR-Mediated Agonist Activity Assay, and IL-6 Repression Assay Competitive Ligand Binding Assay- The Ki values were determined by the application of the Cheng-Prusoff equation: Ki=IC50/(1+[L]/Kd) where [L] is the concentration of labeled ligand and Kd is the dissociation constant of the labeled ligand determined in the saturation analysis. GR-Mediated Agonist Activity Assay- GR-mediated activation by compounds is measured against maximal activation of dexamethasone in the same experiment and reported as % relative efficacy. Potencies of compounds are reported as the concentration at which they reach half their agonist (EC50). IL-6 Repression Assay- The GR-mediated repression of IL-6 production in a human fibroblast (NHDFneo) cell line is measured with a modified ELISA assay.
- Determination of the value of binding affinity constant (KO between the compound and BRD4 BD2 protein The purity of BRD4 BD2 protein used in the experiment was greater than 95%, and the protein concentration was 46.33 uM. The 96-well plate was purchased from Corning (black, #3694). The multifunctional microplate reader was a product of TECAN, model: SPARK 10M. Buffer: 100 mM potassium phosphate (pH 6.5), 2% ethylene glycol (Sigma) and 0.01% Trition X-100 (Sigma). The experimental water was Millipore-Q pure water.The Ki value of the compound and BRD4 BD2 protein was measured according to the FP test procedures for detecting the Ki value of the compound and BRD4 BD1 protein except that the BRD4 BD1 protein was replaced with the BRD4 BD2 protein.
- Enzyme Inhibition and Ki Determination The IC50 inhibition assays were performed in a 96-well microtiter plate format using purified recombinant IDO, which was added to the substrate, L-tryptophan (L-Trp), and the inhibitor. After the reaction, the product N-formylkynurenine was converted to kynurenine. The yellow color generated from reaction with kynurenine was measured at 490 nm using a microtiter plate reader. The data were analyzed using Graph Pad Prism 4 software (Graph Pad Software Inc.). For the Ki determinations, tryptophan concentrations were varied from 25 to 200 uM (Km= 42 uM) and inhibitor concentrations were varied between 3-fold above and below the calculated IC50. Data were analyzed with the Enzyme Kinetics module in SigmaPlot, version 10.
- Human Neutrophil Elastase Inhibition Assay HTS was performed in black flat-bottom 96-well microtiter plates. The reaction was initiated by addition of elastase substrate to the reaction buffer containing enzyme and test compounds. Kinetic measurements were obtained using a Fluoroskan Ascent FL fluorescence microplate reader (Thermo Electron, MA) with excitation and emission wavelengths at 355 and 460 nm, respectively. For selected lead compounds, the inhibition constant (Ki) values were determined using Dixon plots of three to four different concentrations of the substrate. At each substrate concentration, rates were determined with four to five different inhibitor concentrations, and the inverse of the velocities was plotted against the final inhibitor concentration. Ki was determined from the intersection of the plotted lines.
- [3H]GABA Filtration Binding Assay (Ki) and FLIPR Assay for Agonism (EC50) Inhibition of [3H]GABA binding at GABAB receptor sites in rat brain synaptic membranes by test compounds was measured using a filtration binding assay. Displacement curves to determine IC50 values were constructed by fitting the 4-parameter logistic equation to the data. Kd for GABA was determined on each preparation by homologous competition and used to calculate Ki values from IC50 determinations using the Cheng-Prusoff equation. The average Kd for GABA was determined to 110 +/- 21 nM. The EC50/IC50 values were obtained from measurement of GABAB receptor dependent release of intracellular calcium in Fluorescence Imaging Plate Reader (FLIPR) assay using CHO cells transfected with GABAB(1a)-Gqi5 and GABAB(2).
- Radioligand Binding human or rat P2X7-1321N1 cells were collected and frozen @ −80° C. On the day of the experiment, cell membrane preparations were made according to standard published methods. The total assay volume was 100 μl: 10 μl compound (10×)+(b) 40 μl tracer (2.5×)+50 μl membrane (2×). The tracer used for the assay was tritiated A-804598. The compound can be prepared as described in the literature. (Donnelly-Roberts, D. Neuropharmacology 2008, 56 (1), 223-229.) Compounds, tracer and membranes were incubated for 1 hour @ 4° C. The assay was terminated by filtration (GF/B filters pre-soaked with 0.3% PEI) and washed with washing buffer (Tris-HCl 50 mM). The IC50 generated in the binding assay was corrected for tracer concentration and affinity of the tracer to derive at the affinity (Ki) of the test compounds. The data are presented in Table 2 under the headings: P2X7 human Ki (μM) and P2X7 rat Ki (μM). Data are analyzed and graphed on Graphpad Prism 5. For analysis, each concentration point is averaged from triplicate values and the averaged values are plotted on Graphpad Prism.
- Radioligand Binding uman or rat P2X7-1321N1 cells were collected and frozen @−80° C. On the day of the experiment, cell membrane preparations were made according to standard published methods. The total assay volume was 100 μl:10 μl compound (10x)+(b) 40 μl tracer (2.5×)+50 μl membrane (2x). The tracer used for the assay was tritiated A-804598. The compound can be prepared as described in the literature. (Donnelly-Roberts, D. Neuropharmacology 2008, 56 (1), 223-229.) Compounds, tracer and membranes were incubated for 1 hour @ 4° C. The assay was terminated by filtration (GF/B filters pre-soaked with 0.3% PEI) and washed with washing buffer (Tris-HCl 50 mM). The IC50 generated in the binding assay was corrected for tracer concentration and affinity of the tracer to derive at the affinity (Ki) of the test compounds. The data are presented in Tables 2 and 3 under the headings: P2X7 human Ki (μM) and P2X7 rat Ki (μM). Data are analyzed and graphed on Graphpad Prism 5. For analysis, each concentration point is averaged from triplicate values and the averaged values are plotted on Graphpad Prism.
- hSortilin Affinity Assay The Sortilin assay was performed in total volume of 40 ul in 50 mM HEPES pH 7.4 assay buffer containing 100 mM NaCl, 2.0 mM CaCl2, 0.1% BSA and 0.1% Tween-20. Varying concentration of compounds where pre-incubated for 30 min at RT with 150 nM of 6his-Sortilin. 5 nM [3H]-Neurotensin was added as radioligand and nonspecific binding defined as the binding in the presence 20 μM of Neurotensin. Ni chelate imaging beads (Perkin Elmer) was added and the plate was slowly shaked in the dark for 60 min. The imaging beads were allowed minimum 6 hours settling time before the plate was read on a ViewLux with 360 sec exposure time. Dose-response evaluation of compounds was performed with 10 concentrations of drugs (covering 3 decades). IC50 values were calculated by nonlinear regression using the sigmoid concentration-response (variable slope) using Xlfit 4 (IDBS, UK). The results were given as Ki values (nM) derived from computer fitted IC50 values converted to Ki values using the Cheng-Prusoff equation (Ki=IC50/(1+(L/Kd))). Kd for Neurotensin was determined to 100 nM.
- mSortilin Affinity Assay The Sortilin assay was performed in total volume of 40 μl in 50 mM HEPES pH 7.4 assay buffer containing 100 mM NaCl, 2.0 mM CaCl2, 0.1% BSA and 0.1% Tween-20. Varying concentration of compounds where pre-incubated for 30 min 10 at RT with 50 nM of 6his-Sortilin. 5 nM [3H]-Neurotensin was added as radioligand and nonspecific binding defined as the binding in the presence 20 μM of Neurotensin. Ni chelate imaging beads (Perkin elmer) were added and the plate was slowly shaken in the dark for 60 min. The imaging beads were allowed a minimum 6 hours settling time before the plate was read on a ViewLux with 360 sec exposure time. Dose-response evaluation of compounds was performed with 10 concentrations of drugs (covering 3 decades). IC50 values were calculated by nonlinear regression using the sigmoid concentration-response (variable slope) using Xlfit 4 (IDBS, UK). The results were given as Ki values (nM) derived from computer-fitted IC50 values converted to Ki values using the Cheng-Prusoff equation (Ki=20 IC50/(1+(L/Kd))). Kd for Neurotensin was determined to 100 nM.
- mSortilin Affinity Assay The Sortilin assay was performed in total volume of 40 ul in 50 mM HEPES pH 7.4 assay buffer containing 100 mM NaCl, 2.0 mM CaCl2, 0.1% BSA and 0.1% Tween-20. Varying concentration of compounds where pre-incubated for 30 min at RT with 50 nM of 6his-Sortilin. 5 nM [3H]-Neurotensin was added as radioligand and nonspecific binding defined as the binding in the presence 20 M of Neurotensin. Ni chelate imaging beads (Perkin elmer) was added and the plate was slowly shacked in the dark for 60 min. The imaging beads were allowed minimum 6 hours settling time before the plate was read on a ViewLux with 360 sec exposure time. Dose-response evaluation of compounds was performed with 10 concentrations of drugs (covering 3 decades). IC50 values were calculated by nonlinear regression using the sigmoid concentration-response (variable slope) using Xlfit 4 (IDBS, UK). The results were given as Ki values (nM) derived from computer fitted IC50 values converted to Ki values using the Cheng-Prusoff equation (Ki=IC50/(1+(L/Kd))). Kd for Neurotensin was determined to 100 nM.
- Assay for Determination of KI Values for Inhibition of O-GlcNAcase Activity Experimental procedure for kinetic analyses: Enzymatic reactions were carried out in a reaction containing 50 mM NaH2PO4, 100 mM NaCl and 0.1% BSA (pH 7.0) using 2 mM 4-Methylumbelliferyl N-acetyl-β-D-glucosaminide dihydrate (Sigma M2133) dissolved in ddH2O, as a substrate. The amount of purified human O-GlcNAcase enzyme used in the reaction was 0.7 nM. Test compound of varying concentrations was added to the enzyme prior to initiation of the reaction. The reaction was performed at room temperature in a 96-well plate and was initiated with the addition of substrate. The production of fluorescent product was measured every 60 sec for 45 min with a Tecan Infinite M200 plate-reader with excitation at 355 nM and emission detected at 460 nM, with 4-Methylumbelliferone (Sigma M1381) used to produce a standard curve. The slope of product production was determined for each concentration of compound tested and plotted, using standard curve fitting algorithms for sigmoidal dose response curves. The values for a four parameter logistic curve fit of the data were determined. KI values were determined using the Cheng-Prusoff equation; the Km of O-GlcNAcase for substrate was 0.2 mM. Many compounds of the invention exhibit KI values for inhibition of O-GlcNAcase in the range 0.1 nM-10 μM. The KI values for the compounds of the examples are shown in the table below. The following table shows representative data for the compounds of the Examples as determined by the assay described herein.
- Beta-2 Adrenergic Receptor Binding Assay In the binding assays, the results were expressed as percent inhibition of the control radioligand specific binding. The IC50 values (concentration causing a half maximal inhibition of control specific binding) were determined by non-linear regression analysis of the competition curves using Hill equation curve fitting. The inhibition constants (Ki) were calculated from the Cheng Prusoff equation.
- Chk1 Enzymatic Assay In vitro Chk1 enzymatic assay using purified enzyme, was incubated with substrate, and test compounds in the presence of 10 uM ATP/ [gamma-32P] ATP. 32P incorporation was measured with a scintillation counter. IC50 values were determined by a least-squares fit to the equation, CPM = Vmax X(1 - ([I]/(IC50 + [I]))) + nonspecific binding. Ki,app = IC50/(1 + [ATP]/Km).
- GAR Tfase Activity Assay Assays were initiated by the addition of GAR to the reaction mixture containing GAR Tfase, test compounds, and cofactor. The assay monitors the deformylation of fDDF resulting from the transfer of the formyl group to GAR. Reaction rates were measured in triplicate using a Gilford 252 spectrophotometer. Double reciprocal plots were used to determine the Ki values.
- GW0385 Assay The assay method employed kinetic determinations of values for k1 and k-1, from which value of inhibition constant (Ki ) was determined (k-1/k1). The k1 is calculated from spectrofluorometric data in the presence of saquinavir. The k-1 is calculated from the time course for displacement of [3H]GW0385 from E[3H]GW0385 by nonlabeled GW0385.
- Kinase Activity Assay The enzyme activity was assayed by using an ATP regenerative NADH consuming system. The reaction was started with adding ATP to the mixture containing enzyme, substrate, and inhibitor. The decrease of NADH was time-dependent, and the absorbance changed at 340 nm was monitored. The inhibition constant, Ki for inhibiting PKA and ROCK were obtained from dose-response titration curves.
- Phosphatase Inhibition Assay The activity of PTP1B enzyme was assayed with DiFMUP as substrate. Hydrolysis of substrate was monitored on a Victor V plate reader (Wallac). Kinetic measurements were measured using 3-5 concentrations of inhibitor around the IC50 over a range of substrate concentrations (3-500 uM). Data were used to determine Km/Ki/competitive inhibition using GraphPad Prism software.
- Protease Inhibition Assay HIV-1 protease activity was measured by a continuous fluorometric assay using the internally quenched fluorogenic substrate DABCYL-GABA-Ser-Gln-Tyr-Pro-Ile-Val-Gln-EDANS (BACHEM; M-1865) and a SPEX FluoroMax spectrofluorometer (excitation 340 nm, emission 490 nm). The apparent Ki was estimated by nonlinear regression (GraFit, Erithacus Software) to the equation for tight-binding inhibitor.
- Radiochemical Assay for PNMT Activity Enzyme activity is determined by measuring the amount of 3H incorporated into the substrate during the reaction. AdoMet/[methyl-3H]AdoMet serves as a methyl donor. Ki values were determined by a hyperbolic fit of the data using the single substrate-single inhibitor routine in the enzyme kinetics module(version 1.1) in SigmaPlot (version 7.0).
- Radiochemical Assay of PNMT Inhibitors Enzyme activity is determined by measuring the amount of 3H incorporated into the substrate during the reaction. AdoMet/[methyl-3H]AdoMet serves as a methyl donor. Ki values were determined by a hyperbolic fit of the data using the single substrate-single inhibitor routine in the enzyme kinetics module(version 1.1) in SigmaPlot (version 7.0).
- Radioligand Binding Assay A scintillation proximity assay was used for radioligand competition and saturation binding assays. Nonspecific binding was determined in the presence of 1 uM PGD2. Binding activity was determined by using a 1450 Microbeta scintillation counter (Wallac, UK). Ki values were calculated by using the Cheng-Prusoff equation, and represent the average of at least three independent dose-response experiments.
- Radioligand binding assay Radioligand binding assay (described in Bergman et. al. Bioorg. Med. Chem. Lett. 2008, 18, 1425-1430) in which the inhibition constant (Ki) is determined in membranes prepared from CHO cells expressing either the OX1 or OX2 receptor. The intrinsic orexin receptor antagonist activity of a compound which may be used in the present invention may be determined by these assays.
- Receptor Binding Assay Competitive binding displacement analysis was performed with membranes prepared from CHO-K1 cells stably expressing receptors. After incubation, samples were collected on GF/B glass-fiber, washed, and counted for radioactivity. IC50 values were obtained by fitting the competition binding curves according to a 4-parameter logistic model. Inhibition constants Ki were derived from the Cheng-Prusoff equation.
- SPR Competitive Binding Assay SPR interaction analyses were performed with a Biacore 2000, using Biacore 2000 Control Software v3.2 and BIAevaluation v4.1 analysis software (Biacore) as described in Mol Cancer Ther 7:2621 (2008). For the competitive binding assays and the Ki determination, PtdIns(3,4,5)phosphate-biotin labeled liposomes (Echelon Biosciences) and SA chips were used with increasing concentrations of the compound tested.
- Enzyme Assay The reactions were carried out in a 96-well microplate for fluorometry in a 50 μl reaction volume. After the deacetylation reaction, Fluor-de-Lys-Developer (BioMol Cat. # KI-105) was added to each well to digest the deacetylated substrate, thus producing the fluorescent signal. The reaction was allowed to develop for 45 minutes at 30° C. with 5% CO2; then the fluorescent signal was measured with an excitation wavelength at 360 nm and an emission wavelength at 460 nm in a microplate-reading fluorometer (GeminiXS; Molecular Devices, Sunnyvale, Calif.). A curve of Deacetylated Standard (Biomol, Cat. # KI-142; made from 100 μM with 1:2 dilution and 10-doses, 6 μl) allowed the conversion of fluorescent signal into micromoles of deacetylated product.
- Enzyme Inhibition Assay Potential inhibitors were evaluated using the progress curve method. Assays were carried out in the presence of variable concentrations of test compound. Reactions were initiated by addition of enzyme to buffered solutions of inhibitor and substrate. Product fluorescence (excitation at 360 nM, emission at 460 nM) was monitored with a Perceptive Biosystems Cytofluor II fluorescent plate reader. Product progress curves were generated over 20-30 min following formation of AMC product. For those compounds whose progress curves were linear, apparent inhibition constants (Ki,app) were calculated according to the equation: V = VmA[Ka(1 + I/Ki,app) + A], where V is the velocity of the reaction with maximal velocity Vm, A is the concentration of substrate with Michaelis constant of Ka, and I is the concentration of inhibitor.
- Inhibitor Screening Using Bacterial System (IC50) and Measurement of Inhibition Constant (Ki) Nineteen Pyr analogs were studied for their inhibition activity against cells expressing either WT or SP21 mutant PvDHFR-TS. The assays were conducted with 96-well microplates by monitoring the growth at an optical density of 595 nm (A595). The average A595 of control culture omitting Pyr analogs was scored as 100% growth, and the average readings for the cultures at each drug concentration were divided by this value to obtain relative growth values. The concentrations that inhibited 50% bacterial growth (IC50s) were determined from dose-response curves. Inhibition constants (Ki) of antifolates were calculated using a nonlinear least square fit of the data to the Michaelis-Menten equation, assuming the inhibitor binds competitively to the enzyme active site.
- Radioligand Binding Assay (Ki) and Norepinephrine Uptake Assay (IC50) Compounds were evaluated the inhibition of [3H] nisoxetine binding to MDCK-Net6 cells, stably transfected with the human norepinephrine transporter (hNET). Data from wells containing 1 uM desipramine were used to define non-specific hNET binding. Total radioligand bound is defined by addition of binding buffer alone in the presence of [3H]nisoxetine (Perkin-Elmer). The radioligand binding reaction was initiated by addition of [3H]nisoxetine, and incubated for 2 h at 37 deg C. The KD value estimated for [3H]nisoxetine was 10 nM using intact whole cells. The inhibition constant (Ki) was calculated by the Cheng and Prusoff equation. IC50 Values were obtained from inhibition of norepinephrine uptake in MDCK-Net6 cells, stably transfected with the human NET.
- AICAR Tfase Inhibition Assay Recombinant human AICAR Tfase was used in the inhibition assay. The reaction was monitored at 298 nm by measuring the increase in absorbance corresponding to the formation of THF. The THF was generated in the transfer reaction of the formyl group from cofactor to AICAR to produce 5-formyl-AICAR. Double reciprocal plots were used to determine the Ki values.
- CA Activity Assay The method for determination of Ki values is described elsewhere [Landolfi et al., J. Pharmacol. Toxicol. Methods, 38:169-172; B lb l et al., J. Enzyme Inhib. Med. Chem., 18:371-375; Cift i et al., J. Enzyme Inhib. Med. Chem., 20:103-108; Hisar et al., J. Appl. Anim. Res., 30:185; Winum et al., Bioorg. Med. Chem. Lett., 15:3302-3306].
- CDK Activity Assay. In vitro CDK enzymatic assay using purified CDK mixed with cyclin A, was incubated with substrate, and test compounds in the presence of 1.4 uM ATP/ [gamma-32P] ATP. 32P incorporation was measured with a scintillation counter. IC50 values were determined by a least-squares fit to the equation, CPM = Vmax X(1 - ([I]/(IC50 + [I]))) + nonspecific binding. Ki,app = IC50/(1 + [ATP]/Km).
- Carbonic Anhydrase Enzyme Inhibition Assay Initial rates of 4-nitrophenyl acetate hydrolysis catalyzed by different CA isozymes were monitored spectrophotometrically at 400 nm. A molar absorption coefficient of 18400 M-1 cm-1 was used for the 4-nitrophenolate formed by hydrolysis. Ki values were obtained from Easson-Stedman plots using a linear regression program, from at least three different assays. Standard errors were of 5-10%.
- Enzyme Activity Assay The Ki values were determined as described in the literature [Landolfi et al., J. Pharmacol. Toxicol. Methods, 38:169-172; B lb l et al., J. Enzyme Inhib. Med. Chem., 18:371-375; Ciftci et al., J. Enzyme Inhib. Med. Chem., 20:103-108; Hisar et al., J. Appl. Anim. Res., 30:185-187; Winum et al., Bioorg. Med. Chem. Lett., 15:3302-3306].
- Enzyme Inhibition Assay Phosphorylase activity was measured in the direction of glycogen synthesis by the release of orthophosphate from Glc-1-P. The enzyme was assayed in glycogen with various concentrations of Glc-1-P, AMP and inhibitors. Inorganic phosphate released in the phosphorylase reaction was determined. Ki values, at each concentration of inhibitor, were then determined by plotting Km(app) versus inhibitor concentration.
- Enzyme Inhibition Assay The cholinesterase assays were performed using colorimetric method reported by E llman. Inhibition of enzyme activity was measured over a substrate concentration range of 0.03-3.5 mM and at least six inhibitor concentrations. Plots of [I ]vi/(vo-vi) versus [substrate] at different inhibitor concentrations were analyz ed by linear least squares methods to determine Ki values from the y-intercept.
- Esterase Assay Initial rates of 4-nitrophenyl acetate hydrolysis catalyzed by different CA isozymes were monitored spectrophotometrically at 400 nm. A molar absorption coefficient of 18400 M-1 cm-1 was used for the 4-nitrophenolate formed by hydrolysis. Ki values were obtained from Easson-Stedman plots using a linear regression program, from at least three different assays. Standard errors were of 5-10%.
- FAAH Inhibition Assay The inhibition assays were performed by incubating enzyme, 14C-labeled oleamide in reaction buffer at room temperature in the presence of three different concentrations of inhibitor. The 14C-labeled oleamide (substrate) and oleic acid (product) were extracted and analyzed by TLC. The Ki of the inhibitor was calculated using a Dixon plot. Lineweaver-Burk analysis was performed, confirming competitive, reversible inhibition.
- Kinase Inhibition Assay In vitro kinase inhibition assay using purified GSK-3 alpha from insect cells, was incubated at room temperature with substrate, and test compounds in the presence of ATP/ [gamma-33P]. The total ATP concentration was 10 µM (IC50 determinations) or ranged from 0 to 45 µM (Ki determinations). 33P incorporation into the substrate peptide was determined by using a scintillation counter (Wallac).
- Kinetic Analysis The reaction mixtures contained in various different concentrations of p-NPP as a PTP1B substrate in the presence or absence of the active compound. The kinetic analysis was evaluated for Michaelis-Menten plot, Lineweaver-Burk plot, and Dixon plot. The Michaelis constant (Km), maximum velocity (Vmax), and the inhibition constants (Ki) were determined by using Sigma Plot software (13.0 software, SPCC Inc., Chicago, IL, USA).
- Radioligand Binding Assay Competition radioligand binding assays were performed with increasing concentrations of test compound in the presence of [3H]ligand. All binding reactions were terminated by filtration. Bound radiolabel was determined by liquid scintillation counting. For all of the radioligand competition binding assays, IC50 values and Hill slopes were determined by Hill transformation of the data and Ki values were determined by the Cheng-Prusoff equation.
- Binding Affinity Assay (Ki) and cAMP Accumulation Activity Assay (EC50) The affinities of test compounds for human V2 receptor were evaluated by the radioligand binding study using membrane fractions isolated from CHO cells expressing human V2 receptors. For the competitive binding study, drug compound solution and [3H]vasopressin were mixed with membrane suspension in reaction buffer. This mixture was incubated at room temperature for 60 min. Reactions were terminated by filtration through UniFilter GF/B (Perkin-Elmer) using a MicroMate Cell Harvester (Packard Instrument Company, Meriden, CT, USA). The radioactivity retained on the filter was counted by TopCountTM microplate scintillation counter (Perkin-Elmer) using the scintillation cocktail (MicroScinti-40TM, Perkin-Elmer). The concentration of each compound required to reduce specific binding of [3H]vasopressin by 50% (IC50 value) was obtained by non-linear regression analysis. A Kd value of [3H]vasopressin for each vasopressin receptor was yielded by Scatchard plot analysis. The affinity constants (Ki values) were calculated from the following equation, using the Kd values yielded from each separate experiment. Ki =IC50/(1 + [[3H]vasopressin concentration]/Kd). EC50 values were determined as the concentration of the test compound required to increase the cAMP level to 50% of the maximum response to AVP. All assays were performed in triplicate.
- CB1 receptor binding assay Mouse brain membranes were used as the source material for CB1 receptors. The displacement of specifically bound tritiated CP-55.940 from these membranes using a standard filtration assay was used to determine the Ki values for the test compounds. Briefly. 20 μg of protein was incubated for 1 h at 30° C. in the presence of 0.5 nM [3H]CP-55,940 and various concentrations (10−5M-10−11M) of test compound/control, final volume of 1 mL. The incubation was terminated by rapid filtration and washing, and the amount of specifically bound [3H]CP-55,940 was determined. Briefly, membranes with bound [3H]CP-55,940 were separated and washed from free ligand by vacuum filtration, adsorbing the membrane onto a Whatman glass microfiber filter paper (LIFEGENE, Cat #1821271). Finally, the Whatman filter paper with adsorbed membranes was cut and placed in scintillation liquid (Ultima Gold) for 1 h at 25° C. followed by a β counter reading of bound [3H]CP-55,940 radioligand. All data were in triplicates with Ki values determined using GraphPad Prism 7.02 analysis software. Data normalized between 0 and 100% specific binding were plotted against log concentration of test compound, and Ki was extracted using nonlinear regression analysis.
- CB2 receptor binding assay Human kidney membranes were used as the source material for CB2 receptors. The displacement of specifically bound tritiated CP-55,940 from these membranes using a standard filtration assay was used to determine the Ki values for the test compounds. Briefly, 1.25 μg of protein was incubated for 1.5 h at 30° C. in the presence of 0.5 nM [3H]CP-55,940 and various concentrations (10−5M-10−11M) of test compound/control, final volume of 1 mL. The incubation was terminated by rapid filtration and washing, and the amount of specifically bound [3H]CP-55,940 was determined. Briefly, membranes with bound [3H]CP-55,940 were separated and washed from free ligand by vacuum filtration, adsorbing the membrane onto a Whatman glass microfiber filter paper (LIFEGENE, Cat #1821271). Finally, the Whatman filter paper with adsorbed membranes was cut and placed in scintillation liquid (Ultima Gold) for 1 h at 25° C. followed by a β counter reading of bound [3H]CP-55,940 radioligand. All data were in triplicates with Ki values determined using GraphPad Prism 7.02 analysis software. Data normalized between 0 and 100% specific binding were plotted against log concentration of test compound, and Ki was extracted using nonlinear regression analysis.
- Chromogenic Enzyme Activity Assays In general, proteolytic activity was tested by monitoring the cleavage of the specific chromogenic substrate at 405 nm wavelength for 60 or 120 minutes in a Tecan Spark M10 or Tecan Genios Pro plate reader at 37° C. After optimization of assay conditions, every enzyme was tested in 100 μL final volume with 500 μM chromogenic substrate. Where applicable, inhibitor and enzyme were pre-incubated for 10 minutes in the buffer at 37° C. before substrate addition. Compounds were pre-solved in DMSO and used in the assays with a final DMSO concentration of 3% (v/v). n order to determine KM values, the assays were performed as described but with differing substrate concentrations (10 μM to 4 mM). Specific activity was calculated and plotted against substrate concentrations in GraphPad Prism 5 software. Michaelis-Menten (software built-in) analysis was used to calculate the KM values. In order to determine IC50 and Ki values, enzyme assays were performed with differing inhibitor concentrations (2.5 nM to 20/200 μM), specific activities were calculated, and plotted against log inhibitor concentrations in GraphPad Prism 5 software. One site Fit Ki and One site Fit log IC50 (software built-in) analysis were used to calculate IC50 and Ki values.
- Enzyme inhibition assay and Ki values determination To evaluate the potency of synthesized compounds against Mpro, the proteolytic activity of 50 nM Mpro -His and Mpro was first measured in the presence and absence of 25 µM compound using the fluorescent peptide Dabcyl-KTSAVLQSGFRKM-E(Edans)-NH2 (SEQ ID NO: 5) (GenScript Biotech NJ, USA) as the reporter substrate at a concentration of 15 µM. Compounds were incubated with Mpro for 20 min at room temperature in reaction buffer composed of 20 mM Tris-HCL, pH 7.3, 100 mM NaCl, 1 mM EDTA, 1 mM DTT and 0.02% Tween-20. Hydrolysis of the fluorescent peptide was monitored at an emission wavelength of 460 nm with excitation wavelength at 360 nm, using a TECAN M200 plate reader (TECAN, M nnedorf, Switzerland). Compounds that inhibited Mpro activity by less than 50% were considered inactive (Table 1).To determine the Ki values of active compounds, 25 nM Mpro was mixed with increasing concentrations of compounds (from 40 nM to 4000 nM with two-fold dilutions) and hydrolysis of 15 µM fluorescent peptide was monitored. Initial hydrolysis rates of fluorescent peptide were plotted as a function of compound concentrations and Ki values were obtained by fitting the data into the Morrison equation with standard error from triplicates.
- δ-Opioid Receptor Binding Assay δ-Opioid Receptor Binding Assay Procedures: δ-Opioid Receptor Binding Assay Procedures were conducted as follows. Radioligand dose-displacement assays used 0.3 nM [3H]-Naltrindole (Perkin Elmer, Shelton, Conn.; 33.0 Ci/mmole) with 5 μg membrane protein (Perkin Elmer, Shelton, Conn.) in a final volume of 500 μl binding buffer (5 mM MgCl2, 5% DMSO, 50 mM Trizma base, pH 7.4). Non-specific binding was determined in the presence of 25 μM unlabeled naloxone. All reactions were performed in 96-deep well polypropylene plates for 1 hour at a temperature of about 25° C. Binding reactions were terminated by rapid filtration onto 96-well Unifilter GF/C filter plates (Perkin Elmer, Shelton, Conn.) presoaked in 0.5% polyethylenimine (Sigma). Harvesting was performed using a 96-well tissue harvester (Perkin Elmer, Shelton, Conn.) followed by five filtration washes with 500 μl ice-cold binding buffer. Filter plates were subsequently dried at 50° C. for 1-2 hours. Fifty μl/well scintillation cocktail (Perkin Elmer, Shelton, Conn.) was added and plates are counted in a Packard Top-Count for 1 min/well.δ-Opioid Receptor Binding Data: In certain embodiments, Compounds of the Invention exhibit a Ki (nM) for δ receptors of about 10,000 or more (which, for the purposes of this invention, is interpreted as having no binding to the δ receptors). Certain Compounds of the Invention exhibit a Ki (nM) of about 20,000 or less for δ receptors. In one embodiment, Compounds of the Invention exhibit a Ki (nM) of about 10,000 or less; or of about 9000 or less for δ receptors. In another embodiment, Compounds of the Invention exhibit a Ki (nM) of about 7500 or less; or of about 6500 or less; or of about 5000 or less; or of about 3000 or less; or of about 2500 or less for δ receptors. In another embodiment, Compounds of the Invention exhibit a Ki (nM) of about 1000 or less; or of about 500 or less; or of about 350 or less; or of about 250 or less; or of about 100 or less; or of about 10 or less for δ receptors.
- Biological Activity Assay The measurements are carried out according to a protocol using two preparations of liposomes:The donor liposomes (A) contain a fluorescent sterol (DHE (dehydroergosterol));The acceptor liposomes (B) contain a fluorescent lipid (dansyl PE (1,2-dioleoyl-sn-glycero-3-phosphoethanolamine-N-(5-dimethylamino-1-naphthalenesulfonyl) (ammonium salt)) whose excitation spectrum covers the emission spectrum of DHE.Transport of DHE from liposomes A to liposomes B catalyzed by the ORD domain is accompanied by a FRET signal between DHE and Dansyl-PE. Based on this signal, the kinetics of transport can be measured in real time. This measurement of fluorescence is carried out on a microplate in a TECAN Infinite 1000 Pro instrument (temperature=37° C.). At the beginning, each measurement well contains liposomes B (130 μM), ORD domain (200 nM) and the test compound. At time t=5 min, liposomes A (130 μM) are added to start the exchange reaction. Each compound is tested in triplicate for final concentrations from 50 nM to 3 μM. The time constant (k) obtained for the kinetics in each case is then represented as a function of the concentration of the analog. From this representation, an inhibition constant is determined for each compound. The affinity constants Ki are classified as follows:Very strong affinity Ki<10 nMGood affinity Ki from 10 to 100 nMLow affinity Ki from 100 to 2000 nMThe compounds, other than the prodrugs, having a Ki<100 nM are regarded as active on OSBP.The lines U87-MG and A549 were obtained from the American Type Culture Collection (Rockville, MD, USA) and were cultured according to the supplier's instructions. The human glioblastoma cells U87-MG were cultured in Dulbecco minimum essential medium (DMEM) containing 10% of FCS and 1% of L-glutamine. The lung cancer cells A549 were cultured in RPMI1640 medium containing 10% of FCS and 1% of L-glutamine. The cell lines were maintained at 37° C. in a humidified atmosphere containing 5% CO2. The products were tested at 10 concentrations in triplicate and the cellular viability was evaluated after 72 h of treatment using the CellTiter Glo assay (Promega), which allows the number of live cells to be measured by luminescence (quantification of ATP).
- Selective Inhibition Assays of Isolated Na,K-ATPase To screen for isoform selectivity of the digoxin derivatives we compared inhibition of Na,K-ATPase activity of purified detergent-soluble human isoform complexes α1β1FXYD1, α2β1FXYD1, α2β2FXTD1 and α2β3FXYD1. Although all the preparations and assays were conducted with FXYD1 in order to stabilize the complexes, the FXYD1 suffix is omitted in naming of isoform complexes for simplicity.Na,K-ATPase activity of α/βPFXYD1 complexes was measured over one hour at 37° C. in a medium containing 130 mM NaCl, 5 mM KCl, 3 mM MgCl2, 1 mM EGTA, 25 mM Histidine, pH 7.4 and 1 mM ATP using the PiColor Lock gold malachite green assay (Inova Biosciences).The Na,K-ATPase activities were α1β1, 21.5±5.3 μmoles/min/mg; α2β1, 18.7±1.8 μmoles/min/mg, and α2β3, 10.7±1.9 μmoles/min/mg protein. As discussed below, an important kinetic property in relation to inhibition by cardiac glycosides is K0.5 for activation by K: α1β1-1.25±0.05 mM, α2β1-2.7±0.14 mM and α2β3 6.4±0.50 mM, respectively.Selectivity of the compounds for various isolated isoforms of human Na,K-ATPase was determined essentially as described before [Katz, A. et al., J Biol Chem., 2010, 285(25), pp. 19582-19592].ATPase activity assays as well as titrations with NaCl, KCl and vanadate were performed as described in Lifshitz-2007 and Loayza-1998 using PiColorLock malachite green assay (Inova Bioscience). Inhibitor assays were performed as described in Katz-2010. [3H]ouabain binding and K+-[3H]digoxin displacement assays were performed as described in Katz-2010.The percent inhibition VCG/V0 was calculated and Ki values were obtained by fitting the data to the function VCG/V0=Ki/([CG]+Ki)+c (CG stands for cardiac glycoside). Inhibition was estimated in 3-5 separate experiments and average Ki values±standard error of the mean (SEM) were calculated. The ratios Ki α1β1/α2β1, α1β1/α2β2 and α1β1/α2β3 was calculated for each compound.
- Binding Assay DDR1 and DDR2 binding assays were performed using Life Technologies LanthaScreen Europium Kinase Binding assay. The compounds were incubated with 5 nM DDR1 (Carna Biosciences) or 5 nM DDR2 (Life Technologies) for 1 hour at room temperature in white 384-well OptiPlate (PerkinElmer), containing 20 nM or 10 nM Kinase Tracer 178 respectively and 2 nM Europium labelled anti-GST antibody (Life Technologies) in assay buffer (50 mM HEPES pH 7.5, 10 mM MgCl2, 1 mM EGTA and 0.01% BRIJ35).The ratio of fluorescence emission 665 nm/615 nm after excitation at 340 nm was obtained using the Tecan Spark 20M plate reader. IC50 values were determined in GraphPad Prism 7.0 software, using 4 parameter model: log(inhibitor) vs. response. IC50 values were converted in Ki using the Cheng-Prusoff equation (Ki=IC50/(1+[Tracer]/Kd).
- Binding Assay DDR1 and DDR2 binding assays were performed using Life Technologies LanthaScreen™ Europium Kinase Binding assay. The compounds were incubated with 5 nM DDR1 (Carna Biosciences) or 5 nM DDR2 (Life Technologies) for 1 hour at rt in white 384-well OptiPlate (PerkinElmer), containing 20 nM or 10 nM Kinase Tracer 178 respectively and 2 nM Europium labelled anti-GST antibody (Life Technologies) in assay buffer (50 mM HEPES pH 7.5, 10 mM MgCI2, 1 mM EGTA and 0.01% BRIJ35). The ratio of fluorescence emission 665 nm/615 nm after excitation at 340 nm was obtained using the Tecan Spark 20M plate reader. IC50 values were determined in GraphPad Prism 7.0 software, using 4 parameter model: log(inhibitor) vs. response. IC50 values were converted in Ki using the Cheng-Prusoff equation (Ki=IC50/(1+[Tracer]/Kd).
- Radioligand Binding Assay (Ki) and cAMP Accumulation Assay (EC50) Radioligand binding studies were performed in buffer contains test compound, [3H]-GR113808, and receptor C6 glial cell membrane preparation. Nonspecific binding was determined with 10 uM GR113808. After incubation, the reaction was terminated by filtration through Whatman GF/B. Radioactivity was measured using a Beckman model LS6500C liquid scintillation counter. Binding data are expressed as a percentage of displacement for the screening of the library compounds. For selected compounds, Ki were analyzed by computer-assisted nonlinear regression analysis (Prism, Graphpad Software, San Diego, CA). EC50 values correspond to the concentration of agonists required to obtain half maximal stimulation of adenylyl cyclase. The maximum response produced by each molecule was normalized to the 5-HT induced. The data are the results of two or three independent determinations performed in triplicate.
- CA Activity Assay The method for determination of Ki values is described elsewhere [Landolfi et al., J. Pharmacol. Toxicol. Methods, 38:169-172; B lb l et al., J. Enzyme Inhib. Med. Chem., 18:371-375; Cift i et al., J. Enzyme Inhib. Med. Chem., 20:103-108; Hisar et al., J. Appl. Anim. Res., 30:185-188; Winum et al., Bioorg. Med. Chem. Lett., 15:3302-3306].
- Enzyme Activity Assay The method for determination of the Ki values is described elsewhere [Landolfi et al., J. Pharmacol. Toxicol. Methods, 38:169-172; B lb l et al., J. Enzyme Inhib. Med. Chem., 18:371-375; Ciftci et al., J. Enzyme Inhib. Med. Chem., 20:103-109; Hiscar et al., J. Appl. Anim. Res., 30:185-188; Winum et al., Bioorg. Med. Chem. Lett., 15:3302-3306].
- Fluorescence Polarization Assay Fluorescence polarization was measured on an Ultra plate reader at excitation and emission wavelengths of 485 and 530 nm, respectively. The equilibrium binding curves were drawn by plotting polarization units as a function of recombinant XIAP concentration. The Smac mimetics were evaluated for their ability to displace the fluorescent probe from recombinant protein. The Ki values were derived from IC50s according to Cheng-Prusoff equation.
- Fluorescence Polarization Assay Fluorescence polarization was measured on an Ultra plate reader at excitation and emission wavelengths of 485 and 530 nm, respectively. The equilibrium binding curves were drawn by plotting polarization units as a function of recombinant protein concentration. The Smac mimetics were evaluated for their ability to displace the fluorescent probe from the protein. The Ki values were derived from IC50s according to Cheng-Prusoff equation.
- Fluorescence Polarization Assay and FL5.12 Cellular Assay The binding affinities (Ki) of compounds were determined using fluorescence polarization assays (FPA) that measure their ability to competitively displace a Bad-derived peptide from Bcl-xL. Compound efficacy (EC50) in a cellular context was evaluated by testing their ability to reverse the protection from cytokine withdrawal afforded by overexpression of Bcl-xL in the IL-3 dependent murine pro-B cell line FL5.12.
- Fluorescence Resonance Energy Transfer Assay (FRET) The enzymatic reaction started by the addition fluorogenic peptide substrate, MAPKKide to the buffer containing LF and inhibitor compound. Cleavage of the substrate by LF released the fluorophore and full fluorescence was restored. Fluorescence intensity (Ex: 320 nm, Em: 420 nm) was monitored for 15 min at room temperature and the Ki values were calculated using the program BatchKi (BioKin Ltd., Pullman, WA).
- In Vitro Enzyme Inhibition Inhibition of WNV protease activity was measured using recombinant WNV protease, which first incubated with inhibitor in 96-well plates. Catalysis was initiated by adding the substrate. Cleavage of the pNA chromophore from substrate produced a color change monitored at 405 nm. Optical density was measured every 30 s for 10 min by a Spectromax 250 reader, and Ki values were determined by Graphpad Prism.
- Radioligand Labeled Binding Assay and cAMP Production IC50 values for each test compound were determined from nonlinear regression analysis of data collected from ligand binding experiments. The inhibition constant (Ki) was calculated from IC50 value by the Cheng and Prusoff equation. EC50/IC50 values were measured as either agonism of cAMP production or antagonism of 5-HT stimulated cAMP production in HeLa cells stably transfected with human 5-HT6 receptors.
- Time Resolved Fluorescence Resonance Energy Transfer Assay Lck activity was assessed using a TR-FRET assay in a 384-well plate format. The degree of phosphorylation of Biotinylated substrate was measured using a Packard Discovery plate reader as a ratio of specific 665 nm energy transfer signal to reference Eu 620 nm signal. All values quoted are means of IC50 results. Ki values were calculated from IC50s using Cheng-Prusoff equation.
- Binding Assay for γ2-Containing GABAA Subtypes Table 1: Radioligand binding assays were carried out in a volume of 200 uL (96-well plates) which contained 100 uL of cell membranes, [3H]Flumazenil at a concentration of 1 nM and the test compound in the range of [0.1 10+-3+-10] 10+-6 M. Nonspecific binding was defined by 10+-5 M Diazepam and typically represented less than 5% of the total binding. Assays were incubated to equilibrium for 1 hour at 4 C. and harvested onto GF/C uni-filters (Packard) by filtration using a Packard harvester and washing with ice-cold wash buffer (50 mM Tris; pH 7.5). After anhydrousing, filter-retained radioactivity was detected by liquid scintillation counting. Ki values were calculated using Excel-Fit (Microsoft) and are the means of two determinations.The compounds of the accompanying examples were tested in the above described assay, and the preferred compounds were found to possess large Ki value for displacement of [3H]Flumazenil from the alpha1beta3gamma 2 subtype of the human GABAA receptor of 100 nM or above. Most preferred are compounds with a Ki alpha1beta3gamma 2 (nM) >300. In a preferred embodiment the compounds of the invention are binding selectively for the gamma 1 subunit-containing GABAA receptors relative to gamma 2 subunit-containing GABAA receptors.
- Competitive Binding Assay Using Eu-NDP-a-MSH A competitive inhibition binding assay was performed employing Eu-NDP-α-MSH (PerkinElmer Life Sciences catalog No. AD0225) with determination by time-resolved fluorometry (TRF) of the lanthanide chelate. In comparison studies with [I125]-NDP-α-MSH, the same values, within experimental error ranges, were obtained for percent inhibition and Ki. Typically competition experiments to determine Ki values were conducted by incubating membrane homogenates prepared from HEK-293 cells that express recombinant hMC4-R with 9 different concentrations of test compounds of interest and 2 nM of Eu-NDP-α-MSH in a solution containing 25 mM HEPES buffer with 100 mM NaCl, 2 mM CaCl2, 2 mM MgCl2 and 0.3 mM 1,10-phenanthroline. After incubation for 90 minutes at 37° C., the reaction was stopped by filtration over AcroWell 96-well filter plates (Pall Life Sciences). The filter plates were washed 4 times with 200 uL of ice-cold phosphate-buffered saline. DELFIA Enhancement solution (PerkinElmer Life Sciences) was added to each well. The plates were incubated on a shaker for 15 minutes and read at 340 nm excitation and 615 nm emission wavelengths. Each assay was conducted in duplicate and mean values were utilized. Ki values were determined by curve-fitting with Graph-Pad Prism software using a one-site fixed-slope competition binding model.
- AR Transcriptional Activation Assay and MDA Whole-Cell Binding Assay The compounds were evaluated in a transcriptional activation assay with hAR in a mammalian cell background (CV-1) as the primary in vitro assay. Receptor binding assays for hAR were performed in a whole cell format using MDA-MB-453 cells. After correcting for nonspecific binding, IC50 values were determined. The IC50 value is defined as the concentration of competing ligand required to decrease specific binding by 50%. The IC50 value was determined with the aid of the log-logit (Hill) method, which linearized the concentration response curve. Linear regression was then used to determine the IC50 value. The Ki values were determined by the application of the Cheng-Prusoff equation: Ki=IC50/(1+[L]/Kd) where [L] is the concentration of labeled ligand and Kd is the dissociation constant of the labeled ligand determined in the saturation analysis.
- AR Transcriptional Activation Assay and MDA Whole-Cell Binding Assay The compounds were evaluated in a transcriptional activation assay with hAR in a mammalian cell background (CV-1) as the primary in vitro assay. Receptor binding assays for hAR were performed in a whole cell format using MDA-MB-453 cells. After correcting for nonspecific binding, IC50 values were determined. The IC50 value is defined as the concentration of competing ligand required to decrease specific binding by 50%. The IC50 value was determined with the aid of the log-logit (Hill) method, which linearized the concentration response curve. Linear regression was then used to determine the IC50 value. The Ki values were determined by the application of the Cheng-Prusoff equation: Ki=IC50/(1+[L]/Kd] where [L] is the concentration of labeled ligand and Kd is the dissociation constant of the labeled ligand determined in the saturation analysis.
- Competitive Ligand Binding Assay, GR-Mediated Antagonist Activity Assay, and IL-6 Repression Assay Competitive Ligand Binding Assay- The Ki values were determined by the application of the Cheng-Prusoff equation: Ki=IC50/(1+[L]/Kd) where [L] is the concentration of labeled ligand and Kd is the dissociation constant of the labeled ligand determined in the saturation analysis. GR-Mediated Antagonist Activity Assay- GR-mediated antagonist activity is measured in the presence of a concentration of dexamethasone empirically determined to give half-maximal response. The antagonist activity of compounds, their activity in inhibiting dexamethasone response to basal level, is reported as % absolute efficacy. Potencies of compounds are reported as the concentration at which they reach half their antagonist (IC50) activity. IL-6 Repression Assay- The GR-mediated repression of IL-6 production in a human fibroblast (NHDFneo) cell line is measured with a modified ELISA assay.
- Human Serotonin Transporter (SERT, SLC6A4) Functional Antagonist Uptake Assay Benzofuran derivatives were evaluated for inhibiting the human 5-HT transporter (hSERT) as expressed in CHO cells using an antagonist radioligand assay (Tatsumi, M. et al. (1999), Eur. J. Pharmacol., 368: 277-283). Compound binding was calculated as a percent inhibition of the binding of 2 nM [3H]imipramine using a scintillation method and inhibition constants (Ki) were calculated using the Cheng Prusoff equation. Test compounds were assayed in three trials at 300, 94.868, 30, 9.4868, 0.3, and 0.94868 μM.[2927]All tested compounds showed inhibition of hSERT at the tested concentrations. However, in two cases (the enantiomers of 5-MBPB), the lowest concentration of 0.94868 μM was too high to accurately estimate IC50 values and Ki values. For S-(+)-5-MBPB the IC50 appeared close to 0.094868 μM, while for R-(−)-5-MBPB the IC50 appeared close to 0.94868 μM.
- In Vitro Radioligand Binding Assay The competition binding assay was conducted using monoclonal mouse MOR expressed in Chinese hamster ovary (CHO) cell lines. In this assay, 30 μg of membrane protein was incubated with the radioligand [3H] naloxone in the presence of different concentrations of tested compounds in TME buffer (50 mM Tris, 3 mM MgCl2, and 0.2 mM EGTA, pH 7.4) for 1.5 h at 30° C. The bound radioligand was separated by filtration using a Brandel harvester. Specific (i.e., opioid receptor-related) binding to the MOR was determined as the difference in binding obtained in the absence and presence of 5 μM of DAMGO. The IC50 values were determined and converted to Ki values using the Cheng-Prusoff equation: Ki=IC50/[1+([L*]/KD)], where [L*] is the concentration of the radioligand and KD is the KD of the radioligand was determined.
- Radioligand Binding Assay (Ki) and Inhibition of Substrate Uptake (EC50/IC50) Binding affinity of each compound was measured by assessing the potency of inhibition of binding of radiolabeled RTI-55. Membranes were preincubated with compound before the addition of [125I]RTI-55. The reaction was terminated by filtration through Whatman GF/C filters using a 96-well Tomtech cell harvester (Tomtech, Orange, CT). Scintillation fluid was added to each filter spot and radioactivity remaining on the filter was determined using a Wallace beta-plate reader. IC50 values were converted to Ki values using the Cheng-Prusoff equation. Specific binding was defined as the difference in binding observed in the presence and absence of 5 uM mazindol (HEK-hDAT and -NET) or 5 uM imipramine (HEK-hSERT). EC50/IC50 values were obtained from inhibition of the reuptake of [3H] dopamine for DAT, [3H] serotonin for SERT, or [3H] norepinephrine for NET.
- Enzyme Inhibition Assay Inhibitors were assayed against purified hMMP-1, hMMP-2, hMMP-3, hMMP-8, hMMP-9, and hMMP-13 using an enzyme assay based on cleavage of the quenched fluorogenic peptide substrate. The increase in fluorescence due to cleavage of the substrate was measured with a fluorescence microplate reader. The Ki values were calculated by nonlinear regression analysis using the percent inhibition, and Km values of the substrates for each MMP.
- Enzyme Inhibition Assay Progress curves were obtained by initiation of urease reaction with addition of purified enzyme into assay mixtures containing increasing concentrations of inhibitors and urea, which are in the range of 2 to 100 mM. Each assay was run in triplicate. Ki values were dertermined from Lineweaver-Burk plots after testing at least 5 inhibitor concentrations. IC50 values were obtained from measurements performed in the presence of saturating urea concentration 100 mM.
- Enzyme Inhibition Assay Stromelysin inhibitory activity is based on the hydrolysis of substance P by recombinant human stromelysin to generate a fragment, substance P 7-11, which can be quantitated by HPLC. The IC50 is calculated from control reaction without the inhibitor. The mean IC50 was obtained from two independent measurements, and the standard deviation of the mean was less than 10%. The mean Ki values reported have been derived from the mean IC50.
- Fluorogenic Assay for Detection of FASTE Inhibition The reaction mixture consisted of FAS thioesterase domain (FASTE) in buffer, which was preincubated with test compounds for 30 min. The reaction was initiated by addition of substrate 4-MUH. The resulting fluorescence from liberated 4-methylumbelliferone was measured every 5 min to generate concentration-response curves from which IC50 values were determined. The inhibition constants (Ki) were calculated using the equation of Cheng and Prusoff.
- IMPDH Type 1 Enzyme Assay Inhibition assays were performed in duplicate using two different concentrations of human IMPDH type 1 (87 and 155 nM) and varying concentrations of inhibitor. The production of NADH was monitored by following changes in absorbance at 340 nm on a Hitachi U-2000 spectrophotometer. Steady-state velocities were used to determine Ki(app) values by fitting the velocities vs inhibitor concentration to a simple binding model with Dynafit.
- IMPDH Type 2 Enzyme Assay Inhibition assays were performed in duplicate using two different concentrations of human IMPDH type 2 (33 and 66 nM) and varying concentrations of inhibitor. The production of NADH was monitored by following changes in absorbance at 340 nm on a Hitachi U-2000 spectrophotometer. Steady-state velocities were used to determine Ki(app) values by fitting the velocities vs inhibitor concentration to a simple binding model with Dynafit.
- In Vitro Enzyme Assay The proteolytic cleavage of N-acyl aminocoumarins by cathepsins was conducted in Dynatech Microfluor fluorescence 96-well microtiter plates, and readings were taken on a Molecular Devices Spectra Max Gemini XS instrument. The excitation wavelength was 355 nm and the emission wavelength was 450 nm for peptidyl-AMC substrates. Generation of AMC was monitored over 5 min. The dissociation constants (Ki) were calculated by the method of Dixon.
- Inhibitor Assay For inhibitor assays, IC50 was determined, in the presence of 1 mM NAD and 4 mM ATP (for LmNADK1) or 2 mM ATP (for SaNADK). Dixon plots were used to determine KI in the presence of 4 mM ATP (for LmNADK11) or 2 mM ATP (for Sa NADK) and three NAD concentrations (0.2, 0.5 and 1 mM). It was also checked that the inhibitors had no effect on the coupling enzyme activity.
- Neuraminidase Inhibition Assay A fluorogenic assay was used to measure influenza virus neuraminidase activity. The substrate, 4-methylumbelliferyl-N-acetylneuraminic acid, is cleaved by neuraminidase to yield a fluorescent product that can be quantified. Fluorescence measurements were obtained using a fluorescence plate reader with excitation and emission filters of 355 +/- 35 nm and 460 +/- 25 nm. The Ki values were calculated by nonlinear regression curve fitting of the velocity data using Kaleidagraph software.
- PLK Kinase Assay Kinase was assayed in 384-well polypropylene plate format. The compound was mixed with kinase and biotinylated peptide substrate and incubated. After reaction, mixture was transferred to 384-well streptavidin-coated plates. Incorporated radioactivity was counted on a TopCount scintillation plate reader. IC50 values were determined using an 11-point, 3-fold dilution series. To normalize affinity data, IC50 values were converted to apparent Ki assuming a Cheng-Prusoff relationship.
- Phosphodiesterase (PDE) Inhibition Assay Phosphodiesterase activities were assayed in the presence of inhibitor compounds. Measurement takes advantage of the selective binding of 5-AMP or 5-GMP (and not cAMP or cGMP) to yttrium silicate beads with embedded scintillant. Hydrolysis is quantified by reading in a scintillation counter (Trilux, Wallac). The cAMP and cGMP concentrations used were far below the Km of PDE. Thus, the IC50s obtained are good approximation of Ki.
- Radioligand Binding Assay Membrane homogenates were incubated at room temperature with a sub-Kd concentration of radioligand in the absence or presence of seven different concentrations of unlabeled ligand. Data were fit by nonlinear regression to a one-site competition curve. IC50 is the concentration of unlabeled ligand that inhibits 50% of [3H]ligand binding (Prism, GraphPad Software). Equilibrium dissociation constant values for the unlabeled ligand (Ki) were calculated using the Cheng-Prusoff-Chou equation.
- Receptor Binding Assay Receptor binding is determined for the Compound of Example 1, using the compound of Formula A as a control. The following literature procedures are used, each of which reference is incorporated herein by reference in their entireties: 5-HT2A. Ki=IC50(1+L/KD)where L=concentration of radioligand in the assay, and KD=affinity of the radioligand for the receptor. A Scatchard plot is used to determine the KD.
- Thymidylate Synthase (TS) Assay TS was assayed spectrophotometrically in the reaction buffer solution containing (6R, 6S)-5, 10-CH2H4folate. The reaction was initiated by the addition of an amount of enzyme yielding a change in absorbance at 340 nm of 0.016/min in the absence of inhibitor. Ki values were obtained from the linear least-squares fit of the residual activity as a function of inhibitor concentration, using suitable equations for competitive inhibition.
- competition displacement assays Compound binding to CB1R was assessed in competition displacement assays using [3H]CP-55,940 as the radioligand and crude membranes from mouse brain. See Tam, J., Vemuri, V. K., Liu, J., Batkai, S., Mukhopadhyay, B., Godlewski, G., Osei-Hyiaman, D., Ohnuma, S., Ambudkar, S. V., Pickel, J., et al., J. Clin. Invest. 2010, 120, 2953-2966. All data were in triplicates with Ki values determined from three independent experiments.
- Ki Determination for Genotypes 1b and 3a NS3 Protease Purified NS3 protease domain (amino acids 1-181) of the genotype 1b and 3a virus were generated as above. The internally quenched fluorogenic depsipeptide substrate Ac-DED(Edans)-EEAbuΨ[COO]ASK(Dabcyl)-NH2 and a synthetic peptide containing the hydrophobic core residues of the NS4A protein cofactor (KKGSVVIVGRIILSGRKK; NS4A peptide) were obtained from Anaspec, Inc. (San Jose, Calif.). Other chemicals and biochemicals were of reagent grade or better and were purchased from standard suppliers.Reactions were run at room temperature in buffer consisting of 50 mM HEPES, 40% glycerol, 0.05% Triton X-100, 10 mM DTT, and 10% DMSO. The final assay solutions contained 50 pM NS3 genotype 1 b protease or 200 pM genotype 3a protease, 20 μM NS4A peptide, and 4 μM substrate (genotype 1b) or 2 μM substrate (genotype 3a). Inhibitor concentrations varied from 100 nM to 5 pM in 3-fold dilutions, and no-inhibitor controls were included.Compound dilutions were made in DMSO at 20× final concentration. Reaction mixtures were prepared in 96-well assay plates. A solution of enzyme and NS4A peptide in assay buffer (25 μL volume with both reagents at 4× final concentration) was mixed with 45 μL assay buffer and 5 μL of either inhibitor or DMSO, and pre-incubated at room temperature for 1 hour. The reaction was started by addition of 25 μL substrate solution at 4× final concentration. Plates were mixed vigorously for 5-10 seconds and reactions were allowed to proceed for 90 minutes, fluorescence was measured every 30 s between 90 and 120 minutes reaction time using a Tecan InfiniTe M1000 or PerkinElmer Envision multimode plate reader with an excitation wavelength of 340 nm and an emission wavelength of 490 nm.Rates were calculated from the progress curves at steady state, in the time frame of 90-120 minutes after addition of substrate. To determine the Ki, rates were plotted as a function of inhibitor concentration, and the data were fit with equation 1 (Morrison, J. F., Biochimica et Biophysica Acta 1969, 185, 269-286) to calculate Ki app using GraphPad Prism 5. Active fraction of enzyme was determined by active site titration with known potent inhibitors. Ki was calculated from Ki app/(1+[[S]/Km]).
- 5-HT6 Binding Assay Radioligand binding assays were performed using membranes from HEK-293 transfected with human 5-HT6 receptor. In these membranes the receptor concentration is 2.18 pmol/mg proteins and the protein concentration is 9.17 mg/mL. The incubation was initiated by addition of membrane to reaction buffer contained radioligand in the presence of test compound. And the incubation time was 60 min at 37 deg C. After incubation, the membranes were collected onto polyethylenimine-pretreated glass fiber filters. Radioactivity was determined by scintillation counting. Nonspecific binding was determined with 100 uM serotonin. Competition binding data were analyzed by using the LIGAND program, and assays were performed in triplicate determinations for each point. A linear regression line of data points is plotted, from which the concentration of competing ligand which displaces 50% of the specific binding of the radioligand (IC50 value) is determined and the Ki value is determined based upon the Cheng-Prusof equation. Ki was calculated when inhibition at 100 nM > 70%.
- A2a Ki assay Binding affinities of compounds of the invention for the human A2a receptor were determined in a competition binding assay using Scintillation Proximity technology. Thus, 1* μg, or preferably 0.25 μg of membranes from HEK293 cells expressing the human A2a receptor were incubated with a compound of the invention at concentrations ranging from 3000 nM to 0.15 nM in a reaction mixture containing also 0.5 nM of a tritiated form of 5-amino-7-[2-phenethyl]-2-(furan-2-yl)-7H-pyrazolo[4,3-e][1,2,4]triazolo[1,5-c]pyrimidine (the tritiated compound) and 25 μg of wheat germ agglutin-coated yttrium silicate SPA beads for one hour at room temperature with agitation. The beads were then allowed to settle to the bottom of the wells for 1 hr, after which the membrane-associated radioactivity was determined by scintillation counting in a TopCount microplate reader. Ki values were determined using the Cheng-Prusoff equation.
- Binding Assay Cell membrane proteins (Perkin Elmer) wherein human muscarinic M3 receptor was overexpressed, [3H]-methyl scopolamine and test compounds in various concentration were cultured in 0.2 ml of Tris-HCl buffer at 25° C. for 120 minutes. The same was filtered under suction through glass fiber filter (Whatman GF/B), and then the filter was washed 5 times with 1 ml of Tris-HCl buffer. The radioactivity of [3H]-methyl scopolamine adsorbed on the filter was measured by a liquid scintillation counter. Non-specific binding was evaluated under existence of 5 μM of atropine. Affinity of the compound of the present invention to muscarinic M3 receptor was calculated as the dissociation constant (Ki), which can be calculated from concentration (IC50) of test compounds inhibiting 50% of binding of [3H]-methyl scopolamine (i.e. labeled ligand) according to Cheng and Prusoff [Cheng and Prusoff, Biochem. Pharmacol., 22, 3099, 1973]. In following Table, compounds having stronger binding affinity to human muscarinic M3 receptor have lower dissociation constant (Ki).
- Cannabinoid Receptor Binding Assay Membranes from HEK-293 cells transfected with the human recombinant CB1 receptor(Bmax=2.5pmol/mg protein) and human recombinant CB2 receptor (B max=4.7 pmol/mgprotein) were incubated with [3H]-CP-55,940 (0.14 nM / Kd = 0.18 nM and 0.084nM / Kd =0.31 nM respectively for CB1 and CB2 receptor) as the high affinity ligand and displaced with 10 μM WIN 55212-2 as the heterologous competitor for non specific binding (Ki values 9.2 nM and 2.1 nM respectively for CB1 and CB2 receptor). All compounds were tested following the procedure described by the manufacturer (Perkin Elmer, Italy). Displacement curves were generated by incubating drugs with [3H]-CP-55,940 for 90 minutes at 30 C. Ki values were calculated by applying the Cheng-Prusoff equation to the IC50 values (obtained by GraghPad) for the displacement of the bound radioligand by increasing concentrations of the testcompound. Data are means±SEM of at least n=3 experiments.
- Determination of the Ki for Plasma Kallikrein Plasma kallikrein inhibitory activity in vitro was determined using standard published methods (e.g. Johansen et al., Int. J. Tiss. Reac. 1986, 8, 185; Shori et al., Biochem. Pharmacol., 1992, 43, 1209; Sturzebecher et al., Biol. Chem. Hoppe-Seyler, 1992, 373, 1025). Human plasma kallikrein (Protogen) was incubated at 25° C. with 10 concentrations of the test compound and 8 concentrations of the fluorogenic substrate H-DPro-Phe-Arg-AFC spanning a range of at least ×Km to 5×Km. Residual enzyme activity (initial rate of reaction) was determined by measuring the change in fluorescence at 410 nm. The Ki value for the test compound was determined using the mixed-model inhibition equation (based on Equation 3.2 in: RA Copeland, Evaluation of Enzyme Inhibitors in Drug Discovery, Wiley 2005) in GraphPad Prism. The mixed model equation includes competitive, uncompetitive and noncompetitive inhibition as special cases and the parameter of Alpha to indicate mechanism of inhibition.
- Enzymatic Assay HDAC8 reagents: HDAC8 was purchased from Enzo Life Sciences [catalog #BML-SE145]. Assays were performed with buffer containing 20 mM HEPES, pH 8.0 [Boston BioProducts, catalog #BB-104, 1M stock], 100 mM NaCl [Sigma, catalog #S5150, 5M stock], 20 mM KCl [BioChemika, catalog #87526, 4M stock], 1 mM MgCl2 [Fluka, catalog #63020, 1M stock], 0.05% BSA (Fraction V) [Invitrogen, catalog #15260, 7.5% stock], and 0.1% n-Octyl-β-D-glucopyranoside (N-OG) [Anatrace, catalog #O311, 10% stock]. The HDAC8 enzyme was run at the final concentration of 1.333 nM. Fluor-de-Lys substrate [BioMol Research Laboratories, catalog #KI-178], used to evaluate enzyme activity, was added at the final concentration of 200 uM. To enable detection of the signal, Developer II [BioMol Research Laboratories, catalog #KI-176] was added at a 1:200 dilution to the stop solution, which also included 20 uM SAHA [Sigma, catalog #SML0061] to ensure complete termination of the reaction.
- Hemoglobin Capture Assay The assay was performed at 37 °C in HEPES buffer (100 mM, with 10% glycerol, pH 7.4) in the presence of 10 uM L-arginine. Also included were 100 uM NADPH, 0.83 mM CaCl2, approximately 320 units/mL calmodulin, 10 uM tetrahydrobiopterin, andhuman oxyhemoglobin (3 uM). This assay was performed in 96-well plates using a Biotek Gen5 microplate reader. NO production was read by monitoring the absorbance at 401 nm (resulting from the conversion of oxyhemoglobin to methemoglobin). Kinetic readouts were recorded for 6 min. Each compound was assayed in at least duplicate, and seven to nine concentrations (from 50 nM to 200 uM) were used to construct dose-response curves. IC50 values were calculated by nonlinear regression using GraphPad Prism, and Ki values were obtained using the Cheng-Prusoff equation [Ki = IC50/(1 + [S]/Km)] with the following Km values: 1.3 uM for rat nNOS, 1.7 uM for the rat nNOS D597N mutant, and 1.9 uM for the rat nNOS.
- Inhibition Assay To determine the inhibition constants (Ki) of Examples 1-240, compounds were diluted serially in DMSO and added to 50 μL kinase reactions containing 1.5 nM JAK1, 0.2 nM purified JAK2 or 1 nM purified TYK2 enzyme, 100 mM Hepes pH7.2, 0.015% Brij-35, 1.5 μM peptide substrate, 25 μM ATP, 10 mM MgCl2, 4 mM DTT at a final DMSO concentration of 2%. Reactions were incubated at 22° C. in 384-well polypropylene microtiter plates for 30 minutes and then stopped by addition of 25 μL of an EDTA containing solution (100 mM Hepes pH 7.2, 0.015% Brij-35, 150 mM EDTA), resulting in a final EDTA concentration of 50 mM. Ki values were then determined using the Morrison tight binding model. Morrison, J. F., Biochim. Biophys. Acta. 185:269-296 (1969); William, J. W. and Morrison, J. F., Meth. Enzymol., 63:437-467 (1979).
- Inhibition Kinetics Assay Full length porcine calpain (156 nM), or papain (236 pM) was added to a solution of 100 mM NaCl, 50 mM HEPES, pH 7.6, 1 mM TCEP, 30 μM Suc-LLVY-AMC (SEQ ID NO: 8) substrate, and inhibitor (0.5 to 50 μM). Calpain reactions also contained CaCl2 (1 mM and 100 mM for porcine and rat respectively). Both substrate and inhibitors were dissolved in acetonitrile/DMSO (1:1) with the exception of E-64, dissolved in water. Organic solvent remained <2% in all reactions, and most often <1%. Reactions were carried out in microtiter 96-well plates, with 150 μL per well, 30° C., and product formation was monitored over time by fluorescence (Ex/Em 346/444 nm, with 420 nm cutoff filter). Kinetic values of kobs were determined via non-linear regression using one-phase association analysis and linear plots of 1/kobs vs. 1/[I] provided kinetic constants ki and KI.
- JAK1 and TYK2 Inhibition Assay To determine inhibition constants (Ki), compounds were diluted serially in DMSO and added to 50 uL kinase reactions containing 1.5 nM JAK1, 0.2 nM purified JAK2 or 1 nM purified TYK2 enzyme, 100 mM Hepes pH7.2, 0.015% Brij-35, 1.5 uM peptide substrate, 25 uM ATP, 10 mM MgCl2, 4 mM DTT at a final DMSO concentration of 2%. Reactions were incubated at 22 ° C. in 384-well polypropylene microtiter plates for 30 minutes and then stopped by addition of 25 uL of an EDTA containing solution (100 mM Hepes pH 7.2, 0.015% Brij-35, 150 mM EDTA), resulting in a final EDTA concentration of 50 mM. After termination of the kinase reaction, the proportion of phosphorylated product was determined as a fraction of total peptide substrate using the Caliper LabChip 3000 according to the manufacturer's specifications. Ki values were then determined using the Morrison tight binding model (Morrison, J. F., Biochim. Biophys. Acta. 185:269-296 (1969).
- Late-stage radioligand binding dose response assay to identify inhibitors of NADPH oxidase 1 (NOX1): PDSP screen Ki Set 2 Data Source (MLPCN Center Name): The Scripps Research Institute Molecular Screening Center (SRIMSC) Center Affiliation: The Scripps Research Institute, TSRI Assay Provider: Gary Bokoch, TSRI Network: Molecular Libraries Probe Production Center Network (MLPCN) Grant Proposal Number: 1 R03 MH083264-01A1 Grant Proposal PI: Gary Bokoch, TSRI External Assay ID: NOX1_INH_RAD_96_Ki_PDSP SCREEN_SET 2 Name: Late-stage radioligand binding dose response assay to identify inhibitors of NADPH oxidase 1 (NOX1): PDSP screen Ki Set 2. Description: Host defense mechanisms are diverse and include receptor-initiated signaling pathways, antibody and cytokine production, and the generation of reactive oxygen species (ROS) such as hydroxyl radical and hypochlorus acid to kill microorganisms (1). In activated phagocytic cells, the membrane integrated protein gp91phox serves as the catalytic cytochrome b subunit of the respiratory burst oxidase used to generate superoxide in an NADPH-dependent manner for
- Protease Inhibition Assay HIV-1 protease was purified and refolded from E. coli inclusion bodies. The substrate used spans the p17-p24 processing site (R-V-S-Q-N-Y-P-I-V-Q-N-K) and was derivatized with biotin and fluorescein isothiocyanate (FITC) at the amino and carboxy termini. In the presence of HIV-l protease, the substrate is rapidly cleaved into two parts. The biotinylated amino terminal fragment binds to the avidin beads while the FITC-containing carboxy1 terminal fragment is removed through the membrane. In the presence of an HIV-l protease inhibitor, the substrate does not cleave and the intact peptide binds to the beads. The bound fluorescence is obtained by processing on an IDEXX Screen Machine. Determination of Ki values with this assay requires analysis under conditions in which substrate concentration resides substantially below Km and the inhibitor concentrations greatly exceeds the Ki value and the enzyme concentration.
- CDK4/Cyclin D1 Mobility Shift Assay The purpose CDK4/Cyclin D1 assay is to evaluate the inhibition (% inhibition, Kiapp and Ki values) in the presence of small molecule inhibitors by using a fluorescence based microfluidic mobility shift assay. CDK4/Cyclin D3 catalyses the production of ADP from ATP that accompanies the phosphoryl transfer to the substrate peptide 5-FAM-Dyrktide (5-FAM-RRRFRPASPLRGPPK) (SEQ ID NO:2). The mobility shift assay electrophoretically separates the fluorescently labelled peptides (substrate and phosphorylated product) following the kinase reaction. Both substrate and product are measured and the ratio of these values is used to generate % conversion of substrate to product by the LabChip EZ Reader. Typical reaction solutions contained 2% DMSO (± inhibitor), 10 mM MgCl2, 1 mM DTT, 3.5 mM ATP, 0.005% TW-20, 3 µM 5-FAM-Dyrktide, 3 nM (active sites) activated CDK4/Cyclin D1 in 40 mM HEPES buffer at pH 7.5. Inhibitor Ki determinations for activated CDK4/Cyclin D1 (2007 E1/2008 +PO4) were initiated with the addition of ATP (50 µL final reaction volume), following an eighteen minute pre-incubation of enzyme and inhibitor at 22° C. in the reaction mix. The reaction was stopped after 195 minutes by the addition of 50 µL of 30 mM EDTA. Ki determinations were made from a plot of the fractional velocity as a function of inhibitor concentration fit to the Morrison equation with the enzyme concentration as a variable.
- CDK4/Cyclin D1 Mobility Shift Assay The purpose CDK4/Cyclin D1 assay is to evaluate the inhibition (% inhibition, Kiapp and Ki values) in the presence of small molecule inhibitors by using a fluorescence based microfluidic mobility shift assay. CDK4/Cyclin D3 catalyses the production of ADP from ATP that accompanies the phosphoryl transfer to the substrate peptide 5-FAM-Dyrktide (5-FAM-RRRFRPASPLRGPPK) (SEQ ID NO:3). The mobility shift assay electrophoretically separates the fluorescently labelled peptides (substrate and phosphorylated product) following the kinase reaction. Both substrate and product are measured and the ratio of these values is used to generate % conversion of substrate to product by the LabChip EZ Reader. Typical reaction solutions contained 2% DMSO (±inhibitor), 10 mM MgCl2, 1 mM DTT, 3.5 mM ATP, 0.005% TW-20, 3 μM 5-FAM-Dyrktide, 3 nM (active sites) activated CDK4/Cyclin D1 in 40 mM HEPES buffer at pH 7.5.Inhibitor Ki determinations for activated CDK4/Cyclin D1 (2007 E1/2008 +PO4) were initiated with the addition of ATP (50 μL final reaction volume), following an eighteen minute pre-incubation of enzyme and inhibitor at 22° C. in the reaction mix. The reaction was stopped after 195 minutes by the addition of 50 μL of 30 mM EDTA. Ki determinations were made from a plot of the fractional velocity as a function of inhibitor concentration fit to the Morrison equation with the enzyme concentration as a variable.
- CDK4/Cyclin D3 Mobility Shift Assay The purpose CDK4/Cyclin D3 assay is to evaluate the inhibition (% inhibition, Kiapp and Ki values) in the presence of small molecule inhibitors by using a fluorescence based microfluidic mobility shift assay. CDK4/Cyclin D3 catalyzes the production of ADP from ATP that accompanies the phosphoryl transfer to the substrate peptide 5-FAM-Dyrktide (5-FAM-RRRFRPASPLRGPPK) (SEQ ID NO:2). The mobility shift assay electrophoretically separates the fluorescently labeled peptides (substrate and phosphorylated product) following the kinase reaction. Both substrate and product are measured and the ratio of these values is used to generate % Conversion of substrate to product by the LabChip EZ Reader. Typical reaction solutions contained 2% DMSO (± inhibitor), 10 mM MgCl2, 1 mM DTT, 2 mM ATP, 0.005% TW-20, 3 μM 5-FAM-Dyrktide, 2 nM (active sites) CDK4/Cyclin D3 in 40 mM HEPES buffer at pH 7.5.Inhibitor Ki determinations for non-phosphorylated CDK4/Cyclin D3 (LJIC-2007/2010) were initiated with the addition of ATP (50 μL final reaction volume), following a twelve minute pre-incubation of enzyme and inhibitor at 22° C. in the reaction mix. The reaction was stopped after 35 minutes by the addition of 50 μL of 25 mM EDTA. Ki determinations were made from a plot of the fractional velocity as a function of inhibitor concentration fit to the Morrison equation with the enzyme concentration as a variable.
- CDK4/Cyclin D3 Mobility Shift Assay The purpose CDK4/Cyclin D3 assay is to evaluate the inhibition (% inhibition, Kiapp and Ki values) in the presence of small molecule inhibitors by using a fluorescence based microfluidic mobility shift assay. CDK4/Cyclin D3 catalyzes the production of ADP from ATP that accompanies the phosphoryl transfer to the substrate peptide 5-FAM-Dyrktide (5-FAM-RRRFRPASPLRGPPK) (SEQ ID NO:2). The mobility shift assay electrophoretically separates the fluorescently labeled peptides (substrate and phosphorylated product) following the kinase reaction. Both substrate and product are measured and the ratio of these values is used to generate % Conversion of substrate to product by the LabChip EZ Reader. Typical reaction solutions contained 2% DMSO (±inhibitor), 10 mM MgCl2, 1 mM DTT, 2 mM ATP, 0.005% TW-20, 3 μM 5-FAM-Dyrktide, 2 nM (active sites) CDK4/Cyclin D3 in 40 mM HEPES buffer at pH 7.5.Inhibitor Ki determinations for non-phosphorylated CDK4/Cyclin D3 (LJIC-2007/2010) were initiated with the addition of ATP (50 μL final reaction volume), following a twelve minute pre-incubation of enzyme and inhibitor at 22° C. in the reaction mix. The reaction was stopped after 35 minutes by the addition of 50 μL of 25 mM EDTA. Ki determinations were made from a plot of the fractional velocity as a function of inhibitor concentration fit to the Morrison equation with the enzyme concentration as a variable.
- CDK6/Cyclin D1 Mobility Shift Assay The purpose of the CDK6/Cyclin D1 assay is to evaluate the inhibition (% inhibition, Kiapp and Ki values) in the presence of small molecule inhibitors by using a fluorescence based microfluidic mobility shift assay. CDK6/Cyclin D1 catalyzes the production of ADP from ATP that accompanies the phosphoryl transfer to the substrate peptide 5-FAM-Dyrktide (5-FAM-RRRFRPASPLRGPPK) (SEQ ID NO:2). The mobility shift assay electrophoretically separates the fluorescently labeled peptides (substrate and phosphorylated product) following the kinase reaction. Both substrate and product are measured and the ratio of these values is used to generate % conversion of substrate to product by the LabChip EZ Reader. Typical reaction solutions contained 2% DMSO (± inhibitor), 10 mM MgCl2, 1 mM DTT, 2 mM ATP, 0.005% Tween 20 (TW-20), 3 μM 5-FAM-Dyrktide, 3 nM (active sites) CDK6/Cyclin D1 in 40 mM HEPES buffer at pH 7.5.Inhibitor Ki determinations for non-phosphorylated CDK6/CyclinD1 (LJIC-2003A2/1865) were initiated with the addition of ATP (50 μL final reaction volume), following a twelve minute pre-incubation of enzyme and inhibitor at 22° C. in the reaction mix. The reaction was stopped after 35 minutes by the addition of 50 μL of 25 mM EDTA. Ki determinations were made from a plot of the fractional velocity as a function of inhibitor concentration fit to the Morrison equation with the enzyme concentration as a variable.
- CDK6/Cyclin D1 Mobility Shift Assay The purpose of the CDK6/Cyclin D1 assay is to evaluate the inhibition (% inhibition, Kiapp and Ki values) in the presence of small molecule inhibitors by using a fluorescence based microfluidic mobility shift assay. CDK6/Cyclin D1 catalyzes the production of ADP from ATP that accompanies the phosphoryl transfer to the substrate peptide 5-FAM-Dyrktide (5-FAM-RRRFRPASPLRGPPK) (SEQ ID NO:2). The mobility shift assay electrophoretically separates the fluorescently labeled peptides (substrate and phosphorylated product) following the kinase reaction. Both substrate and product are measured and the ratio of these values is used to generate % conversion of substrate to product by the LabChip EZ Reader. Typical reaction solutions contained 2% DMSO (±inhibitor), 10 mM MgCl2, 1 mM DTT, 2 mM ATP, 0.005% Tween 20 (TW-20), 3 μM 5-FAM-Dyrktide, 3 nM (active sites) CDK6/Cyclin D1 in 40 mM HEPES buffer at pH 7.5.Inhibitor Ki determinations for non-phosphorylated CDK6/CyclinD1 (LJIC-2003A2/1865) were initiated with the addition of ATP (50 μL final reaction volume), following a twelve minute pre-incubation of enzyme and inhibitor at 22° C. in the reaction mix. The reaction was stopped after 35 minutes by the addition of 50 μL of 25 mM EDTA. Ki determinations were made from a plot of the fractional velocity as a function of inhibitor concentration fit to the Morrison equation with the enzyme concentration as a variable.
- CDK6/Cyclin D3 Mobility Shift Assay The purpose of the CDK6/Cyclin D3 assay is to evaluate the inhibition (% inhibition, Kiapp and Ki values) in the presence of small molecule inhibitors by using a fluorescence based microfluidic mobility shift assay. CDK6/Cyclin D3 catalyses the production of ADP from ATP that accompanies the phosphoryl transfer to the substrate peptide 5-FAM-Dyrktide (5-FAM-RRRFRPASPLRGPPK) (SEQ ID NO:2). The mobility shift assay electrophoretically separates the fluorescently labelled peptides (substrate and phosphorylated product) following the kinase reaction. Both substrate and product are measured and the ratio of these values is used to generate % conversion of substrate to product by the LabChip EZ Reader. Typical reaction solutions contained 2% DMSO (± inhibitor), 2% glycerol, 10 mM MgCl2, 1 mM DTT, 3.5 mM ATP, 0.005% Tween 20 (TW-20), 3 µM 5-FAM-Dyrktide, 4 nM (active sites) activated CDK6/Cyclin D3 in 40 mM HEPES buffer at pH 7.5. Inhibitor Ki determinations for activated CDK6/Cyclin D3 (LJIC-2009G1/2010 +PO4) were initiated with the addition of ATP (50 µL final reaction volume), following an eighteen minute pre-incubation of enzyme and inhibitor at 22° C. in the reaction mix. The reaction was stopped after 95 minutes by the addition of 50 µL of 30 mM EDTA. Ki determinations were made from a plot of the fractional velocity as a function of inhibitor concentration fit to the Morrison equation with the enzyme concentration as a variable.
- CDK6/Cyclin D3 Mobility Shift Assay The purpose of the CDK6/Cyclin D3 assay is to evaluate the inhibition (% inhibition, Kiapp and Ki values) in the presence of small molecule inhibitors by using a fluorescence based microfluidic mobility shift assay. CDK6/Cyclin D3 catalyses the production of ADP from ATP that accompanies the phosphoryl transfer to the substrate peptide 5-FAM-Dyrktide (5-FAM-RRRFRPASPLRGPPK) (SEQ ID NO:3). The mobility shift assay electrophoretically separates the fluorescently labelled peptides (substrate and phosphorylated product) following the kinase reaction. Both substrate and product are measured and the ratio of these values is used to generate % conversion of substrate to product by the LabChip EZ Reader. Typical reaction solutions contained 2% DMSO (±inhibitor), 2% glycerol, 10 mM MgCl2, 1 mM DTT, 3.5 mM ATP, 0.005% Tween 20 (TW-20), 3 μM 5-FAM-Dyrktide, 4 nM (active sites) activated CDK6/Cyclin D3 in 40 mM HEPES buffer at pH 7.5.Inhibitor Ki determinations for activated CDK6/Cyclin D3 (LJIC-2009G1/2010 +PO4) were initiated with the addition of ATP (50 μL final reaction volume), following an eighteen minute pre-incubation of enzyme and inhibitor at 22° C. in the reaction mix. The reaction was stopped after 95 minutes by the addition of 50 μL of 30 mM EDTA. Ki determinations were made from a plot of the fractional velocity as a function of inhibitor concentration fit to the Morrison equation with the enzyme concentration as a variable.
- Mobility Shift Assay The purpose CDK4/Cyclin D1 assay is to evaluate the inhibition (% inhibition, Kiapp and Ki values) in the presence of small molecule inhibitors by using a fluorescence based microfluidic mobility shift assay. CDK4/Cyclin D1 catalyzes the production of ADP from ATP that accompanies the phosphoryl transfer to the substrate peptide 5-FAM-Dyrktide (5-FAM-RRRFRPASPLRGPPK) (SEQ ID NO:1). The mobility shift assay electrophoretically separates the fluorescently labeled peptides (substrate and phosphorylated product) following the kinase reaction. Both substrate and product are measured and the ratio of these values is used to generate % Conversion of substrate to product by the LabChip EZ Reader. Typical reaction solutions contained 2% DMSO (±inhibitor), 10 mM MgCl2, 1 mM DTT, 3.5 mM ATP, 0.005% TW-20, 3 μM 5-FAM-Dyrktide, 3 nM (active sites) activated CDK4/Cyclin D1 in 40 mM HEPES buffer at pH 7.5.Inhibitor Ki determinations for activated CDK4/Cyclin D1 (2007 E1/2008+PO4) were initiated with the addition of ATP (50 μL final reaction volume), following a eighteen minute pre-incubation of enzyme and inhibitor at 22° C. in the reaction mix. The reaction was stopped after 195 minutes by the addition of 50 μL of 30 mM EDTA. Ki determinations were made from a plot of the fractional velocity as a function of inhibitor concentration fit to the Morrison equation with the enzyme concentration as a variable.
- Mobility Shift Assay The purpose of the CDK6/Cyclin D3 assay is to evaluate the inhibition (% inhibition, Kiapp and Ki values) in the presence of small molecule inhibitors by using a fluorescence based microfluidic mobility shift assay. CDK6/Cyclin D3 catalyzes the production of ADP from ATP that accompanies the phosphoryl transfer to the substrate peptide 5-FAM-Dyrktide (5-FAM-RRRFRPASPLRGPPK) (SEQ ID NO:1). The mobility shift assay electrophoretically separates the fluorescently labeled peptides (substrate and phosphorylated product) following the kinase reaction. Both substrate and product are measured and the ratio of these values is used to generate % conversion of substrate to product by the LabChip EZ Reader. Typical reaction solutions contained 2% DMSO (±inhibitor), 2% glycerol, 10 mM MgCl2, 1 mM DTT, 3.5 mM ATP, 0.005% Tween 20 (TW-20), 3 μM 5-FAM-Dyrktide, 4 nM (active sites) activated CDK6/Cyclin D3 in 40 mM HEPES buffer at pH 7.5.Inhibitor Ki determinations for activated CDK6/Cyclin D3 (LJIC-2009G1/2010+PO4) were initiated with the addition of ATP (50 μL final reaction volume), following a eighteen minute pre-incubation of enzyme and inhibitor at 22° C. in the reaction mix. The reaction was stopped after 95 minutes by the addition of 50 μL of 30 mM EDTA. Ki determinations were made from a plot of the fractional velocity as a function of inhibitor concentration fit to the Morrison equation with the enzyme concentration as a variable.
- Opioid Receptor Binding Assay The Ki (binding affinity) for μ opioid receptors was determined using a competitive displacement assay as previously described in Neumeyer (Journal of Med. Chem. 2012, p 3878), which is incorporated herein in its entirety. Briefly, membrane protein from CHO (Chinese Hamster Ovarian) cells that stably expressed the cloned human μ opioid receptor were incubated with 12 different concentrations of the compound set forth herein in the presence of 0.25 nM [3H]DAMGO (see Tiberi et al., Can. J. Physiol. Pharmacol. 1988, Vol. 66, p 1368, which is incorporated by reference herein in its entirety) in a final volume of 1 mL of 50 mM Tris-HCl, pH 7.5 at 25° C. Incubation times of 60 min were used for [3H]DAMGO (see Gulati et al., Life Sci. 1990, Vol. 47, p 159, which is incorporated by reference herein in its entirety). Nonspecific binding was measured by inclusion of 10 μM naloxone. The binding was terminated by filtering the samples through Schleicher & Schuell No. 32 glass fiber filters using a Brandel 48-well cell harvester. The filters were subsequently washed three times with 3 mL of cold 50 mM Tris-HCl, pH 7.5, and were counted in 2 mL Ecoscint A scintillation fluid. IC50 values were calculated by least squares fit to a logarithm-probit analysis. Ki values of unlabelled compounds were calculated from the equation Ki=(IC50)/1+S where S=(concentration of radioligand)/(Kd of radioligand) (Cheng and Prusoff, 1973).
- Opioid Receptor Binding Assay The Ki (binding affinity) for μ opioid receptors was determined using a competitive displacement assay as previously described in Neumeyer (Journal of Med. Chem. 2012, p3878), which is incorporated herein in its entirety. Briefly, membrane protein from CHO (Chinese Hamster Ovarian) cells that stably expressed the cloned human μ opioid receptor were incubated with 12 different concentrations of the compound set forth herein in the presence of 0.25 nM [3H]DAMGO (see Tiberi et al., Can. J. Physiol. Pharmacol. 1988, Vol. 66, p1368, which is incorporated by reference herein in its entirety) in a final volume of 1 mL of 50 mM Tris-HCl, pH 7.5 at 25° C. Incubation times of 60 min were used for [3H]DAMGO (see Gulati et al., Life Sci. 1990, Vol. 47, p 159, which is incorporated by reference herein in its entirety). Nonspecific binding was measured by inclusion of 10 μM naloxone. The binding was terminated by filtering the samples through Schleicher & Schuell No. 32 glass fiber filters using a Brandel 48-well cell harvester. The filters were subsequently washed three times with 3 mL of cold 50 mM Tris-HCl, pH 7.5, and were counted in 2 mL Ecoscint A scintillation fluid. IC50 values were calculated by least squares fit to a logarithm-probit analysis. Ki values of unlabelled compounds were calculated from the equation Ki=(IC50)/1+S where S=(concentration of radioligand)/(Kd of radioligand) (Cheng and Prusoff, 1973).
- Opioid Receptor Binding Assay The Ki (binding affinity) for opioid receptors was determined using a competitive displacement assay as previously described in Neumeyer (Journal of Med. Chem. 2012, p 3878), which is incorporated herein in its entirety. Briefly, membrane protein from CHO (Chinese Hamster Ovarian) cells that stably expressed the cloned human μ opioid receptor were incubated with 12 different concentrations of the compound set forth herein in the presence of 0.25 nM [3H]DAMGO (see Tiberi et al., Can. J. Physiol. Pharmacol. 1988, Vol. 66, p 1368, which is incorporated by reference herein in its entirety) in a final volume of 1 mL of 50 mM Tris-HCl, pH 7.5 at 25° C. Incubation times of 60 min were used for [3H]DAMGO (see Gulati et al., Life Sci. 1990, Vol. 47, p 159, which is incorporated by reference herein in its entirety). Nonspecific binding was measured by inclusion of 10 μM naloxone. The binding was terminated by filtering the samples through Schleicher & Schuell No. 32 glass fiber filters using a Brandel 48-well cell harvester. The filters were subsequently washed three times with 3 mL of cold 50 mM Tris-HCl, pH 7.5, and were counted in 2 mL Ecoscint A scintillation fluid. IC50 values were calculated by least squares fit to a logarithm-probit analysis. Ki values of unlabelled compounds were calculated from the equation Ki=(IC50)/1+S where S=(concentration of radioligand)/(Kd of radioligand) (Cheng and Prusoff, 1973).
- Opioid Receptor Binding Assay The Ki (binding affinity) for opioid receptors was determined using a competitive displacement assay as previously described in Neumeyer (Journal of Med. Chem. 2012, p 3878), which is incorporated herein in its entirety. Briefly, membrane protein from CHO (Chinese Hamster Ovarian) cells that stably expressed the cloned human opioid receptor were incubated with 12 different concentrations of the compound set forth herein in the presence of 0.25 nM [3H]DAMGO (see Tiberi et al., Can. J. Physiol. Pharmacol. 1988, Vol. 66, p 1368, which is incorporated by reference herein in its entirety) in a final volume of 1 mL of 50 mM Tris-HCl, pH 7.5 at 25° C. Incubation times of 60 min were used for [3H]DAMGO (see Gulati et al., Life Sci. 1990, Vol. 47, p 159, which is incorporated by reference herein in its entirety). Nonspecific binding was measured by inclusion of 10 M naloxone. The binding was terminated by filtering the samples through Schleicher & Schuell No. 32 glass fiber filters using a Brandel 48-well cell harvester. The filters were subsequently washed three times with 3 mL of cold 50 mM Tris-HCl, pH 7.5, and were counted in 2 mL Ecoscint A scintillation fluid. IC50 values were calculated by least squares fit to a logarithm-probit analysis. Ki values of unlabelled compounds were calculated from the equation Ki=(IC50)/1+S where S=(concentration of radioligand)/(Kd of radioligand) (Cheng and Prusoff, 1973).
- ADA Inhibition Assay The reaction velocity was measured by change in absorbance at 265nm (A265) resulting from the deamination of adenosine. The reaction was started by addition of ADA to a mixture of adenosine and test compound. The reaction was followed at room temperature by recording the decrease in A265 for 5 min in SPECTRAmax 250 (Molecular Devices, USA) to automatically calculate Vmax. The inhibition constant (Ki) values of test compounds were determined by Dixon plot.
- Enzyme Inhibition Assay A coupled spectrophotometric assay was used in which ADP generated by ERK2 was converted to ATP by pyruvate kinase with the production of pyruvate from phosphoenol pyruvate. Lactate dehydrogenase reduces pyruvate to lactate with the oxidation of NADH. NADH depletion was monitored at 340 nm using a microplate reader. The decrease of absorbance was monitored as a function of time and the resulting data was fitted to a competitive inhibition kinetic model to determine the Ki.
- Enzyme Inhibition Assay The recombinant human cathepsin enzyme was preincubated with inhibitor for 20 minutes prior to addition of substrate. The substrate hydrolysis was monitored by the increase in fluorescence at an excitation wavelength of 380nm and an emission wavelength of 450 nm on a Gemini EM fluorometer. The reaction progress curve was fitted to the Morrison equation using PlateKi (BioKin) and the apparent inhibition constant was converted to the inhibition constant (Ki) for competitive inhibitors.
- Fluorescence Polarization Affinity Measurements Samples for fluorescence polarization affinity measurements were prepared by addition of serial dilutions of target protein to each well containing antagonist and polarization probe in the buffer. Samples were read after 30-min incubation. Fluorescence polarization values were plotted as a function of the antagonist concentration, and the IC50 values were obtained by fitting the data to a four-parameter equation using KaleidaGraph software. Ki values for the antagonists were determined from the IC50 values.
- Fluorescence Polarization Affinity Measurements. Samples for fluorescence polarization affinity measurements were prepared by addition of serial dilutions of target protein to each well containing antagonist and polarization probe in the buffer. Samples were read after 30-min incubation. Fluorescence polarization values were plotted as a function of the antagonist concentration, and the IC50 values were obtained by fitting the data to a four-parameter equation using KaleidaGraph software. Ki values for the antagonists were determined from the IC50 values.
- Inhibition Assay Compounds (10 mM) were also evaluated for inhibition of binding to a7 nAChR using [125I]iodoMLA as previously reported in Carroll et al. The binding assays were conducted and the Ki values calculated as described in Carroll, F. I. et al., "Synthesis, nicotinic acetylcholine receptor binding, and antinociceptive properties of 2-exo-2-(2',3'-disubstituted 5'-pyridinyl)-7- azabicyclo[2.2.1]heptanes: epibatidine analogues." J. Med. Chem. 2002, 45, 4755-4761.
- PON Activity Assay PON activities were measured in the presence of different drug concentrations. Control activity was assumed to be 100% in the absence of inhibitor. Experiments of all compounds were tested in triplicate at each concentration used and Activity%-[Drug] graphs were drawn for each drug. Determination of Ki values was performed by using three different inhibitor concentrations. In these experiments, paraoxone was used as substrate at five different concentrations (0.15, 0.3, 0.45, 0.6, and 0.75 mM).
- Protease Inhibition Assay Sensitivity of HIV-1 protease activity to protease inhibitors was determined by a peptide substrate cleavage assay. Substrates and cleavage fragments were separated by reverse-phase HPLC, detected by absorbance at 215 nm, and quantified by comparison with a synthetic product standard. For highly potent inhibitors, their Ki values were analyzed by a mathematical model for tight-binding inhibitors, in which the concentration of inhibitor is less than or approximately equal to the enzyme concentration.
- Radioligand Binding Assay and Functional [35S]GTP-gamma-S Binding Assay Ligand displacement assays were performed on CHO cells membranes expressing hH3R. Retained radioactivity was determined by liquid scintillation counting. Nonspecific binding was determined in the presence of 1 uM thioperamide. The Ki values were calculated based on an experimentally determined appropriate Kd value according to Cheng and Prusoff. EC50 is a measure of functional property of compound on [35S]GTP-gamma-S binding to membranes expressing H3R receptors.
- CDK4 Activity Assay CDK4 and cyclin D1 were expressed in a baculovirus expression system and subsequently purified. The catalytic activity of the CDK4 protein was assayed by measuring the phosphorylation of a truncated GST-Rb protein (residues 773-928) in the presence of ATP/ [gamma-33P] ATP. 33P incorporation was measured with a scintillation counter. IC50 values were determined by a least-squares fit to the equation, CPM = Vmax X(1 - ([I]/(IC50 + [I]))) + nonspecific binding. Ki,app = IC50/(1 + [ATP]/Km).
- Enzyme Inhibition Assay Compounds were tested for their ability to inhibit BACE-1 hydrolysis of the internally quenched fluorescent substrate FS-2. Reactions were initiated by the addition of BACE-1 to reaction buffer containing test compound and substrate, and brief mixing. The increase in fluorescence over time was monitored on a Gemini XS fluorometric plate reader using excitation at 328 nm and emission at 405 nm. Initial rates were fit to an equation, and Ki values were determined using Graphpad Prism software.
- Enzyme Inhibition Assay The enzyme reactions were initiated by the addition of substrate, and the color developed from the release of p-nitroanilide from each chromogenic substrate was monitored at 405 nm using a Thermomax kinetic plate reader (Molecular Devices). The initial velocities measured were used to determine the amount of inhibitor required to diminish 50% of the control velocity; this concentration was defined as the IC50 of the inhibitor. The apparent Ki values were then calculated according to the Cheng-P
- Fluorescence Polarization Assay Fluorescence polarization assays used GST-tagged enzyme and an ATP-competitive Rhodamine-green labelled fluoroligand. These components were dissolved in a buffer. Thirty microliters of this mixture were added to wells containing test compound and incubated for 30-60 min at room temperature. Fluorescence anisotropy was read in a Molecular Devices Acquest (excitation 485 nm/emission 535 nm). All values quoted are means of IC50 results. Ki values were calculated from IC50s using a modified Cheng-Prusoff equation.
- Fluorescence Polarization Assay Fluorescence polarization was measured on an Ultra plate reader (Tecan) at excitation and emission wavelengths of 485 and 530 nm, respectively. The equilibrium binding curves were drawn by plotting polarization units as a function of recombinant XIAP concentration. All experiments were performed in black, flat-bottomed, 96-well microplates. The Smac mimetics were evaluated for their ability to displace the fluorescent probe from recombinant protein. The Ki values were derived from IC50s according to Cheng-Prusoff equation.
- Measurement of FBSAChE/EqBuChE Inhibitory Activity Inhibition of enzyme activity was measured over a substrate concentration range of 0.01-30 mM and at least six inhibitor concentrations to determine competitive and noncompetitive inhibitors. Plots of initial velocities versus substrate concentrations at a series of inhibitor concentrations were analyzed by nonlinear least-squares methods to determine the values of Km and Vmax. Nonlinear regression analysis of the plots of Vmax/Km values versus [THA-An] was used for the determination of Ki value
- Mu Opioid Receptor Binding Assay and Antagonist Functionality Assay In the binding assays, the results were expressed as percent inhibition of the control radioligand specific binding. The IC50 values (concentration causing a half maximal inhibition of control specific binding) were determined by non-linear regression analysis of the competition curves using Hill equation curve fitting. The inhibition constants (Ki) were calculated from the Cheng Prusoff equation. EC50/IC50 measures the antagonist activities on mu-agonist triggered luminescence in AequoScreen cells.
- Radioligand Labeled Binding Assay and Phosphatidylinositol Hydrolysis Assay for the CCK Receptor Log IC50 values for each test compound were determined from nonlinear regression analysis of data collected from two independent experiments performed in duplicates (40 independent experimental values) using GraphPad Prizm 4 software (GraphPad, San Diego, California). The inhibition constant (Ki) was calculated from the antilogarithmic IC50 value by the Cheng and Prusoff equation. EC50/IC50 values were obtained from measuring the effect of test compounds on agonist-induced phosphatidylinositol hydrolysis.
- Receptor Binding Assay The membranes prepared from HEK cells transfected with adenosine receptors were used in binding assays. Nonspecific binding was determined in the presence of excess of DPCPX or CGS15943 for the A1 and A2A membranes, respectively. Bound and free ligands were separated by rapid vacuum filtration, and the bound radioligand was determined by scintillation counting. Binding data were analyzed by nonlinear least-squares curve-fitting algorithms using GraphPad Prism. Ki values were calculated from IC50 values using the Cheng-Prusoff equation.
- Receptor Binding Assay The Ki (binding affinity) for μ-receptor was determined with a previously described method using a competitive displacement assay (Neumeyer et al., J. Med. Chem., v. 46, p. 5162-5170, 2003). Membrane protein from CHO (Chinese Hamster Ovarian) cells that stably expressed one type of the cloned human opioid receptor were incubated with 12 different concentrations of the compound in the presence of 0.25 nM [3H]DAMGO, 0.2 nM [3H]naltrindole or 1 nM [3H]U69,593 in a final volume of 1 mL of 50 mM Tris-HCl, pH 7.5 at 25° C. Incubation times of 60 min were used for [3H]DAMGO and [3H]U69,593. Because of a slower association of [3H]naltrindole with the receptor, a 3 h incubation was used with this radioligand. Samples incubated with [3H]naltrindole also contained 10 mM MgCl2 and 0.5 mM phenylmethylsulfonyl fluoride. Nonspecific binding was measured by inclusion of 10 μM naloxone. The binding was terminated by filtering the samples through Schleicher & Schuell No. 32 glass fiber filters using a Brandel 48-well cell harvester. The filters were subsequently washed three times with 3 mL of cold 50 mM Tris-HCl, pH 7.5, and were counted in 2 mL Ecoscint A scintillation fluid. For [3H]naltrindole and [3H]U69,593 binding, the filters were soaked in 0.1% polyethylenimine for at least 60 min before use. IC50 values will be calculated by least squares fit to a logarithm-probit analysis. Ki values of unlabelled compounds were calculated from the equation Ki=(IC50)/1+S where S=(concentration of radioligand)/(Kd of radioligand).
- Binding Affinity Assay Binding affinities for fentanyl derivatives 1 and 6a-e at KOR, MOR, and DOR were determined by competitive displacement of [3H] diprenorphine as previously reported. In a 96-well plate, cell membranes (10-20 μg of protein) and [3H] diprenorphine (0.2 nM) were shaken in Tris-HCl buffer (50 mM, pH 7.4) with various concentrations of test compound at room temperature for 1 h, allowing the mixture to reach equilibrium. Nonspecific binding was determined using the opioid antagonist naloxone (10 μM), and total binding was determined using vehicle in the absence of competitive ligand. After incubation, membranes were filtered through Whatman GF/C 1.2 μm glass fiber filters and washed with 50 mM Tris-HCl buffer. The radioactivity remaining on the filters was then quantified by liquid scintillation counting in a PerkinElmer Microbeta 2450 after saturation with EcoLume liquid scintillation cocktail. Binding affinity (Ki) values were calculated via “One-site-Fit Ki” nonlinear regression analysis using GraphPad Prism software from at least three independent binding assays performed in duplicate.
- Binding Assay The affinity of the test compounds was determined by radioligand competition binding assay, using the known compound [3H]Ro-15-1788 (Flumazenil) (Perkin Elmer, 85.4 Ci/mmol) and the human recombinant GABA A receptor containing the alpha2, beta2, and gamma2 subunits.Membranes were prepared from HEK cells expressing hGABA A alpha2beta2-gamma2 receptor, and validated to ascertain protein concentration, receptor expression and to determine the Kd of the flumazenil as well as the Ki of a standard set of compounds before being used to test new compounds.The assay was carried out in 96 well plates; testing compounds using a 10 point semi-log dilution range from 19 uM top concentration. 100 ul of radioligand and 100 ul of membrane in 50 mM Tris-HCl and 0.05% F127 with 1 ul of test compound was incubated for 2 hours to allow the reaction to achieve equilibrium, and then harvested onto filter plates, dried and counted on a TopCount NXT. The data was analysed, and the Ki values were presented as the geometric mean of at least two replicates.
- Binding Assay The affinity of the test compounds was determined by radioligand competition binding assay, using the known compound [3H]Ro-15-1788 (Flumazenil) (Perkin Elmer, 85.4 Ci/mmol) and the human recombinant GABA A receptor containing the alpha2, beta2, and gamma3 subunits.Membranes were prepared from HEK cells expressing hGABA A alpha2beta2-gamma3 receptor, and validated to ascertain protein concentration, receptor expression and to determine the Kd of the flumazenil as well as the Ki of a standard set of compounds before being used to test new compounds.The assay was carried out in 96 well plates; testing compounds using a 10 point semi-log dilution range from 19 uM top concentration. 100 ul of radioligand and 100 ul of membrane in 50 mM Tris-HCl and 0.05% F127 with 1 ul of test compound was incubated for 2 hours to allow the reaction to achieve equilibrium, and then harvested onto filter plates, dried and counted on a TopCount NXT. The data was analysed, and the Ki values were presented as the geometric mean of at least two replicates.
- Binding Competition Assay NK3: The ability of compounds of the invention to inhibit the binding of the NK-3 receptor selective antagonist 3H-SB222200 was assessed by an in vitro radioligand binding assay. Membranes were prepared from Chinese hamster ovary recombinant cells stably expressing the human NK3 receptor. The membranes were incubated with 5 nM 3H-SB222200 (ARC) in a HEPES 25 mM/NaCl 0.1M/CaCl2 1 mM/MgCl2 5 Mm/BSA 0.5%/Saponin 10 μg/ml buffer at pH 7.4 and various concentrations of compounds of the invention. The amount of 3H-SB222200 bound to the receptor was determined after filtration by the quantification of membrane associated radioactivity using the TopCount-NXT reader (Packard). Competition curves were obtained for compounds of the invention and the concentration that displaced 50% of bound radioligand (IC50) were determined by linear regression analysis and then the apparent inhibition constant (Ki) values were calculated by the following equation: Ki=IC50/(1+[L]/Kd) where [L] is the concentration of free radioligand and Kd is its dissociation constant at the receptor, derived from saturation binding experiments.
- Binding assay NK-2 Binding assays consisted of 25 ul of membrane suspension (approximately 3.75 ug of protein/well in a 96 well plate), 50 ul of compound or reference ligand (Neurokinin A) at increasing concentrations (diluted in assay buffer) and 0.1 nM [125I]-Neurokinin A. The plate was incubated 60 min at 25 C. in a water bath and then filtered over GF/C filters (Perkin Elmer, 6005174, presoaked in assay buffer without saponine for 2 h at room temperature) with a Filtration unit (Perkin Elmer). The radioactivity retained on the filters was measured by using the TopCount-NXT reader (Packard). Competition curves were obtained for compounds of the invention and the concentrations of compounds which displaced 50% of bound radioligand (IC50) were determined and then apparent inhibition constant Ki values were calculated by the following equation: Ki=IC50/(1+[L]/KD) where [L] is the concentration of free radioligand and KD is its dissociation constant at the receptor, derived from saturation binding experiments (Cheng and Prusoff, 1973).
- Determining human Vmat2 Inhibitory Activity of a Compound The human Ki's for the compounds listed in Table 11 were determined using a slightly modified procedure shown below (see data in column under the heading Ki nM ). In a total volume of 0.15 mL in low-binding 96-well plates (Corning #3605), twelve concentrations of Compound 1-1 and R,R,R-DHTBZ were competed against 10 nM 3H-dihydrotetrabenezine (American Radiolabeled Chemicals, Kd 2.6 nM) on rat forebrain homogenate (100 μg membrane protein per well) or human platelet homogenate (15 μg membrane protein per well) in VMAT2 binding buffer (Dulbecco's phosphate buffered saline, 1 mM EDTA, pH 7.4). Following incubation at 25° C. for 90 minutes, bound radioligand was collected by rapid filtration onto GF/B glass fiber filters using a Unifilter-96 Harvester (PerkinElmer). Filter plates were pre-treated with 0.1% polyethylenimine and allowed to dry overnight, and following harvesting the filter plates were washed with 800 d VMAT2 binding buffer. Bound radioligand was quantified by scintillation counting using a Topcount NXT (PerkinElmer).
- Fluorescence Polarization-Based (FP-Based) Binding Assay The dose-dependent binding experiments were carried out with serial dilutions of the tested compounds in DMSO. A 5 ul sample of the tested samples and preincubated MDM2 protein and PMDM6-F peptide were added in Dynex 96-well, black, round-bottom plates (Fisher Scientific). For each assay, the controls included the MDM2 protein and PMDM6-F (equivalent to 0% inhibition), only PMDM6-F peptide (equivalent to 100% inhibition). The polarization values were measured after 3 hrs of incubation using an ULTRA READER (Tecan U.S. Inc., Research Triangle Park, NC). The IC50 values, i.e. the inhibitor concentration at which 50% of bound peptide is displaced, were determined from a plot using nonlinear least-squares analysis. Curve fitting was performed using GRAPHPAD PRISM software (GraphPad Software, Inc., San Diego, CA). To calculate the binding affinity constants (Ki) of inhibitors, a web-based computer program was developed for computing the Ki values for inhibitors in FP-based binding assays based upon an equation.
- JAK2 Inhibition Assay To determine the inhibition constants (Ki), compounds were diluted serially in DMSO and added to 50 kinase reactions containing 0.2 nM purified JAK2 enzyme, 100 mM Hepes pH7.2, 0.015% Brij-35, 1.5 μM peptide substrate, 25 μM ATP, 10 mM MgCl2, 4 mM DTT at a final DMSO concentration of 2%. Reactions were incubated at 22° C. in 384-well polypropylene microtiter plates for 30 minutes and then stopped by addition of 250 μL of an EDTA containing solution (100 mM Hepes pH 7.2, 0.015% Brij-35, 150 mM EDTA), resulting in a final EDTA concentration of 50 mM. After termination of the kinase reaction, the proportion of phosphorylated product was determined as a fraction of total peptide substrate using the Caliper LabChip 3000 according to the manufacturer's specifications. Ki values were then determined using the Morrison tight binding model. Morrison, J. F., Biochim. Biophys. Acta. 185:269-296 (1969); William, J. W. and Morrison, J. F., Meth. Enzymol., 63:437-467 (1979).
- JAK3 Inhibition Assay To determine inhibition constants (Ki), compounds were diluted serially in DMSO and added to 50 uL kinase reactions containing 5 nM purified JAK3 enzyme, 100 mM Hepes pH7.2, 0.015% Brij-35, 1.5 uM peptide substrate, 5 uM ATP, 10 mM MgCl2, 4 mM DTT at a final DMSO concentration of 2%. Reactions were incubated at 22° C. in 384-well polypropylene microtiter plates for 30 minutes and then stopped by addition of 25 uL of an EDTA containing solution (100 mM Hepes pH 7.2, 0.015% Brij-35, 150 mM EDTA), resulting in a final EDTA concentration of 50 mM. After termination of the kinase reaction, the proportion of phosphorylated product was determined as a fraction of total peptide substrate using the Caliper LabChip 3000 according to the manufacturer's specifications. Ki values were then determined using the Morrison tight binding model (Morrison, J. F., Biochim. Biophys. Acta. 185:269-296 (1969); William, J. W. and Morrison, J. F., Meth. Enzymol., 63:437-467 (1979)).
- Kallikrein Assay Kallikrein determinations were made in 50 mM HEPES buffer at pH 7.4 containing 150 mM NaCl, 5 mM CaC12, and 0.1% PEG 8000 (polyethylene glycol; Fisher Scientific). Determinations were made using purified Human plasma kallikrein at a final concentration of 0.5 nM (Enzyme Research Laboratories) and the synthetic substrate, Acetyl-K-P-R-AFC (Sigma # C6608) at a concentration of 100 mM. Activity assays were performed by diluting a stock solution of substrate at least tenfold to a final concentration ≤ 0.2 Km into a solution containing enzyme or enzyme equilibrated with inhibitor. Times required to achieve equilibration between enzyme and inhibitor were determined in control experiments. The reactions were performed under linear progress curve conditions and fluorescence increase measured at 405 Ex/510 Em nm. Values were converted to percent inhibition of the control reaction (after subtracting 100% Inhibition value). IC50 was determined by inflection point from a four parameter logistic curve fit. Ki was calculated using the Cheng Prusoff equation, Ki = IC50/(1+([S]/Km)).
- Plasma Kallikrein Activity Assay Plasma kallikrein activity assay. The effect of compounds of the invention on human plasma kallikrein activity was determined using the chromogenic substrates (DiaPharma Group, Inc., West Chester, Ohio, USA). In these experiments, 2 nM kallikrein (Enzyme Research Laboratories, South Bend, Ind., USA) was incubated with 80 μM S2302 (H-D-Pro-Phe-Arg-p-nitroaniline) in the absence or presence of increasing concentrations of compounds of the invention in a final volume of 200 μL Tris-HCl buffer (200 mM NaCl; 2.5 mM CaCl2; 50 mM Tris-HCl, pH 7.8). After incubation at 30° C., the activity of kallikrein was measured as a change in absorbance at OD 405 nm using BioTek PowerWave X340 Microplate Reader (Winooski, Vt., USA). Data were analyzed using SigmaPlot software (Systat Software, Inc., San Jose, Calif., USA) (Four Parameter Logistic Curve). Ki values for the inhibitors were determined using the ChengPrusoff equation.The compounds disclosed in this application have Ki values less than 1 micromolar (μM) for the plasma kallikrein enzyme.
- Radioligand Competition Binding Assay The affinity of the test compounds was determined by radioligand competition binding assay, using the known compound [3H]Ro-15-1788 (Flumazenil) (Perkin Elmer, 85.4 Ci/mmol) and the human recombinant GABA A receptor containing the alpha2, beta2, and gamma3 subunits.Membranes were prepared from HEK cells expressing hGABA A alpha2beta2- gamma3 receptor, and validated to ascertain protein concentration, receptor expression and to determine the Kd of the flumazenil as well as the Ki of a standard set of compounds before being used to test new compounds.The assay was carried out in 96 well plates; testing compounds using a 10 point semi-log dilution range from 19 uM top concentration. 100 ul of radioligand and 100 ul of membrane in 50 mM Tris-HCI and 0.05% F127 with 1 ul of test compound was incubated for 2 hours to allow the reaction to achieve equilibrium, and then harvested onto filter plates, dried and counted on a TopCount NXT. The data was analysed, and the Ki values were presented.
- Adenosine A1 Receptor Binding Assay The displacement of [3H]DPCPX binding from the A1AR was determined using DDT1 MF-2 cell membranes. Nonspecific binding was determined in parallel assays that contained 1 uM alprenolol. The radioactivity was determined in a gamma counter. All assays were performed in triplicate. The concentration of compounds that inhibited radioligand binding by 50% (IC50) was obtained by nonlinear regression analysis using GraphPad Prism. The dissociation constant (Ki) was obtained from IC50 value by using the conversion described by Cheng and Prusoff.
- BACE-1 Enzymatic Assay BACE-1 activity was measured at pH 5 using the FS1 FRET substrate. Compounds were preincubated with recombinant BACE-1 for 20 min before adding substrate. Cleavage of substrate was monitored on a Polarstar fluorometer (Ex 390 nm/Em 520 nm) for 20 min, reading fluorescence at 1 min intervals to determine the rate of the reaction (Vi) at each inhibitor concentration, [I]. Ki was determined from the curve fit of an equation to the graph of [I] vs Vi.
- Beta-2 Adrenergic Receptor Binding Assay and Agonist Functionality Assay In the binding assays, the results were expressed as percent inhibition of the control radioligand specific binding. The IC50 values (concentration causing a half maximal inhibition of control specific binding) were determined by non-linear regression analysis of the competition curves using Hill equation curve fitting. The inhibition constants (Ki) were calculated from the Cheng Prusoff equation. EC50 values measure the receptor agonist activities functionally using a quantitative ex vivo guinea pig trachea bioassay.
- Binding Assay The ability of test compounds to displace 3H-raclopride at the D2s receptor can be determined on membranes from D2s-transfected CHO cells (Bmax 13 pmol/mg protein). An assay can use a standard 96-well glass-fiber filter plate to retain radioligand bound by the receptor. Retained 3H can be determined in a TopCount scintillation plate counter following the addition of a liquid scintillant to each well. Compounds can be evaluated for their potency using competition curve analysis, resulting in calculated Ki values.
- CA Inhibition Assay An Applied Photophysics stopped-flow instrument has been used for assaying the CA-catalyzed CO2 hydration activity. Phenol red has been used as indicator, working at the absorbance maximum of 557 nm. The inhibition constants were obtained by nonlinear least-squares methods. The IC50 was obtained by using curve-fitting algorithm, and Ki values were calculated by using the Cheng-Prusoff equation. The catalytic activity of these enzymes was calculated from Lineweaver-Burk plots, and represent the mean from at least three different determinations.
- CA Inhibition Assay An Applied Photophysics stopped-flow instrument has been used for assaying the CA-catalyzed CO2 hydration activity. Phenol red has been used as indicator, working at the absorbance maximum of 557 nm. The inhibition constants were obtained by nonlinear least-squares methods. The IC50 was obtained by using curve-fitting algorithm, and Ki values were calculated by using the Cheng-Prusoff equation. The catalytic activity of these enzymes was calculated from Lineweaver-Burk plots, and represent the mean from at least three different determinations.
- CB1 Receptor Binding Protocol 8 ug of membranes (20 ul of 1:8 dilution in incubation buffer) was incubated with 5 ul of drug solution (10E-4M to 10E-12M) and 5ul of 5.4 nM [3H]CP55,940 in a total volume of 200 ul for 90 mins at 30 C. Non-specific binding was determined using 10 uM WIN55,212-2 (Ki=4.4 nM). The membranes were filtered and the filters washed 7x with 0.2 ml ice-cold incubation buffer and allowed to air dry under vacuum.
- CB2 Receptor Binding Protocol 15.3 ug of membranes (20 ul of 1:20 dilution in incubation buffer) was incubated with 5 ul of drug solution (10E-4M to 10E-12M) and 5ul of 5.4 nM [3H]CP55,940 in a total volume of 200 ul for 90 mins at 30 C. Non-specific binding was determined using 10 uM WIN55,212-2 (Ki=4.4 nM). The membranes were filtered and the filters washed 7x with 0.2 ml ice-cold incubation buffer and allowed to air dry under vacuum.
- Direct Competition Assay The Ki for each inhibitor was determined by direct competition assays under steady-state conditions. The initial velocity was measured in the presence of a constant concentration of enzyme (3 nM for VIM-2 and 4 nM for VIM-24) with increasing concentrations of inhibitor (5−60 μM) against a fixed concentration (5KM) of the indicator substrate, NCF, as previously described. The reactionswere started by addition of VIM-2 or VIM-24 to substrate or to mixtures of substrate and inhibitor.
- Fluorescence Polarization (FP) Assay and FL5.12 Cellular Assay The binding affinities (Ki) of compounds were determined using fluorescence polarization assays (FPA) that measure their ability to competitively displace a Bad-derived peptide from Bcl-xL. IC50 values were binding affinities measured in the presence of 10% human serum. Compound efficacy (EC50) in a cellular context was evaluated by testing their ability to reverse the protection from cytokine withdrawal afforded by overexpression of Bcl-xL in the IL-3 dependent murine pro-B cell line FL5.12.
- Foregoing Assay The PDE10 Ki is a measure of the ability of the test compound to inhibit the action of the PDE10 enzyme. The final product may be further modified, for example, by manipulation of substituents. These manipulations may include, but are not limited to, reduction, oxidation, alkylation, acylation, and hydrolysis reactions which are commonly known to those skilled in the art. In some cases the order of carrying out the foregoing reaction schemes may be varied to facilitate the reaction or to avoid unwanted reaction products.
- Inhibition Assay Assays for slow-onset inhibitors were carried out by adding 1 nM PaMTIP into reaction mixtures at 25 °C. containing 100 mM Hepes, pH 7.4, 100 mM phosphate, pH 7.4, 2 mM MTI, 5 mM DTT, 0.5 unit of xanthine oxidase and variable inhibitor concentration. Inhibitors were present at >10 times the enzyme concentration. Assays for MTA inhibition used 200 μM MTI. Controls having no enzyme and no inhibitor were included in all of the inhibition assays. Ki is the inhibition constant.
- Kinetic Studies Inhibitor concentrations varied from 0.25 to 5 times the Ki value in 50 mM sodium phosphate, 100 mM sodium chloride buffer, pH 7.0, at 30 °C. 2-Chloro-4-nitrophenyl α-d-maltotrioside (CNP-G3) was used as the substrate in a similar range of concentrations. Initial reaction rates for the release of chloronitrophenolate were measured and the further progress of substrate cleavage monitored continuously. Reactions were performed on a Varian Cary 4000 UV/Vis spectrophotometer at 400 nm and 30 °C.
- MMP Inhibition Assay A continuous assay was used in which the substrate is a synthetic peptide containing a fluorescent group (7-methoxycoumarin), which is quenched by energy transfer to a 2,4-dinitrophenyl group. When the peptide was cleaved by MMPs, an increase in fluorescence was observed. The enzymatic reactions were initiated by adding the substrate, and the initial rate of the cleavage reaction was determined immediately after substrate addition. For most MMP assays in this study, the IC50 value is approximately 2-fold of the Ki value.
- PTP1B and TCPTP Inhibition Assay The phosphatase activity resulted in the formation of the colored product p-nitrophenol, which was continuously monitored at 405 nm every 30 s for 15 min using a plate reader. For each concentration of test compound or DMSO control, the initial rates were used to fit the rectangular hyperbola of Michaelis-Menten by nonlinear regression analysis. The ratio of the apparent Km/Vmax vs inhibitor concentration was plotted, and the Ki was calculated by linear regression to be the negative X-intercept.
- Radioligand Labeled Binding Assay and [35S]GTP-gamma-S Binding Assay Log IC50 values for each test compound were determined from nonlinear regression analysis of data collected from two independent experiments performed in duplicates (40 independent experimental values) using GraphPad Prizm 4 software (GraphPad, San Diego, California). The inhibition constant (Ki) was calculated from the antilogarithmic IC50 value by the Cheng and Prusoff equation. Opioid agonist functional activities of test compounds, measured as EC50 values were obtained from [35S]GTP-gamma-S binding assay
- Radioligand Labeled Binding Assay and [35S]GTP-gamma-S Binding Assay Log IC50 values for each test compound were determined from nonlinear regression analysis of data collected from two independent experiments performed in duplicates (40 independent experimental values) using GraphPad Prizm 4 software (GraphPad, San Diego, California). The inhibition constant (Ki) was calculated from the antilogarithmic IC50 value by the Cheng and Prusoff equation. Opioid agonist functional activities of test compounds, measured as EC50 values were obtained from [35S]GTP-gamma-S binding assay.
- Receptor Binding Assay The membranes prepared from Flp-In HEK cells transfected with adenosine receptors were used in binding assays. Nonspecific binding was determined in the presence of excess of DPCPX or CGS15943 for the A1 and A2A membranes, respectively. Bound and free ligands were separated by rapid vacuum filtration, and the bound radioligand was determined by scintillation counting. Binding data were analyzed by nonlinear least-squares curve-fitting algorithms using GraphPad Prism. Ki values were calculated from IC50 values using the Cheng-Prusoff equation.
- beta2 Adrenergic Receptor Binding Assay The displacement of [125I]-(-)iodopindolol binding from the beta2AR was determined using DDT1 MF-2 cell membranes. Nonspecific binding was determined in parallel assays that contained 1 uM alprenolol. The radioactivity was determined in a gamma counter. All assays were performed in triplicate. The concentration of compounds that inhibited radioligand binding by 50% (IC50) was obtained by nonlinear regression analysis using GraphPad Prism. The dissociation constant (Ki) was obtained from IC50 value by using the conversion described by Cheng and Prusoff.
- 5-HT2C Receptor Binding Assay A solution of 200 μL in total was prepared by mixing 50 μL of [3H] mesulergine (manufactured by GE Healthcare) diluted with 50 mmol/L Tris-HCl (pH=7.4) (final concentration: about 2 nmol/L), 149 μL of the h-5-HT2C/CHO membrane preparation (protein amount: 20 μg/well), and 1 μL of the test drug dissolved in dimethylsulfoxide. The solution was reacted at 37° C. for 30 minutes, and then quickly suction-filtered under reduced pressure through a glass fiber filter coated with 1% aq. bovine serum albumin. The glass fiber filter was washed twice with 250 μL of 50 mmol/L Tris-HCl (pH=7.4), placed in a plastic vial containing 4 mL of liquid scintillator (ACS-II, manufactured by Amersham) or Ecoscint A (manufactured by National Diagnostics), and the remaining radioactivity on the filter paper was assayed with a liquid scintillation counter. The non-specific binding of [3H] mesulergine was defined as a binding amount in the presence of 10 μmol/L SB206553 (manufactured by Sigma Aldrich). The IC50 value was calculated according to Hill analysis, and the binding inhibition constant (Ki) was calculated according to the following formula: Binding inhibition constant (Ki)=IC50/(1+S/Kd) wherein S is a concentration of the added [3H] mesulergine, and Kd is a binding dissociation constant of [3H] mesulergine which was calculated from a saturated binding assay using the same cell membrane. A lower Ki value (i.e. a lower 5-HT2C binding inhibition constant) means that the test drug has a higher affinity for human serotonin reuptake inhibitory action.
- 5-HT2C Receptor Binding Assay A solution of 200 μL in total was prepared by mixing 50 μL of [3H] mesulergine (manufactured by GE Healthcare) diluted with 50 mmol/L Tris-HCl (pH=7.4) (final concentration: about 2 nmol/L), 149 μL of the h-5-HT2C/CHO membrane preparation (protein amount: 20 μg/well), and 1 μL of the test drug dissolved in dimethylsulfoxide. The solution was reacted at 37° C. for 30 minutes, and then quickly suction-filtered under reduced pressure through a glass fiber filter coated with 1% aq. bovine serum albumin. The glass fiber filter was washed twice with 250 μL of 50 mmol/L Tris-HCl (pH=7.4), placed in a plastic vial containing 4 mL of liquid scintillator (ACS-II, manufactured by Amersham) or Ecoscint A (manufactured by National Diagnostics), and the remaining radioactivity on the filter paper was assayed with a liquid scintillation counter. The non-specific binding of [3H] mesulergine was defined as a binding amount in the presence of 10 μmol/L SB206553 (manufactured by Sigma Aldrich). The IC50 value was calculated according to Hill analysis, and the binding inhibition constant (Ki) was calculated according to the following formula:Binding inhibition constant (Ki)=IC50/(1+S/Kd)wherein S is a concentration of the added [3H] mesulergine, and Kd is a binding dissociation constant of [3H] mesulergine which was calculated from a saturated binding assay using the same cell membrane. A lower Ki value (i.e. a lower 5-HT2C binding inhibition constant) means that the test drug has a higher affinity for human serotonin reuptake inhibitory action.
- DPP Inhibition Assay The DPP activity resulted in the formation of the fluorescent product amidomethylcoumarin (AMC), which was monitored by excitation at 355 nm and measurement of fluorescent emission at 460 nm. For each concentration of inhibitor or DMSO control, the steady state rates were used to fit a rectangular hyperbola, from which Km and Vmax values were determined by nonlinear regression analysis. The ratio of the Km/Vmax vs inhibitor concentration was plotted and the negative X-intercept, as calculated by linear regression, was the competitive Ki.
- Protease Inhibition Assay Inhibition of HIV protease was measured by assay of the cleavage of a fluorescent peptide substrate. The fluorescent product (2-aminobenzoyl-Ala-Thr-His-Gln-Val-Tyr) was separated from the fluorescent substrate by anion-exchange HPLC on a Mono-Q anion-exchange column (Pharmacia), and fluorescence was monitored at an excitation wavelength of 330 nm and an emission wavelength of 430 nm. Ki values for inhibitor binding were estimated at fixed concentrations of substrate and inhibitor from fractional activity measurements by use of the modified Michaelis-Menten equation.
- Radioligand Binding Assay and [35S] GTP-gamma-S Binding Assay A scintillation proximity assay was used for radioligand competition and saturation binding assays. Nonspecific binding was determined in the presence of 1 uM PGD2. Binding activity was determined by using a 1450 Microbeta scintillation counter (Wallac, UK). Ki values were calculated by using the Cheng-Prusoff equation, and represent the average of at least three independent dose-response experiments. EC50/IC50 values were obtained from GTP-gamma-S binding assay, which measures antagonist activity of compounds in the presence of 80 nM PGD2.